

Key Insights
The Smart Utilities Management market is poised for significant expansion, projecting a robust CAGR of 12.9%. With a current market size of 56.48 billion as of the 2024 base year, this sector is rapidly growing. Key growth drivers include increasing urbanization, the escalating demand for dependable energy infrastructure, and the critical need for enhanced operational efficiency and reduced carbon emissions. The widespread adoption of smart meters, advanced energy monitoring and management systems, and the integration of smart grid technologies are fueling this expansion. The market encompasses Meter Data Management Systems (MDMS), Energy Monitoring/Management, and Smart Distribution Management, reflecting diverse utility applications. While North America and Europe currently lead, the Asia-Pacific region is anticipated to experience substantial growth due to rapid industrialization and smart grid investments. Potential challenges include high initial implementation costs, cybersecurity vulnerabilities, and the requirement for a skilled workforce. However, the long-term advantages of improved grid efficiency, reduced energy losses, enhanced customer service, and optimized resource allocation are expected to drive sustained market growth.
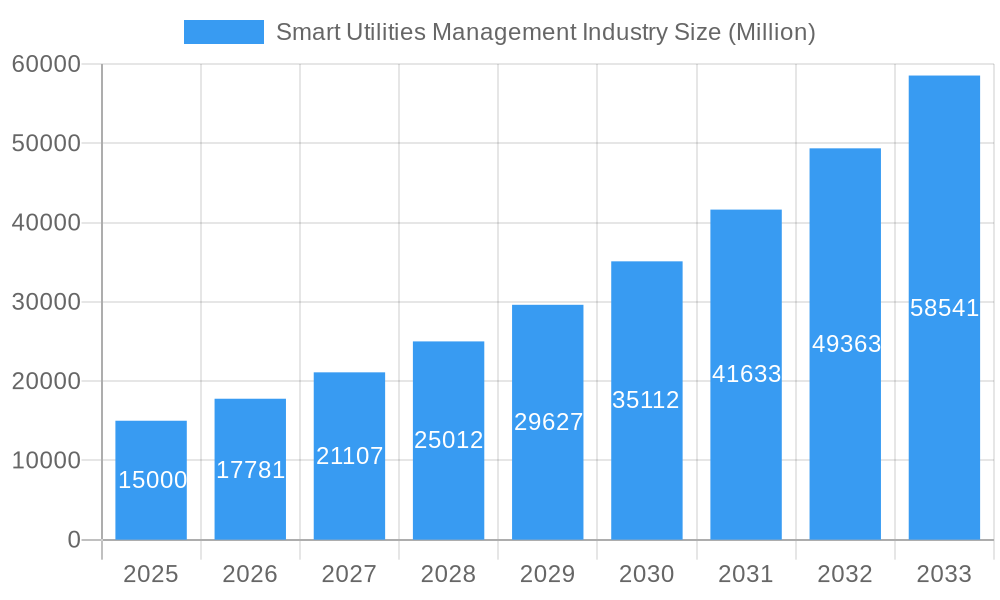
Smart Utilities Management Industry Market Size (In Billion)
The competitive landscape features established technology leaders such as Itron, Honeywell, ABB, IBM, Cisco, Siemens, and Atos, alongside emerging innovators. This dynamic environment fosters innovation and the development of advanced solutions, accelerating market growth. Emerging trends like the integration of Artificial Intelligence (AI) and Machine Learning (ML) for predictive maintenance and optimized energy distribution are set to redefine the market. The ongoing digital transformation within the utility sector presents considerable growth opportunities for vendors across all segments and geographies. Furthermore, the integration of renewable energy sources into smart grids adds further complexity and potential to the market. Projections indicate continued strong growth through 2033, driven by technological advancements and the persistent demand for sustainable and efficient energy infrastructure.
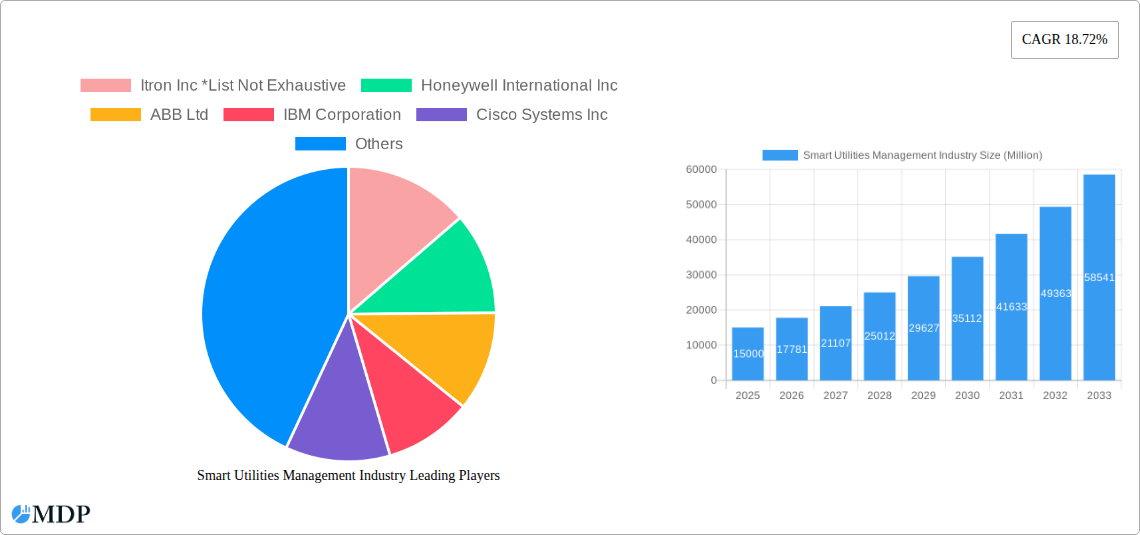
Smart Utilities Management Industry Company Market Share
Smart Utilities Management Industry: A Comprehensive Market Report (2019-2033)
This comprehensive report provides an in-depth analysis of the Smart Utilities Management industry, projecting a market valuation exceeding $XX Million by 2033. It offers crucial insights for investors, industry professionals, and strategic decision-makers seeking a competitive edge in this rapidly evolving sector. The report leverages extensive data from the historical period (2019-2024), the base year (2025), and the forecast period (2025-2033) to deliver actionable intelligence and forecast the future of the smart utilities management market.
Smart Utilities Management Industry Market Dynamics & Concentration
The Smart Utilities Management market exhibits a moderately concentrated landscape, with key players like Itron Inc, Honeywell International Inc, ABB Ltd, IBM Corporation, Cisco Systems Inc, Siemens AG, Atos SE, and Tendrill Inc holding significant market share. The market share distribution in 2025 is estimated as follows: Itron Inc (18%), Honeywell International Inc (15%), ABB Ltd (12%), and others (55%). However, this landscape is dynamic, influenced by continuous innovation, strategic mergers and acquisitions (M&A), and evolving regulatory frameworks.
- Innovation Drivers: The push towards decarbonization, advancements in AI and IoT, and the increasing demand for grid modernization are major drivers of innovation.
- Regulatory Frameworks: Government regulations promoting energy efficiency and renewable energy integration significantly shape market dynamics. Stringent data privacy regulations also influence product development and deployment strategies.
- Product Substitutes: While currently limited, advancements in alternative energy sources and decentralized energy systems could potentially pose long-term competitive challenges.
- End-User Trends: The growing adoption of smart meters, increasing awareness of energy conservation, and the rise of smart homes and cities are key end-user trends driving market growth.
- M&A Activities: The industry has witnessed XX M&A deals in the past five years, with a focus on consolidating market share and expanding technological capabilities. This trend is expected to continue, with an estimated XX deals projected for the forecast period.
Smart Utilities Management Industry Industry Trends & Analysis
The Smart Utilities Management market is experiencing robust growth, with a Compound Annual Growth Rate (CAGR) projected at XX% from 2025 to 2033. This growth is driven by several factors including:
- Technological Disruptions: The widespread adoption of AI, machine learning, and big data analytics is transforming grid management and improving operational efficiency. The market penetration of AI-powered solutions is expected to reach XX% by 2033.
- Consumer Preferences: Increasing consumer awareness of sustainability and energy costs is driving demand for energy-efficient solutions and smart home technologies.
- Competitive Dynamics: Intense competition among established players and the emergence of innovative startups are leading to continuous product development and price optimization. The market is characterized by fierce competition, particularly in the Meter Data Management System segment.
Leading Markets & Segments in Smart Utilities Management Industry
North America currently dominates the Smart Utilities Management market, driven by strong regulatory support, advanced infrastructure, and early adoption of smart technologies. Europe is a significant market, followed by Asia-Pacific, with China experiencing rapid growth.
By Type Segment Dominance:
- Meter Data Management System (MDMS): This segment holds the largest market share due to the widespread deployment of smart meters and the need for efficient data management. Key drivers include:
- Stringent regulatory requirements for advanced metering infrastructure (AMI).
- Growing demand for real-time energy consumption monitoring.
- Increased focus on reducing energy losses and improving grid reliability.
- Energy Monitoring/Management: This segment is growing rapidly, driven by increasing industrial automation and the demand for improved energy efficiency in commercial and industrial settings.
- Smart Distribution Management: This segment is experiencing significant growth driven by the need for grid modernization and the integration of renewable energy sources. Key factors include:
- Increasing grid instability due to intermittent renewable energy sources.
- Need for efficient grid operation and reduced transmission losses.
- Government incentives for grid modernization projects.
Smart Utilities Management Industry Product Developments
Recent product innovations have focused on enhancing data analytics capabilities, integrating renewable energy sources, and improving grid resilience. Advanced MDMS solutions, coupled with AI-powered predictive maintenance tools, are gaining significant traction. The market is witnessing the rise of cloud-based solutions, offering enhanced scalability and cost-effectiveness. These developments are improving the market fit of smart utilities solutions by enhancing efficiency, reliability, and sustainability.
Key Drivers of Smart Utilities Management Industry Growth
The Smart Utilities Management industry's growth is primarily fueled by:
- Technological advancements: IoT, AI, and big data analytics are transforming grid management and enhancing efficiency.
- Government policies and regulations: Incentives promoting renewable energy integration and energy efficiency are driving adoption.
- Economic factors: The need to reduce operational costs and improve grid reliability is compelling utilities to adopt smart technologies. Examples include government subsidies for smart meter installations and tax breaks for energy-efficient upgrades.
Challenges in the Smart Utilities Management Industry Market
The industry faces several challenges:
- High initial investment costs: Implementing smart grid technologies requires substantial upfront investment.
- Cybersecurity concerns: The interconnected nature of smart grids makes them vulnerable to cyberattacks. The average cost of a cybersecurity breach in the utilities sector is estimated at $XX Million.
- Data privacy and regulatory compliance: Stringent data privacy regulations complicate data management and analysis.
Emerging Opportunities in Smart Utilities Management Industry
The long-term growth of the Smart Utilities Management industry is driven by:
- Technological breakthroughs in AI and machine learning, enabling more advanced predictive analytics and optimized grid management.
- Strategic partnerships between utilities, technology providers, and energy companies, fostering innovation and accelerating adoption.
- Market expansion in developing economies, presenting vast untapped potential for smart grid deployment.
Leading Players in the Smart Utilities Management Industry Sector
- Itron Inc
- Honeywell International Inc
- ABB Ltd
- IBM Corporation
- Cisco Systems Inc
- Siemens AG
- Atos SE
- Tendrill Inc
Key Milestones in Smart Utilities Management Industry Industry
- 2020: Significant advancements in AI-powered predictive maintenance solutions.
- 2021: Increased adoption of cloud-based smart grid platforms.
- 2022: Several large-scale smart grid deployments in major cities globally.
- 2023: Launch of advanced smart meter technology with enhanced cybersecurity features.
- 2024: Several strategic partnerships formed between utilities and tech companies for joint innovation.
Strategic Outlook for Smart Utilities Management Market
The Smart Utilities Management market presents significant growth potential driven by continued technological innovation, supportive regulatory environments, and the escalating demand for efficient and sustainable energy solutions. Strategic partnerships and investments in R&D will be key to capturing this market opportunity, positioning forward-thinking companies for substantial returns.
Smart Utilities Management Industry Segmentation
-
1. Type
- 1.1. Meter Data Management System
- 1.2. Energy Monitoring/Management
- 1.3. Smart Distribution Management
Smart Utilities Management Industry Segmentation By Geography
- 1. North America
- 2. Europe
- 3. Asia Pacific
- 4. Latin America
- 5. Middle East
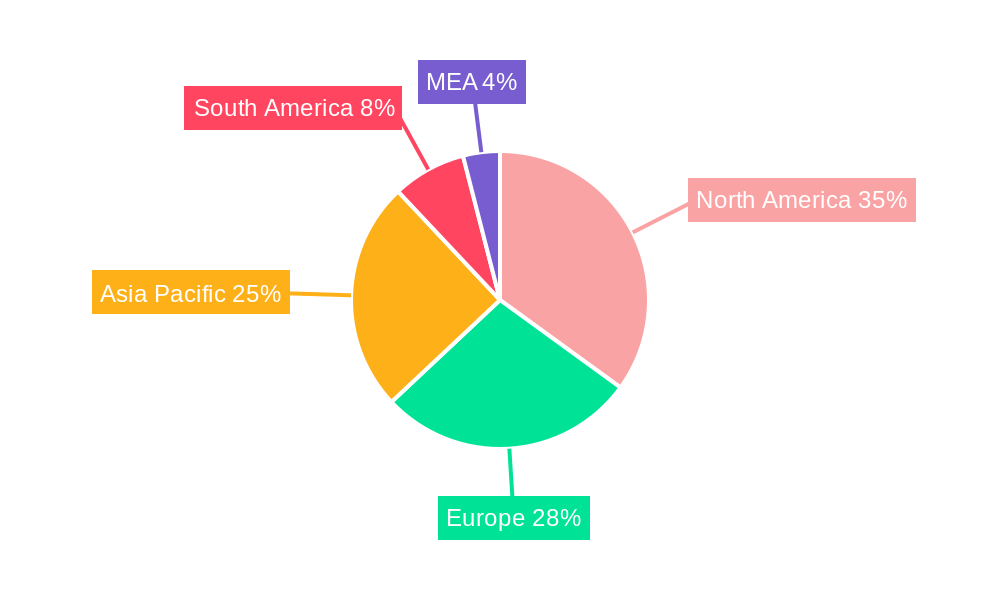
Smart Utilities Management Industry Regional Market Share
Geographic Coverage of Smart Utilities Management Industry
Smart Utilities Management Industry REPORT HIGHLIGHTS
| Aspects | Details |
|---|---|
| Study Period | 2020-2034 |
| Base Year | 2025 |
| Estimated Year | 2026 |
| Forecast Period | 2026-2034 |
| Historical Period | 2020-2025 |
| Growth Rate | CAGR of 12.9% from 2020-2034 |
| Segmentation |
|
Table of Contents
- 1. Introduction
- 1.1. Research Scope
- 1.2. Market Segmentation
- 1.3. Research Methodology
- 1.4. Definitions and Assumptions
- 2. Executive Summary
- 2.1. Introduction
- 3. Market Dynamics
- 3.1. Introduction
- 3.2. Market Drivers
- 3.2.1. ; Rise in Smart City Deployment; Improvements in Energy Efficiency
- 3.3. Market Restrains
- 3.3.1. ; High Cost and Security Concerns and Integration Challenges Associated with Smart Meters
- 3.4. Market Trends
- 3.4.1. Power Sector Hits Growth with Meter Data Management System
- 4. Market Factor Analysis
- 4.1. Porters Five Forces
- 4.2. Supply/Value Chain
- 4.3. PESTEL analysis
- 4.4. Market Entropy
- 4.5. Patent/Trademark Analysis
- 5. Global Smart Utilities Management Industry Analysis, Insights and Forecast, 2020-2032
- 5.1. Market Analysis, Insights and Forecast - by Type
- 5.1.1. Meter Data Management System
- 5.1.2. Energy Monitoring/Management
- 5.1.3. Smart Distribution Management
- 5.2. Market Analysis, Insights and Forecast - by Region
- 5.2.1. North America
- 5.2.2. Europe
- 5.2.3. Asia Pacific
- 5.2.4. Latin America
- 5.2.5. Middle East
- 5.1. Market Analysis, Insights and Forecast - by Type
- 6. North America Smart Utilities Management Industry Analysis, Insights and Forecast, 2020-2032
- 6.1. Market Analysis, Insights and Forecast - by Type
- 6.1.1. Meter Data Management System
- 6.1.2. Energy Monitoring/Management
- 6.1.3. Smart Distribution Management
- 6.1. Market Analysis, Insights and Forecast - by Type
- 7. Europe Smart Utilities Management Industry Analysis, Insights and Forecast, 2020-2032
- 7.1. Market Analysis, Insights and Forecast - by Type
- 7.1.1. Meter Data Management System
- 7.1.2. Energy Monitoring/Management
- 7.1.3. Smart Distribution Management
- 7.1. Market Analysis, Insights and Forecast - by Type
- 8. Asia Pacific Smart Utilities Management Industry Analysis, Insights and Forecast, 2020-2032
- 8.1. Market Analysis, Insights and Forecast - by Type
- 8.1.1. Meter Data Management System
- 8.1.2. Energy Monitoring/Management
- 8.1.3. Smart Distribution Management
- 8.1. Market Analysis, Insights and Forecast - by Type
- 9. Latin America Smart Utilities Management Industry Analysis, Insights and Forecast, 2020-2032
- 9.1. Market Analysis, Insights and Forecast - by Type
- 9.1.1. Meter Data Management System
- 9.1.2. Energy Monitoring/Management
- 9.1.3. Smart Distribution Management
- 9.1. Market Analysis, Insights and Forecast - by Type
- 10. Middle East Smart Utilities Management Industry Analysis, Insights and Forecast, 2020-2032
- 10.1. Market Analysis, Insights and Forecast - by Type
- 10.1.1. Meter Data Management System
- 10.1.2. Energy Monitoring/Management
- 10.1.3. Smart Distribution Management
- 10.1. Market Analysis, Insights and Forecast - by Type
- 11. Competitive Analysis
- 11.1. Global Market Share Analysis 2025
- 11.2. Company Profiles
- 11.2.1 Itron Inc *List Not Exhaustive
- 11.2.1.1. Overview
- 11.2.1.2. Products
- 11.2.1.3. SWOT Analysis
- 11.2.1.4. Recent Developments
- 11.2.1.5. Financials (Based on Availability)
- 11.2.2 Honeywell International Inc
- 11.2.2.1. Overview
- 11.2.2.2. Products
- 11.2.2.3. SWOT Analysis
- 11.2.2.4. Recent Developments
- 11.2.2.5. Financials (Based on Availability)
- 11.2.3 ABB Ltd
- 11.2.3.1. Overview
- 11.2.3.2. Products
- 11.2.3.3. SWOT Analysis
- 11.2.3.4. Recent Developments
- 11.2.3.5. Financials (Based on Availability)
- 11.2.4 IBM Corporation
- 11.2.4.1. Overview
- 11.2.4.2. Products
- 11.2.4.3. SWOT Analysis
- 11.2.4.4. Recent Developments
- 11.2.4.5. Financials (Based on Availability)
- 11.2.5 Cisco Systems Inc
- 11.2.5.1. Overview
- 11.2.5.2. Products
- 11.2.5.3. SWOT Analysis
- 11.2.5.4. Recent Developments
- 11.2.5.5. Financials (Based on Availability)
- 11.2.6 Siemens AG
- 11.2.6.1. Overview
- 11.2.6.2. Products
- 11.2.6.3. SWOT Analysis
- 11.2.6.4. Recent Developments
- 11.2.6.5. Financials (Based on Availability)
- 11.2.7 Atos SE
- 11.2.7.1. Overview
- 11.2.7.2. Products
- 11.2.7.3. SWOT Analysis
- 11.2.7.4. Recent Developments
- 11.2.7.5. Financials (Based on Availability)
- 11.2.8 Tendrill Inc
- 11.2.8.1. Overview
- 11.2.8.2. Products
- 11.2.8.3. SWOT Analysis
- 11.2.8.4. Recent Developments
- 11.2.8.5. Financials (Based on Availability)
- 11.2.1 Itron Inc *List Not Exhaustive
List of Figures
- Figure 1: Global Smart Utilities Management Industry Revenue Breakdown (billion, %) by Region 2025 & 2033
- Figure 2: North America Smart Utilities Management Industry Revenue (billion), by Type 2025 & 2033
- Figure 3: North America Smart Utilities Management Industry Revenue Share (%), by Type 2025 & 2033
- Figure 4: North America Smart Utilities Management Industry Revenue (billion), by Country 2025 & 2033
- Figure 5: North America Smart Utilities Management Industry Revenue Share (%), by Country 2025 & 2033
- Figure 6: Europe Smart Utilities Management Industry Revenue (billion), by Type 2025 & 2033
- Figure 7: Europe Smart Utilities Management Industry Revenue Share (%), by Type 2025 & 2033
- Figure 8: Europe Smart Utilities Management Industry Revenue (billion), by Country 2025 & 2033
- Figure 9: Europe Smart Utilities Management Industry Revenue Share (%), by Country 2025 & 2033
- Figure 10: Asia Pacific Smart Utilities Management Industry Revenue (billion), by Type 2025 & 2033
- Figure 11: Asia Pacific Smart Utilities Management Industry Revenue Share (%), by Type 2025 & 2033
- Figure 12: Asia Pacific Smart Utilities Management Industry Revenue (billion), by Country 2025 & 2033
- Figure 13: Asia Pacific Smart Utilities Management Industry Revenue Share (%), by Country 2025 & 2033
- Figure 14: Latin America Smart Utilities Management Industry Revenue (billion), by Type 2025 & 2033
- Figure 15: Latin America Smart Utilities Management Industry Revenue Share (%), by Type 2025 & 2033
- Figure 16: Latin America Smart Utilities Management Industry Revenue (billion), by Country 2025 & 2033
- Figure 17: Latin America Smart Utilities Management Industry Revenue Share (%), by Country 2025 & 2033
- Figure 18: Middle East Smart Utilities Management Industry Revenue (billion), by Type 2025 & 2033
- Figure 19: Middle East Smart Utilities Management Industry Revenue Share (%), by Type 2025 & 2033
- Figure 20: Middle East Smart Utilities Management Industry Revenue (billion), by Country 2025 & 2033
- Figure 21: Middle East Smart Utilities Management Industry Revenue Share (%), by Country 2025 & 2033
List of Tables
- Table 1: Global Smart Utilities Management Industry Revenue billion Forecast, by Type 2020 & 2033
- Table 2: Global Smart Utilities Management Industry Revenue billion Forecast, by Region 2020 & 2033
- Table 3: Global Smart Utilities Management Industry Revenue billion Forecast, by Type 2020 & 2033
- Table 4: Global Smart Utilities Management Industry Revenue billion Forecast, by Country 2020 & 2033
- Table 5: Global Smart Utilities Management Industry Revenue billion Forecast, by Type 2020 & 2033
- Table 6: Global Smart Utilities Management Industry Revenue billion Forecast, by Country 2020 & 2033
- Table 7: Global Smart Utilities Management Industry Revenue billion Forecast, by Type 2020 & 2033
- Table 8: Global Smart Utilities Management Industry Revenue billion Forecast, by Country 2020 & 2033
- Table 9: Global Smart Utilities Management Industry Revenue billion Forecast, by Type 2020 & 2033
- Table 10: Global Smart Utilities Management Industry Revenue billion Forecast, by Country 2020 & 2033
- Table 11: Global Smart Utilities Management Industry Revenue billion Forecast, by Type 2020 & 2033
- Table 12: Global Smart Utilities Management Industry Revenue billion Forecast, by Country 2020 & 2033
Frequently Asked Questions
1. What is the projected Compound Annual Growth Rate (CAGR) of the Smart Utilities Management Industry?
The projected CAGR is approximately 12.9%.
2. Which companies are prominent players in the Smart Utilities Management Industry?
Key companies in the market include Itron Inc *List Not Exhaustive, Honeywell International Inc, ABB Ltd, IBM Corporation, Cisco Systems Inc, Siemens AG, Atos SE, Tendrill Inc.
3. What are the main segments of the Smart Utilities Management Industry?
The market segments include Type.
4. Can you provide details about the market size?
The market size is estimated to be USD 56.48 billion as of 2022.
5. What are some drivers contributing to market growth?
; Rise in Smart City Deployment; Improvements in Energy Efficiency.
6. What are the notable trends driving market growth?
Power Sector Hits Growth with Meter Data Management System.
7. Are there any restraints impacting market growth?
; High Cost and Security Concerns and Integration Challenges Associated with Smart Meters.
8. Can you provide examples of recent developments in the market?
N/A
9. What pricing options are available for accessing the report?
Pricing options include single-user, multi-user, and enterprise licenses priced at USD 4750, USD 5250, and USD 8750 respectively.
10. Is the market size provided in terms of value or volume?
The market size is provided in terms of value, measured in billion.
11. Are there any specific market keywords associated with the report?
Yes, the market keyword associated with the report is "Smart Utilities Management Industry," which aids in identifying and referencing the specific market segment covered.
12. How do I determine which pricing option suits my needs best?
The pricing options vary based on user requirements and access needs. Individual users may opt for single-user licenses, while businesses requiring broader access may choose multi-user or enterprise licenses for cost-effective access to the report.
13. Are there any additional resources or data provided in the Smart Utilities Management Industry report?
While the report offers comprehensive insights, it's advisable to review the specific contents or supplementary materials provided to ascertain if additional resources or data are available.
14. How can I stay updated on further developments or reports in the Smart Utilities Management Industry?
To stay informed about further developments, trends, and reports in the Smart Utilities Management Industry, consider subscribing to industry newsletters, following relevant companies and organizations, or regularly checking reputable industry news sources and publications.
Methodology
Step 1 - Identification of Relevant Samples Size from Population Database


Step 2 - Approaches for Defining Global Market Size (Value, Volume* & Price*)

Note*: In applicable scenarios
Step 3 - Data Sources
Primary Research
- Web Analytics
- Survey Reports
- Research Institute
- Latest Research Reports
- Opinion Leaders
Secondary Research
- Annual Reports
- White Paper
- Latest Press Release
- Industry Association
- Paid Database
- Investor Presentations

Step 4 - Data Triangulation
Involves using different sources of information in order to increase the validity of a study
These sources are likely to be stakeholders in a program - participants, other researchers, program staff, other community members, and so on.
Then we put all data in single framework & apply various statistical tools to find out the dynamic on the market.
During the analysis stage, feedback from the stakeholder groups would be compared to determine areas of agreement as well as areas of divergence