

Key Insights
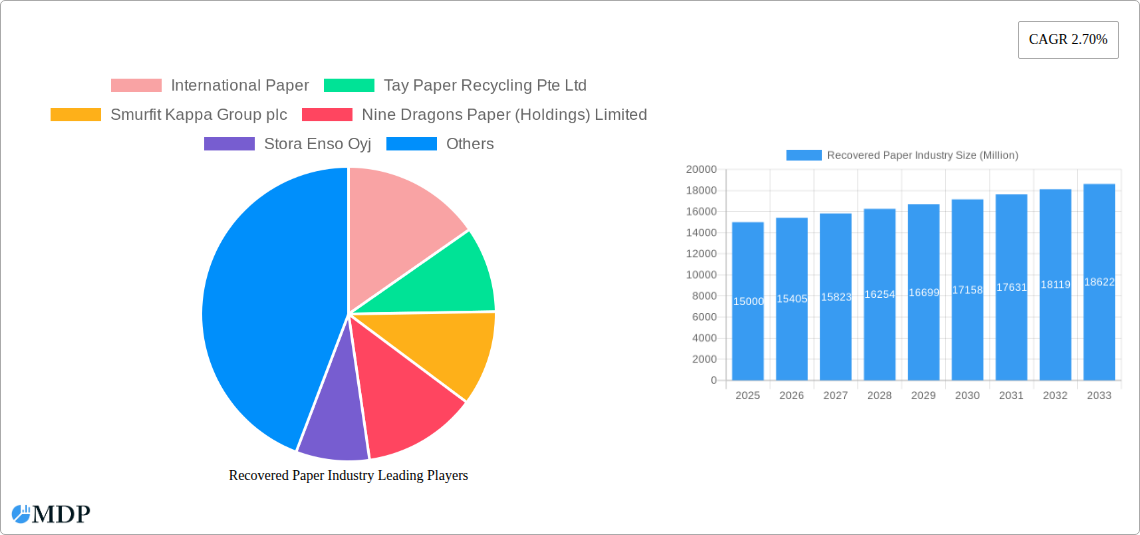
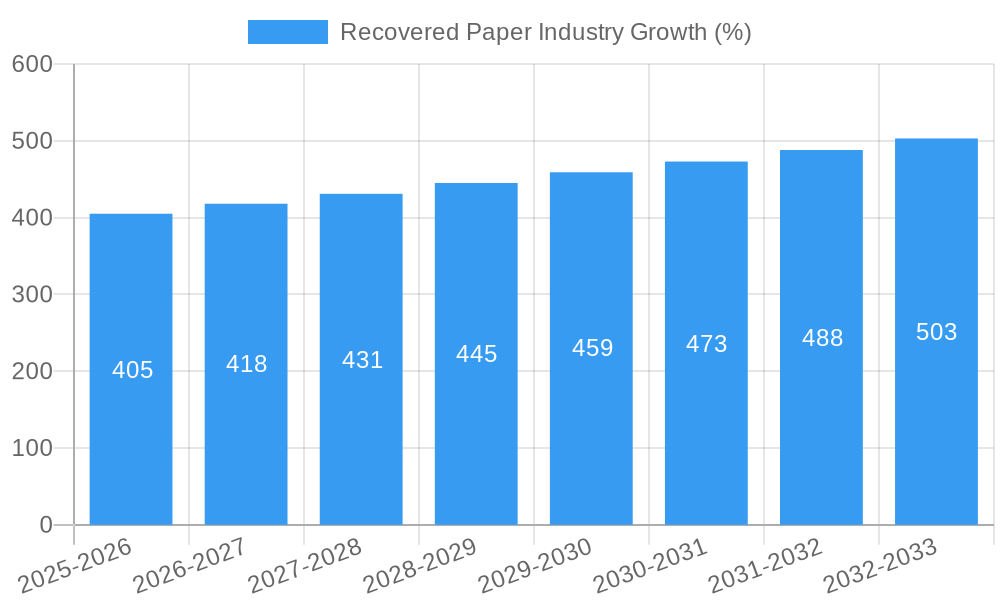
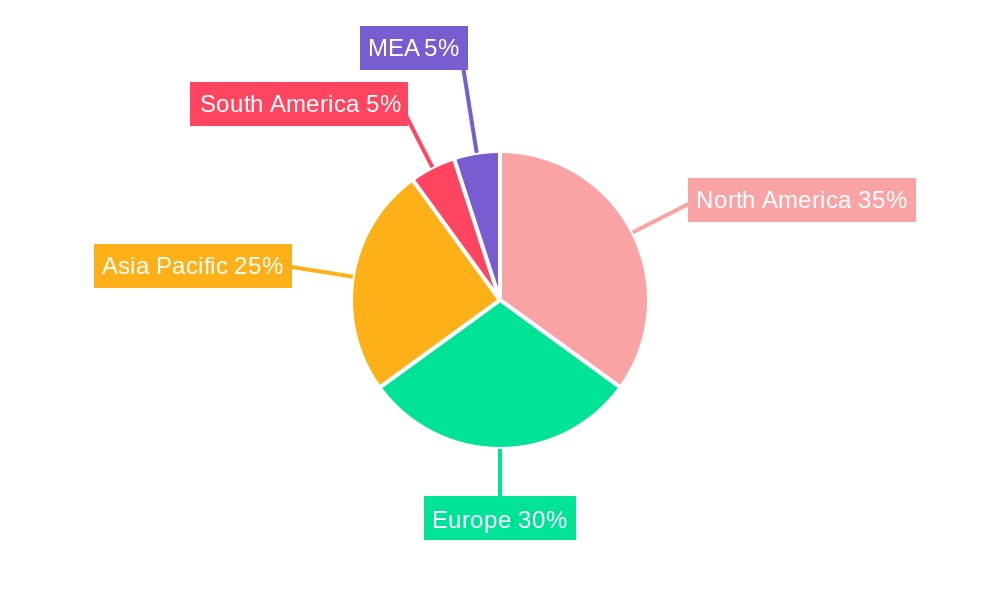
The recovered paper industry, exhibiting a Compound Annual Growth Rate (CAGR) of 2.70%, presents a significant market opportunity. Driven by increasing environmental awareness and stringent regulations promoting recycling, the industry is experiencing robust growth. Key drivers include the rising demand for recycled paper products across various segments, including printing and writing paper, newsprint, tissue, and containerboard. The shift towards sustainable packaging solutions and the growing popularity of e-commerce, leading to higher volumes of cardboard packaging waste, further fuel market expansion. Technological advancements in paper recycling processes, improving efficiency and reducing costs, are also contributing factors. However, fluctuations in raw material prices and the availability of recyclable materials represent potential restraints. Geographic distribution reveals strong market presence in North America, Europe, and Asia-Pacific, with China and the United States being major players due to their significant populations and manufacturing bases. Regional variations in recycling infrastructure and governmental policies influence market growth within each region. The market segmentation by type highlights the dominance of containerboard and printing and writing paper, reflecting their widespread applications in packaging and office supplies, respectively. Competition among major players, including International Paper, Smurfit Kappa Group, and Nine Dragons Paper, is intense, emphasizing the need for innovation and efficient operations. Future growth will likely be driven by continuous improvement in recycling technologies, supportive government policies, and increased consumer preference for eco-friendly products.
The forecast period of 2025-2033 anticipates sustained growth, with the market likely exceeding its 2025 value substantially. This growth will be influenced by the ongoing expansion of the global economy and a projected increase in paper consumption, necessitating greater reliance on recycled materials. However, maintaining this growth requires addressing challenges such as inconsistent waste collection systems in some regions and the need for further investment in advanced recycling technologies to handle complex paper streams effectively. The industry's sustainability focus, coupled with economic incentives and evolving consumer behavior, positions it for long-term growth, though careful management of raw material supply and cost pressures will remain critical. Successful players will need to demonstrate commitment to environmental responsibility, operational efficiency, and innovative product development.
Recovered Paper Industry Market Report: 2019-2033 Forecast
This comprehensive report provides a detailed analysis of the Recovered Paper Industry, offering invaluable insights for industry stakeholders, investors, and strategic decision-makers. Covering the period 2019-2033, with a focus on 2025, this report unveils the market dynamics, key trends, leading players, and future opportunities within this crucial sector. The report leverages extensive market research and data analysis to provide actionable intelligence, helping businesses navigate the complexities of the recovered paper market and capitalize on emerging growth avenues. The global market size is estimated at $XX Million in 2025 and is projected to reach $XX Million by 2033.
Recovered Paper Industry Market Dynamics & Concentration
The Recovered Paper Industry exhibits a moderately concentrated market structure, with a handful of major players holding significant market share. International Paper, Smurfit Kappa Group plc, and Nine Dragons Paper (Holdings) Limited are among the leading companies, commanding a combined market share estimated at XX% in 2025. Market concentration is influenced by factors such as economies of scale, technological advancements, and access to raw materials.
Innovation Drivers: Technological advancements in paper recycling processes, such as improved sorting and pulping techniques, are driving efficiency and reducing costs. The development of new paper grades from recycled materials also presents significant opportunities.
Regulatory Frameworks: Government regulations promoting recycling and sustainable forestry practices significantly impact the industry. Incentives and mandates for recycled content in packaging and printing materials drive demand for recovered paper. Stringent environmental regulations also shape operational practices and waste management strategies.
Product Substitutes: While alternative packaging materials exist (e.g., plastics), the environmental consciousness of consumers and businesses continues to fuel the demand for recycled paper products. Furthermore, advancements in technology are increasing the quality and versatility of recycled paper, making it a competitive alternative.
End-User Trends: Growing environmental awareness and corporate sustainability initiatives are driving demand for recycled paper across various end-use segments, including packaging, printing, and tissue. Increased emphasis on circular economy models further strengthens the market outlook.
M&A Activities: The industry has witnessed a significant number of mergers and acquisitions (M&A) in recent years (XX deals in 2019-2024). These activities are primarily driven by companies seeking to expand their market reach, consolidate operations, and access new technologies. Larger players are strategically acquiring smaller companies to secure access to raw materials and enhance their market position.
Recovered Paper Industry Industry Trends & Analysis
The Recovered Paper Industry is experiencing robust growth, driven by several key factors. The global market is projected to exhibit a Compound Annual Growth Rate (CAGR) of XX% during the forecast period (2025-2033). This growth is fueled by increasing awareness of environmental sustainability and the growing adoption of recycled content in various applications. Market penetration of recycled paper in specific segments, such as packaging, is steadily increasing, contributing to market expansion.
Technological advancements, particularly in automated sorting and pulping technologies, are improving the efficiency and cost-effectiveness of recycling processes. This is reflected in the increasing capacity utilization and improved quality of recycled paper products.
Consumer preferences are shifting towards eco-friendly products, driving demand for recycled paper. This trend is particularly evident in packaging where recycled content is becoming a key selling point. Furthermore, growing regulations promoting sustainable packaging are accelerating this shift. The competitive landscape is evolving with industry consolidation through mergers and acquisitions and the emergence of innovative players offering advanced recycling solutions.
Leading Markets & Segments in Recovered Paper Industry
The Containerboard segment dominates the recovered paper market, accounting for the largest share (XX%) in 2025 due to its extensive usage in packaging and high demand for recyclable materials. North America and Europe are the leading regions in terms of recovered paper consumption, driven by robust recycling infrastructure and stringent environmental regulations. Asia-Pacific is also showing significant growth potential, fueled by rapid economic development and rising demand for packaging.
Key Drivers for Containerboard Dominance:
- High Demand for Packaging: The e-commerce boom and increased consumer goods consumption are driving demand for packaging materials, pushing containerboard to the forefront.
- Recyclability: Containerboard's inherent recyclability aligns perfectly with growing environmental awareness.
- Cost-Effectiveness: Compared to virgin fiber, using recycled containerboard offers economic benefits to manufacturers.
Key Drivers for North America and Europe Dominance:
- Mature Recycling Infrastructure: Well-established collection and processing systems support efficient recovery.
- Stringent Environmental Regulations: Government policies mandate recycled content in packaging and other applications.
- Strong Consumer Awareness: High levels of environmental consciousness drive consumer demand for recycled products.
Recovered Paper Industry Product Developments
Recent product innovations have focused on enhancing the quality and versatility of recycled paper. Developments in de-inking technologies have improved the brightness and printability of recycled paper, making it suitable for a wider range of applications. New grades of recycled paper, tailored to specific end-use requirements, are emerging in response to evolving market demands. This contributes to the growing competitiveness of recycled paper in comparison to virgin fiber products.
Key Drivers of Recovered Paper Industry Growth
Several factors are driving growth in the recovered paper industry. Technological advancements in recycling technology are leading to higher efficiency and lower costs. Government policies and regulations mandating the use of recycled content in products are creating a surge in demand. Rising consumer awareness of environmental issues and the growing adoption of sustainable practices by businesses are further propelling market growth. The increasing use of recycled paper in various applications, particularly packaging, contributes to this growth.
Challenges in the Recovered Paper Industry Market
The recovered paper industry faces several challenges, including fluctuating raw material prices and transportation costs influencing profitability. Competition from alternative packaging materials, such as plastics, also poses a threat. Furthermore, the inconsistency in the quality of recovered paper due to variations in collection and sorting processes can impact production efficiency. Lastly, ensuring compliance with evolving environmental regulations presents an ongoing challenge.
Emerging Opportunities in Recovered Paper Industry
The industry is poised for long-term growth, driven by several emerging opportunities. The development of innovative recycling technologies, such as advanced sorting systems and enzymatic de-inking, will further enhance efficiency and reduce environmental impact. Strategic partnerships between paper producers and waste management companies are creating integrated value chains. Expansion into new and growing markets, particularly in developing economies, is also presenting significant opportunities.
Leading Players in the Recovered Paper Industry Sector
- International Paper
- Tay Paper Recycling Pte Ltd
- Smurfit Kappa Group plc
- Nine Dragons Paper (Holdings) Limited
- Stora Enso Oyj
- S A Industrias Celulosa Aragonesa (SAICA)
- Visy Industrie
- DS Smith Plc
Key Milestones in Recovered Paper Industry Industry
- 2020: Introduction of a new high-quality recycled paper grade by International Paper.
- 2021: Acquisition of a leading recycled paper mill by Smurfit Kappa Group plc.
- 2022: Implementation of stricter environmental regulations in the European Union impacting recycled paper production.
- 2023: Launch of a new automated sorting technology by a leading waste management company.
- 2024: Partnership between Nine Dragons Paper and a technology firm to develop advanced de-inking techniques.
Strategic Outlook for Recovered Paper Industry Market
The Recovered Paper Industry is expected to witness sustained growth driven by a multitude of factors, including increasing consumer preference for sustainable products and strict regulations promoting recycling. Further technological advancements in recycling processes coupled with strategic collaborations among industry players will unlock greater efficiency and market expansion. The future of the recovered paper industry looks bright, with considerable opportunities for growth and innovation.
Recovered Paper Industry Segmentation
-
1. Type
- 1.1. Printing and Writing Paper
- 1.2. Newsprint
- 1.3. Tissue
- 1.4. Containerboard
- 1.5. Other Types
Recovered Paper Industry Segmentation By Geography
- 1. North America
- 2. Europe
- 3. Asia Pacific
- 4. Latin America
- 5. Middle East and Africa
Recovered Paper Industry REPORT HIGHLIGHTS
| Aspects | Details |
|---|---|
| Study Period | 2019-2033 |
| Base Year | 2024 |
| Estimated Year | 2025 |
| Forecast Period | 2025-2033 |
| Historical Period | 2019-2024 |
| Growth Rate | CAGR of 2.70% from 2019-2033 |
| Segmentation |
|
Table of Contents
- 1. Introduction
- 1.1. Research Scope
- 1.2. Market Segmentation
- 1.3. Research Methodology
- 1.4. Definitions and Assumptions
- 2. Executive Summary
- 2.1. Introduction
- 3. Market Dynamics
- 3.1. Introduction
- 3.2. Market Drivers
- 3.2.1. Growth in E-commerce Sales in China; Rising Demand from the Food-service Sector; Growing Consumer Awareness on Paper Packaging; Recycling Initiatives Involving Closed-loop Systems to Aid Market Adoption of Paper Packaging-based Materials
- 3.3. Market Restrains
- 3.3.1 Recycling
- 3.3.2 Raw Material Supply Chain Management
- 3.3.3 and Challenges in the Paper Packaging Industry; Effects of Deforestation on Paper Packaging; Increasing Raw Material Costs and Outsourcing
- 3.4. Market Trends
- 3.4.1. Containerboard to Dominate the Market
- 4. Market Factor Analysis
- 4.1. Porters Five Forces
- 4.2. Supply/Value Chain
- 4.3. PESTEL analysis
- 4.4. Market Entropy
- 4.5. Patent/Trademark Analysis
- 5. Global Recovered Paper Industry Analysis, Insights and Forecast, 2019-2031
- 5.1. Market Analysis, Insights and Forecast - by Type
- 5.1.1. Printing and Writing Paper
- 5.1.2. Newsprint
- 5.1.3. Tissue
- 5.1.4. Containerboard
- 5.1.5. Other Types
- 5.2. Market Analysis, Insights and Forecast - by Region
- 5.2.1. North America
- 5.2.2. Europe
- 5.2.3. Asia Pacific
- 5.2.4. Latin America
- 5.2.5. Middle East and Africa
- 5.1. Market Analysis, Insights and Forecast - by Type
- 6. North America Recovered Paper Industry Analysis, Insights and Forecast, 2019-2031
- 6.1. Market Analysis, Insights and Forecast - by Type
- 6.1.1. Printing and Writing Paper
- 6.1.2. Newsprint
- 6.1.3. Tissue
- 6.1.4. Containerboard
- 6.1.5. Other Types
- 6.1. Market Analysis, Insights and Forecast - by Type
- 7. Europe Recovered Paper Industry Analysis, Insights and Forecast, 2019-2031
- 7.1. Market Analysis, Insights and Forecast - by Type
- 7.1.1. Printing and Writing Paper
- 7.1.2. Newsprint
- 7.1.3. Tissue
- 7.1.4. Containerboard
- 7.1.5. Other Types
- 7.1. Market Analysis, Insights and Forecast - by Type
- 8. Asia Pacific Recovered Paper Industry Analysis, Insights and Forecast, 2019-2031
- 8.1. Market Analysis, Insights and Forecast - by Type
- 8.1.1. Printing and Writing Paper
- 8.1.2. Newsprint
- 8.1.3. Tissue
- 8.1.4. Containerboard
- 8.1.5. Other Types
- 8.1. Market Analysis, Insights and Forecast - by Type
- 9. Latin America Recovered Paper Industry Analysis, Insights and Forecast, 2019-2031
- 9.1. Market Analysis, Insights and Forecast - by Type
- 9.1.1. Printing and Writing Paper
- 9.1.2. Newsprint
- 9.1.3. Tissue
- 9.1.4. Containerboard
- 9.1.5. Other Types
- 9.1. Market Analysis, Insights and Forecast - by Type
- 10. Middle East and Africa Recovered Paper Industry Analysis, Insights and Forecast, 2019-2031
- 10.1. Market Analysis, Insights and Forecast - by Type
- 10.1.1. Printing and Writing Paper
- 10.1.2. Newsprint
- 10.1.3. Tissue
- 10.1.4. Containerboard
- 10.1.5. Other Types
- 10.1. Market Analysis, Insights and Forecast - by Type
- 11. North America Recovered Paper Industry Analysis, Insights and Forecast, 2019-2031
- 11.1. Market Analysis, Insights and Forecast - By Country/Sub-region
- 11.1.1 United States
- 11.1.2 Canada
- 11.1.3 Mexico
- 12. Europe Recovered Paper Industry Analysis, Insights and Forecast, 2019-2031
- 12.1. Market Analysis, Insights and Forecast - By Country/Sub-region
- 12.1.1 Germany
- 12.1.2 United Kingdom
- 12.1.3 France
- 12.1.4 Spain
- 12.1.5 Italy
- 12.1.6 Spain
- 12.1.7 Belgium
- 12.1.8 Netherland
- 12.1.9 Nordics
- 12.1.10 Rest of Europe
- 13. Asia Pacific Recovered Paper Industry Analysis, Insights and Forecast, 2019-2031
- 13.1. Market Analysis, Insights and Forecast - By Country/Sub-region
- 13.1.1 China
- 13.1.2 Japan
- 13.1.3 India
- 13.1.4 South Korea
- 13.1.5 Southeast Asia
- 13.1.6 Australia
- 13.1.7 Indonesia
- 13.1.8 Phillipes
- 13.1.9 Singapore
- 13.1.10 Thailandc
- 13.1.11 Rest of Asia Pacific
- 14. South America Recovered Paper Industry Analysis, Insights and Forecast, 2019-2031
- 14.1. Market Analysis, Insights and Forecast - By Country/Sub-region
- 14.1.1 Brazil
- 14.1.2 Argentina
- 14.1.3 Peru
- 14.1.4 Chile
- 14.1.5 Colombia
- 14.1.6 Ecuador
- 14.1.7 Venezuela
- 14.1.8 Rest of South America
- 15. North America Recovered Paper Industry Analysis, Insights and Forecast, 2019-2031
- 15.1. Market Analysis, Insights and Forecast - By Country/Sub-region
- 15.1.1 United States
- 15.1.2 Canada
- 15.1.3 Mexico
- 16. MEA Recovered Paper Industry Analysis, Insights and Forecast, 2019-2031
- 16.1. Market Analysis, Insights and Forecast - By Country/Sub-region
- 16.1.1 United Arab Emirates
- 16.1.2 Saudi Arabia
- 16.1.3 South Africa
- 16.1.4 Rest of Middle East and Africa
- 17. Competitive Analysis
- 17.1. Global Market Share Analysis 2024
- 17.2. Company Profiles
- 17.2.1 International Paper
- 17.2.1.1. Overview
- 17.2.1.2. Products
- 17.2.1.3. SWOT Analysis
- 17.2.1.4. Recent Developments
- 17.2.1.5. Financials (Based on Availability)
- 17.2.2 Tay Paper Recycling Pte Ltd
- 17.2.2.1. Overview
- 17.2.2.2. Products
- 17.2.2.3. SWOT Analysis
- 17.2.2.4. Recent Developments
- 17.2.2.5. Financials (Based on Availability)
- 17.2.3 Smurfit Kappa Group plc
- 17.2.3.1. Overview
- 17.2.3.2. Products
- 17.2.3.3. SWOT Analysis
- 17.2.3.4. Recent Developments
- 17.2.3.5. Financials (Based on Availability)
- 17.2.4 Nine Dragons Paper (Holdings) Limited
- 17.2.4.1. Overview
- 17.2.4.2. Products
- 17.2.4.3. SWOT Analysis
- 17.2.4.4. Recent Developments
- 17.2.4.5. Financials (Based on Availability)
- 17.2.5 Stora Enso Oyj
- 17.2.5.1. Overview
- 17.2.5.2. Products
- 17.2.5.3. SWOT Analysis
- 17.2.5.4. Recent Developments
- 17.2.5.5. Financials (Based on Availability)
- 17.2.6 S A Industrias Celulosa Aragonesa (SAICA)
- 17.2.6.1. Overview
- 17.2.6.2. Products
- 17.2.6.3. SWOT Analysis
- 17.2.6.4. Recent Developments
- 17.2.6.5. Financials (Based on Availability)
- 17.2.7 Visy Industrie
- 17.2.7.1. Overview
- 17.2.7.2. Products
- 17.2.7.3. SWOT Analysis
- 17.2.7.4. Recent Developments
- 17.2.7.5. Financials (Based on Availability)
- 17.2.8 DS Smith Plc
- 17.2.8.1. Overview
- 17.2.8.2. Products
- 17.2.8.3. SWOT Analysis
- 17.2.8.4. Recent Developments
- 17.2.8.5. Financials (Based on Availability)
- 17.2.1 International Paper
List of Figures
- Figure 1: Global Recovered Paper Industry Revenue Breakdown (Million, %) by Region 2024 & 2032
- Figure 2: North America Recovered Paper Industry Revenue (Million), by Country 2024 & 2032
- Figure 3: North America Recovered Paper Industry Revenue Share (%), by Country 2024 & 2032
- Figure 4: Europe Recovered Paper Industry Revenue (Million), by Country 2024 & 2032
- Figure 5: Europe Recovered Paper Industry Revenue Share (%), by Country 2024 & 2032
- Figure 6: Asia Pacific Recovered Paper Industry Revenue (Million), by Country 2024 & 2032
- Figure 7: Asia Pacific Recovered Paper Industry Revenue Share (%), by Country 2024 & 2032
- Figure 8: South America Recovered Paper Industry Revenue (Million), by Country 2024 & 2032
- Figure 9: South America Recovered Paper Industry Revenue Share (%), by Country 2024 & 2032
- Figure 10: North America Recovered Paper Industry Revenue (Million), by Country 2024 & 2032
- Figure 11: North America Recovered Paper Industry Revenue Share (%), by Country 2024 & 2032
- Figure 12: MEA Recovered Paper Industry Revenue (Million), by Country 2024 & 2032
- Figure 13: MEA Recovered Paper Industry Revenue Share (%), by Country 2024 & 2032
- Figure 14: North America Recovered Paper Industry Revenue (Million), by Type 2024 & 2032
- Figure 15: North America Recovered Paper Industry Revenue Share (%), by Type 2024 & 2032
- Figure 16: North America Recovered Paper Industry Revenue (Million), by Country 2024 & 2032
- Figure 17: North America Recovered Paper Industry Revenue Share (%), by Country 2024 & 2032
- Figure 18: Europe Recovered Paper Industry Revenue (Million), by Type 2024 & 2032
- Figure 19: Europe Recovered Paper Industry Revenue Share (%), by Type 2024 & 2032
- Figure 20: Europe Recovered Paper Industry Revenue (Million), by Country 2024 & 2032
- Figure 21: Europe Recovered Paper Industry Revenue Share (%), by Country 2024 & 2032
- Figure 22: Asia Pacific Recovered Paper Industry Revenue (Million), by Type 2024 & 2032
- Figure 23: Asia Pacific Recovered Paper Industry Revenue Share (%), by Type 2024 & 2032
- Figure 24: Asia Pacific Recovered Paper Industry Revenue (Million), by Country 2024 & 2032
- Figure 25: Asia Pacific Recovered Paper Industry Revenue Share (%), by Country 2024 & 2032
- Figure 26: Latin America Recovered Paper Industry Revenue (Million), by Type 2024 & 2032
- Figure 27: Latin America Recovered Paper Industry Revenue Share (%), by Type 2024 & 2032
- Figure 28: Latin America Recovered Paper Industry Revenue (Million), by Country 2024 & 2032
- Figure 29: Latin America Recovered Paper Industry Revenue Share (%), by Country 2024 & 2032
- Figure 30: Middle East and Africa Recovered Paper Industry Revenue (Million), by Type 2024 & 2032
- Figure 31: Middle East and Africa Recovered Paper Industry Revenue Share (%), by Type 2024 & 2032
- Figure 32: Middle East and Africa Recovered Paper Industry Revenue (Million), by Country 2024 & 2032
- Figure 33: Middle East and Africa Recovered Paper Industry Revenue Share (%), by Country 2024 & 2032
List of Tables
- Table 1: Global Recovered Paper Industry Revenue Million Forecast, by Region 2019 & 2032
- Table 2: Global Recovered Paper Industry Revenue Million Forecast, by Type 2019 & 2032
- Table 3: Global Recovered Paper Industry Revenue Million Forecast, by Region 2019 & 2032
- Table 4: Global Recovered Paper Industry Revenue Million Forecast, by Country 2019 & 2032
- Table 5: United States Recovered Paper Industry Revenue (Million) Forecast, by Application 2019 & 2032
- Table 6: Canada Recovered Paper Industry Revenue (Million) Forecast, by Application 2019 & 2032
- Table 7: Mexico Recovered Paper Industry Revenue (Million) Forecast, by Application 2019 & 2032
- Table 8: Global Recovered Paper Industry Revenue Million Forecast, by Country 2019 & 2032
- Table 9: Germany Recovered Paper Industry Revenue (Million) Forecast, by Application 2019 & 2032
- Table 10: United Kingdom Recovered Paper Industry Revenue (Million) Forecast, by Application 2019 & 2032
- Table 11: France Recovered Paper Industry Revenue (Million) Forecast, by Application 2019 & 2032
- Table 12: Spain Recovered Paper Industry Revenue (Million) Forecast, by Application 2019 & 2032
- Table 13: Italy Recovered Paper Industry Revenue (Million) Forecast, by Application 2019 & 2032
- Table 14: Spain Recovered Paper Industry Revenue (Million) Forecast, by Application 2019 & 2032
- Table 15: Belgium Recovered Paper Industry Revenue (Million) Forecast, by Application 2019 & 2032
- Table 16: Netherland Recovered Paper Industry Revenue (Million) Forecast, by Application 2019 & 2032
- Table 17: Nordics Recovered Paper Industry Revenue (Million) Forecast, by Application 2019 & 2032
- Table 18: Rest of Europe Recovered Paper Industry Revenue (Million) Forecast, by Application 2019 & 2032
- Table 19: Global Recovered Paper Industry Revenue Million Forecast, by Country 2019 & 2032
- Table 20: China Recovered Paper Industry Revenue (Million) Forecast, by Application 2019 & 2032
- Table 21: Japan Recovered Paper Industry Revenue (Million) Forecast, by Application 2019 & 2032
- Table 22: India Recovered Paper Industry Revenue (Million) Forecast, by Application 2019 & 2032
- Table 23: South Korea Recovered Paper Industry Revenue (Million) Forecast, by Application 2019 & 2032
- Table 24: Southeast Asia Recovered Paper Industry Revenue (Million) Forecast, by Application 2019 & 2032
- Table 25: Australia Recovered Paper Industry Revenue (Million) Forecast, by Application 2019 & 2032
- Table 26: Indonesia Recovered Paper Industry Revenue (Million) Forecast, by Application 2019 & 2032
- Table 27: Phillipes Recovered Paper Industry Revenue (Million) Forecast, by Application 2019 & 2032
- Table 28: Singapore Recovered Paper Industry Revenue (Million) Forecast, by Application 2019 & 2032
- Table 29: Thailandc Recovered Paper Industry Revenue (Million) Forecast, by Application 2019 & 2032
- Table 30: Rest of Asia Pacific Recovered Paper Industry Revenue (Million) Forecast, by Application 2019 & 2032
- Table 31: Global Recovered Paper Industry Revenue Million Forecast, by Country 2019 & 2032
- Table 32: Brazil Recovered Paper Industry Revenue (Million) Forecast, by Application 2019 & 2032
- Table 33: Argentina Recovered Paper Industry Revenue (Million) Forecast, by Application 2019 & 2032
- Table 34: Peru Recovered Paper Industry Revenue (Million) Forecast, by Application 2019 & 2032
- Table 35: Chile Recovered Paper Industry Revenue (Million) Forecast, by Application 2019 & 2032
- Table 36: Colombia Recovered Paper Industry Revenue (Million) Forecast, by Application 2019 & 2032
- Table 37: Ecuador Recovered Paper Industry Revenue (Million) Forecast, by Application 2019 & 2032
- Table 38: Venezuela Recovered Paper Industry Revenue (Million) Forecast, by Application 2019 & 2032
- Table 39: Rest of South America Recovered Paper Industry Revenue (Million) Forecast, by Application 2019 & 2032
- Table 40: Global Recovered Paper Industry Revenue Million Forecast, by Country 2019 & 2032
- Table 41: United States Recovered Paper Industry Revenue (Million) Forecast, by Application 2019 & 2032
- Table 42: Canada Recovered Paper Industry Revenue (Million) Forecast, by Application 2019 & 2032
- Table 43: Mexico Recovered Paper Industry Revenue (Million) Forecast, by Application 2019 & 2032
- Table 44: Global Recovered Paper Industry Revenue Million Forecast, by Country 2019 & 2032
- Table 45: United Arab Emirates Recovered Paper Industry Revenue (Million) Forecast, by Application 2019 & 2032
- Table 46: Saudi Arabia Recovered Paper Industry Revenue (Million) Forecast, by Application 2019 & 2032
- Table 47: South Africa Recovered Paper Industry Revenue (Million) Forecast, by Application 2019 & 2032
- Table 48: Rest of Middle East and Africa Recovered Paper Industry Revenue (Million) Forecast, by Application 2019 & 2032
- Table 49: Global Recovered Paper Industry Revenue Million Forecast, by Type 2019 & 2032
- Table 50: Global Recovered Paper Industry Revenue Million Forecast, by Country 2019 & 2032
- Table 51: Global Recovered Paper Industry Revenue Million Forecast, by Type 2019 & 2032
- Table 52: Global Recovered Paper Industry Revenue Million Forecast, by Country 2019 & 2032
- Table 53: Global Recovered Paper Industry Revenue Million Forecast, by Type 2019 & 2032
- Table 54: Global Recovered Paper Industry Revenue Million Forecast, by Country 2019 & 2032
- Table 55: Global Recovered Paper Industry Revenue Million Forecast, by Type 2019 & 2032
- Table 56: Global Recovered Paper Industry Revenue Million Forecast, by Country 2019 & 2032
- Table 57: Global Recovered Paper Industry Revenue Million Forecast, by Type 2019 & 2032
- Table 58: Global Recovered Paper Industry Revenue Million Forecast, by Country 2019 & 2032
Frequently Asked Questions
1. What is the projected Compound Annual Growth Rate (CAGR) of the Recovered Paper Industry?
The projected CAGR is approximately 2.70%.
2. Which companies are prominent players in the Recovered Paper Industry?
Key companies in the market include International Paper, Tay Paper Recycling Pte Ltd, Smurfit Kappa Group plc, Nine Dragons Paper (Holdings) Limited, Stora Enso Oyj, S A Industrias Celulosa Aragonesa (SAICA), Visy Industrie, DS Smith Plc.
3. What are the main segments of the Recovered Paper Industry?
The market segments include Type.
4. Can you provide details about the market size?
The market size is estimated to be USD XX Million as of 2022.
5. What are some drivers contributing to market growth?
Growth in E-commerce Sales in China; Rising Demand from the Food-service Sector; Growing Consumer Awareness on Paper Packaging; Recycling Initiatives Involving Closed-loop Systems to Aid Market Adoption of Paper Packaging-based Materials.
6. What are the notable trends driving market growth?
Containerboard to Dominate the Market.
7. Are there any restraints impacting market growth?
Recycling. Raw Material Supply Chain Management. and Challenges in the Paper Packaging Industry; Effects of Deforestation on Paper Packaging; Increasing Raw Material Costs and Outsourcing.
8. Can you provide examples of recent developments in the market?
N/A
9. What pricing options are available for accessing the report?
Pricing options include single-user, multi-user, and enterprise licenses priced at USD 4750, USD 5250, and USD 8750 respectively.
10. Is the market size provided in terms of value or volume?
The market size is provided in terms of value, measured in Million.
11. Are there any specific market keywords associated with the report?
Yes, the market keyword associated with the report is "Recovered Paper Industry," which aids in identifying and referencing the specific market segment covered.
12. How do I determine which pricing option suits my needs best?
The pricing options vary based on user requirements and access needs. Individual users may opt for single-user licenses, while businesses requiring broader access may choose multi-user or enterprise licenses for cost-effective access to the report.
13. Are there any additional resources or data provided in the Recovered Paper Industry report?
While the report offers comprehensive insights, it's advisable to review the specific contents or supplementary materials provided to ascertain if additional resources or data are available.
14. How can I stay updated on further developments or reports in the Recovered Paper Industry?
To stay informed about further developments, trends, and reports in the Recovered Paper Industry, consider subscribing to industry newsletters, following relevant companies and organizations, or regularly checking reputable industry news sources and publications.
Methodology
Step 1 - Identification of Relevant Samples Size from Population Database


Step 2 - Approaches for Defining Global Market Size (Value, Volume* & Price*)

Note*: In applicable scenarios
Step 3 - Data Sources
Primary Research
- Web Analytics
- Survey Reports
- Research Institute
- Latest Research Reports
- Opinion Leaders
Secondary Research
- Annual Reports
- White Paper
- Latest Press Release
- Industry Association
- Paid Database
- Investor Presentations

Step 4 - Data Triangulation
Involves using different sources of information in order to increase the validity of a study
These sources are likely to be stakeholders in a program - participants, other researchers, program staff, other community members, and so on.
Then we put all data in single framework & apply various statistical tools to find out the dynamic on the market.
During the analysis stage, feedback from the stakeholder groups would be compared to determine areas of agreement as well as areas of divergence
