

Key Insights
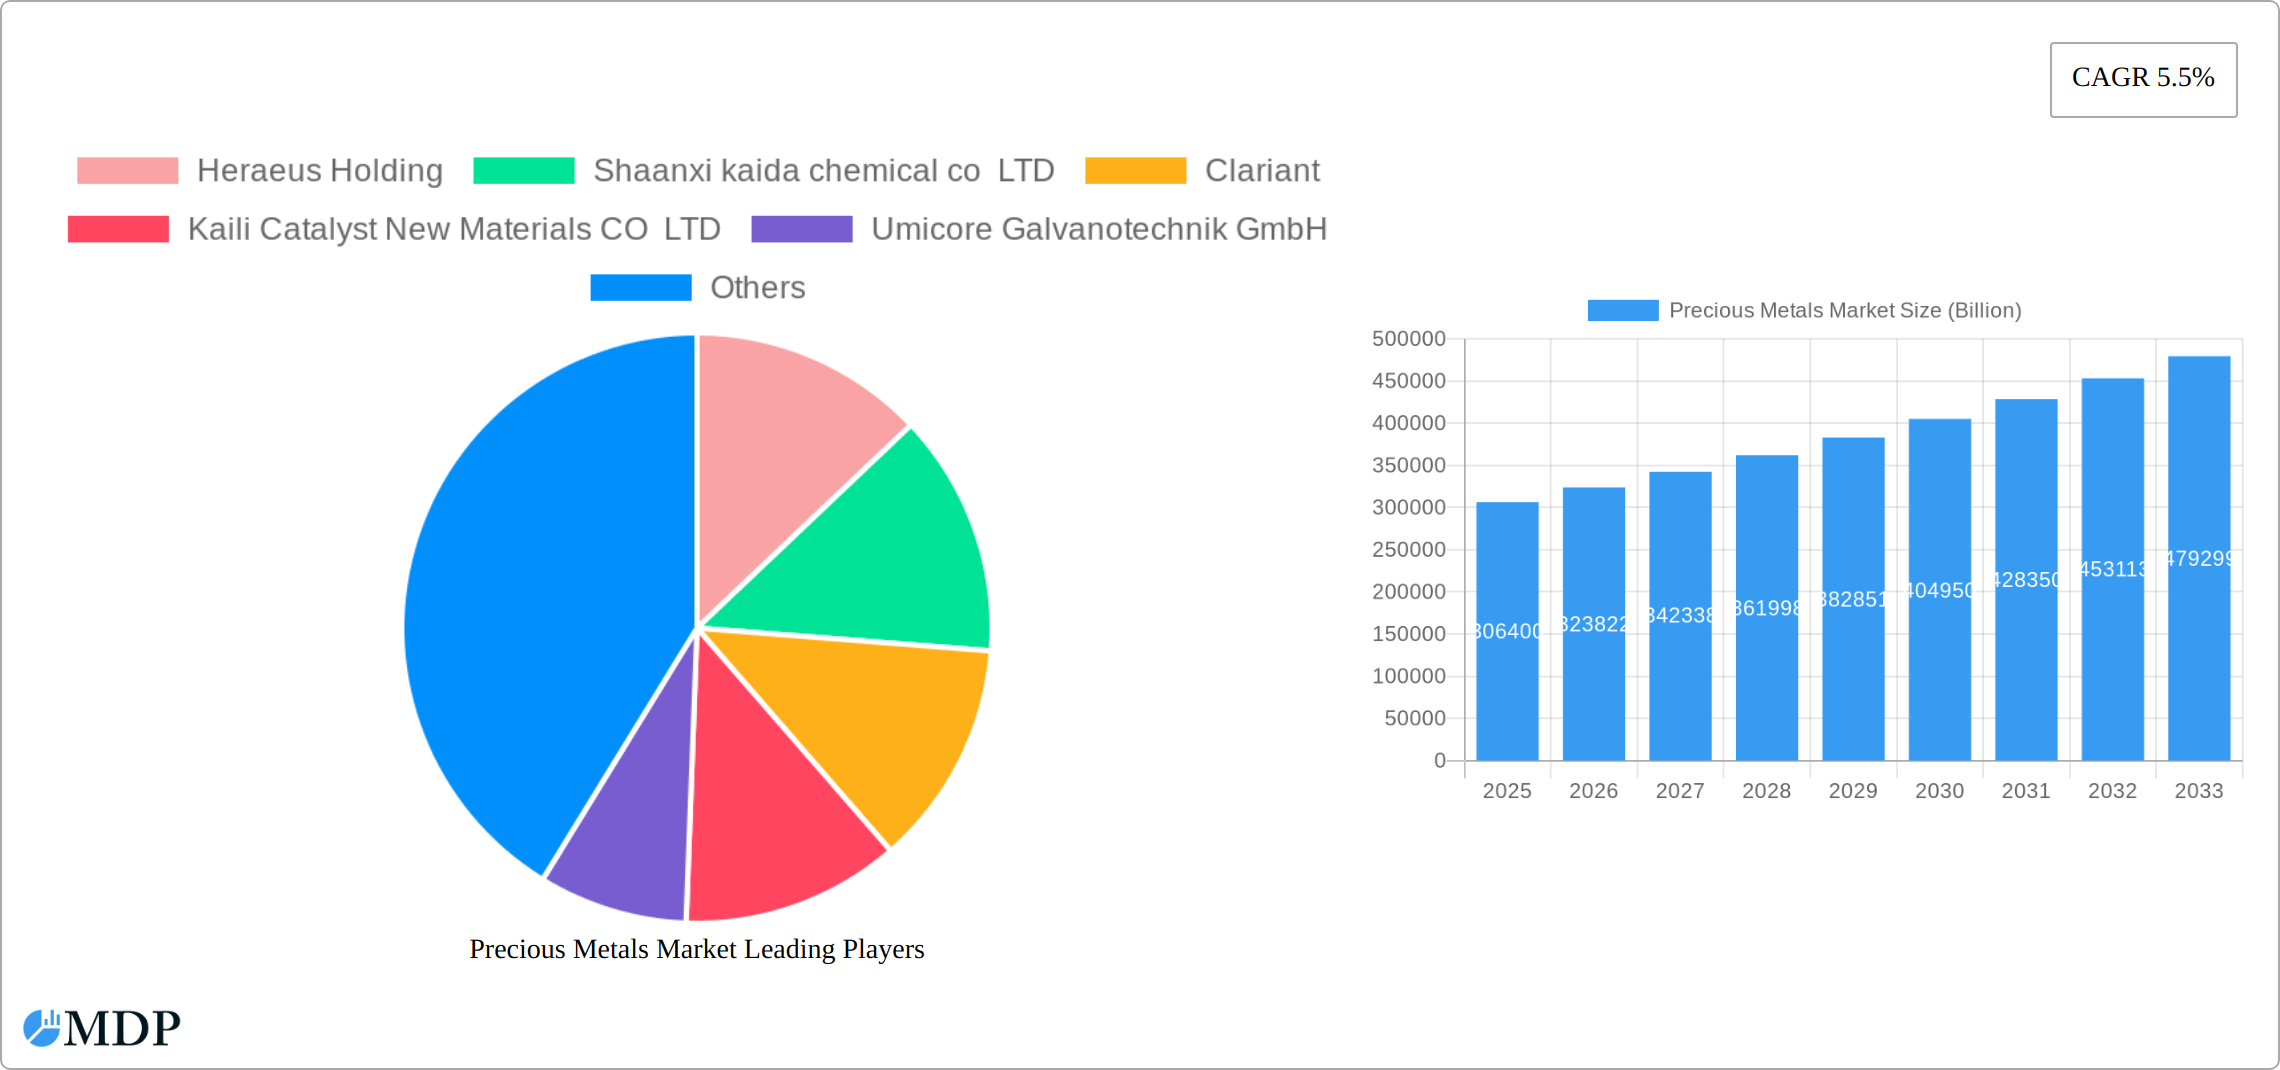
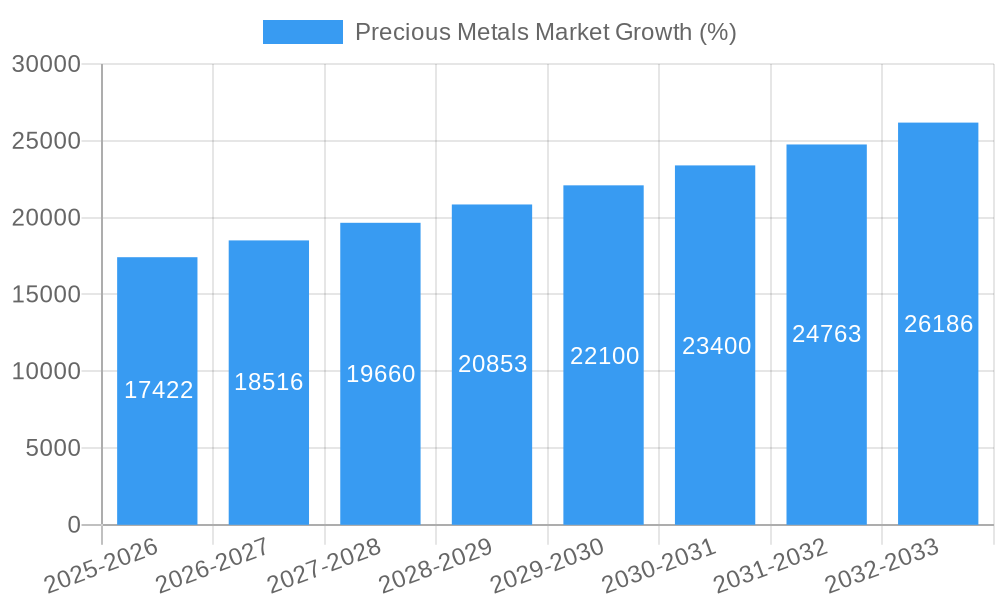
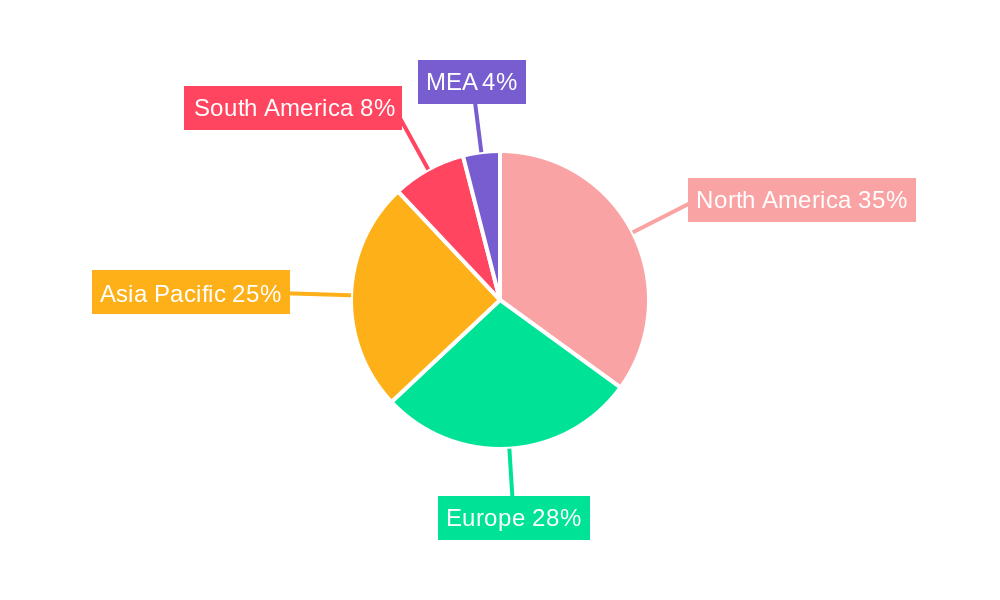
The global precious metals market, valued at $306.4 billion in 2025, is projected to experience robust growth, driven by a compound annual growth rate (CAGR) of 5.5% from 2025 to 2033. This expansion is fueled by several key factors. Firstly, the automotive industry's increasing demand for catalytic converters, which utilize platinum, palladium, and rhodium for emission control, is a significant driver. The burgeoning pharmaceutical sector also contributes substantially, with precious metals employed in various drug manufacturing processes and medical devices. Furthermore, the petrochemical industry relies on these metals for catalysis in refining processes, further boosting market demand. Growth is also spurred by advancements in nanotechnology and electronics, where these metals play crucial roles. Regional variations exist, with North America and Asia Pacific expected to dominate market share due to robust automotive and industrial sectors. While the market exhibits significant potential, challenges remain, such as price volatility inherent in precious metal commodities and potential supply chain disruptions. Furthermore, the development of alternative catalytic materials presents a long-term restraint, requiring the industry to constantly innovate and adapt.
The market segmentation reveals a diverse landscape. Platinum remains the dominant metal type, followed by palladium, with both exhibiting high demand across various applications. Rhodium and iridium, while commanding smaller market shares, are essential in specialized applications, particularly in the automotive and electronics sectors. The automotive application segment is anticipated to remain the largest revenue generator throughout the forecast period, owing to stringent emission regulations globally. However, the pharmaceutical and petrochemical segments are also projected to show significant growth. Key players in the market, including Heraeus Holding, Johnson Matthey, and BASF SE, leverage their strong technological capabilities and established distribution networks to maintain market leadership. Competitive strategies among these players focus on technological advancements, vertical integration, and strategic partnerships to secure raw materials and meet growing demand.
Precious Metals Market Report: 2019-2033 Forecast
Unlock the potential of the Precious Metals Market with our comprehensive report, providing in-depth analysis and future projections for 2025-2033. This report is essential for stakeholders seeking to navigate the complexities of this dynamic market and capitalize on emerging opportunities.
This meticulously researched report offers a detailed overview of the precious metals market, encompassing historical data (2019-2024), current estimates (2025), and future projections (2025-2033). It provides crucial insights into market dynamics, key players, and emerging trends to inform strategic decision-making. The report analyzes key segments by Type (Platinum, Palladium, Rhodium, Iridium, Ruthenium, Other Types) and Application (Automotive, Pharmaceutical, Petrochemicals, Other Applications), offering a granular view of market behavior and potential. The total market size is projected to reach xx Billion by 2033.
This report covers:
Precious Metals Market Dynamics & Concentration
This section analyzes the market's competitive landscape, examining factors driving innovation, regulatory influences, and the presence of substitute products. It explores end-user trends and merger & acquisition (M&A) activity.
Market Concentration: The market shows a moderately concentrated structure with a few major players holding significant market share. The top 5 companies account for approximately xx% of the total market revenue in 2025. M&A activity has been moderate, with approximately xx deals recorded between 2019 and 2024.
Innovation Drivers: Ongoing research and development in catalysis, electronics, and medical applications are major innovation drivers. The demand for efficient and sustainable technologies is pushing for improved precious metal utilization and recycling.
Regulatory Frameworks: Government regulations regarding environmental protection and responsible sourcing of precious metals are significantly influencing market dynamics. Compliance costs and regulations impact profitability and investment decisions.
Product Substitutes: While some substitute materials exist, their limited performance often restricts widespread adoption, ensuring continued high demand for precious metals in specific high-performance applications.
End-User Trends: The automotive industry remains a key driver, primarily due to increasing demand for catalytic converters and advanced electronics. The pharmaceutical and electronics sectors are also experiencing substantial growth in their use of precious metals.
Precious Metals Market Industry Trends & Analysis
This section delves into detailed market trends, highlighting growth drivers, technological advancements, consumer preferences, and competitive dynamics. The forecast period shows a Compound Annual Growth Rate (CAGR) of xx% for the overall market.
The market is experiencing significant growth fueled by increasing demand from various sectors, coupled with technological advancements improving the efficiency and effectiveness of precious metals in key applications. Technological disruptions, particularly in areas such as nanotechnology, are opening up new avenues for application and value creation. Consumer preferences for high-performance products across various sectors indirectly drive the demand for precious metals. Competitive dynamics are characterized by a combination of price competition and differentiation through technological innovation and value-added services. Market penetration in emerging economies is projected to accelerate significantly over the forecast period, driven by increasing industrialization and infrastructure development.
Leading Markets & Segments in Precious Metals Market
This section identifies leading regions, countries, and market segments, analyzing the factors driving their dominance.
Dominant Regions/Countries: [Insert dominant region/country analysis including economic policies and infrastructure development contributing to market dominance. e.g., "The North American region maintains its leading position due to robust automotive and electronics sectors and supportive government policies. Strong infrastructure and technological advancements in the region facilitate increased adoption of precious metals across multiple applications."]
Dominant Types: Platinum and palladium continue to dominate the market due to their widespread use in automotive catalytic converters. However, growing demand from electronics and medical applications drives the increased utilization of rhodium and iridium, exhibiting above average CAGR.
Dominant Applications: The automotive industry is the largest consumer of precious metals, driven by stringent emission regulations. The pharmaceutical industry demonstrates steady growth due to their crucial role in medical devices and treatments.
Key Drivers:
- Robust economic growth in key regions.
- Expansion of automotive and electronics sectors.
- Increasing demand for high-performance materials.
- Technological advancements enabling new applications.
- Government support for innovation and technological growth.
Precious Metals Market Product Developments
The precious metals market is experiencing a wave of innovation focused on enhancing existing applications and forging new ones. Nanotechnology is at the forefront, enabling the creation of materials with significantly improved catalytic properties and dramatically increased surface area. This leads to a more efficient use of precious metals, resulting in more sustainable and cost-effective solutions across various industries. Beyond nanotechnology, leading players are heavily invested in developing advanced alloys and coatings designed to optimize precious metal performance even in the most demanding and corrosive environments. This focus on refinement is directly impacting market penetration, especially within high-performance applications like aerospace and medical devices. Furthermore, research into recycling and responsible sourcing of precious metals is gaining traction, aiming to minimize environmental impact and ensure long-term supply chain sustainability.
Key Drivers of Precious Metals Market Growth
Robust growth in the precious metals market is fueled by a confluence of factors, including rapid technological advancements, consistent global economic expansion (with fluctuations considered), and increasingly stringent environmental regulations. The automotive industry remains a major driver, with the ongoing demand for high-efficiency catalytic converters essential for meeting ever-stricter emission standards. Simultaneously, technological breakthroughs in sectors like electronics, medicine, and renewable energy are continuously uncovering new applications for these valuable metals. Government policies supporting clean energy initiatives and sustainable technologies further amplify this growth trajectory. Investment in research and development, coupled with the inherent value stability of precious metals, contributes to investor confidence and market expansion.
Challenges in the Precious Metals Market Market
Significant challenges include price volatility, supply chain disruptions, and intense competition. Price fluctuations directly impact profitability, creating uncertainty for manufacturers and consumers. Geopolitical instability in primary producing countries can severely disrupt supply chains. Finally, strong competition among producers and the presence of substitute materials exert downward pressure on prices and margins. These factors collectively impact market stability and growth.
Emerging Opportunities in Precious Metals Market
Emerging opportunities reside in the development of new applications in rapidly growing industries, including renewable energy and advanced electronics. Strategic partnerships between precious metal producers and technology companies are generating innovative products and expanding market penetration. Furthermore, exploration and development of new resources and advancements in recycling technologies will play a key role in future market growth.
Leading Players in the Precious Metals Market Sector
- Heraeus Holding
- Shaanxi Kaida Chemical Co., Ltd.
- Clariant
- Kaili Catalyst New Materials Co., Ltd.
- Umicore Galvanotechnik GmbH
- American Elements
- CHIMET
- Evonik Industries AG
- Sabin Metal Corporation
- Souvenier Chemicals
- ReMetall Deutschland AG
- BASF SE
- Stanford Advanced Materials
- Catalytic Products International
- J&J Materials Inc
- Alfa Aesar Thermo Fisher Scientific
- Johnson Matthey
- ALS Limited
Key Milestones in Precious Metals Market Industry
- 2022: Johnson Matthey launched a new platinum-based catalyst with significantly enhanced efficiency, directly impacting the automotive industry's ability to meet increasingly stringent emissions targets. This resulted in a notable increase in market share for their automotive catalysts.
- 2021: Significant investment in research and development by Heraeus led to breakthroughs in palladium-based alloys for use in hydrogen fuel cell technology, pushing the boundaries of renewable energy applications.
- 2020: New regulations in the EU regarding electronic waste recycling created increased demand for responsible sourcing and recycling of precious metals, boosting the market for specialized recycling technologies.
- 2019: The introduction of a novel gold nanoparticle-based diagnostic tool by a smaller biotech company highlighted the expanding role of precious metals in the medical field.
- 2018: Clariant introduced a new line of sustainable catalysts utilizing less precious metal while maintaining performance, contributing to a shift towards more environmentally conscious manufacturing processes.
Strategic Outlook for Precious Metals Market Market
The long-term outlook for the precious metals market remains positive, driven by technological innovations, increased demand from emerging economies, and a growing focus on sustainability. Companies focusing on strategic partnerships, research and development, and efficient supply chain management are poised to capture significant market share. The market’s potential will depend on navigating geopolitical uncertainties and price volatility while capitalizing on technological breakthroughs and new applications.
Precious Metals Market Segmentation
-
1. Type
- 1.1. Platinum
- 1.2. Palladium
- 1.3. Rhodium
- 1.4. Iridium
- 1.5. Ruthenium
- 1.6. Other Types
-
2. Application
- 2.1. Automotive
- 2.2. Pharmaceutical
- 2.3. Petrochemicals
- 2.4. Other Applications
Precious Metals Market Segmentation By Geography
-
1. Asia Pacific
- 1.1. China
- 1.2. India
- 1.3. Japan
- 1.4. South Korea
- 1.5. ASEAN Countries
- 1.6. Rest of Asia Pacific
-
2. North America
- 2.1. United States
- 2.2. Canada
- 2.3. Mexico
-
3. Europe
- 3.1. Germany
- 3.2. United Kingdom
- 3.3. Italy
- 3.4. France
- 3.5. Rest of Europe
-
4. South America
- 4.1. Brazil
- 4.2. Argentina
- 4.3. Rest of South America
-
5. Middle East and Africa
- 5.1. Saudi Arabia
- 5.2. South Africa
- 5.3. Rest of Middle East and Africa
Precious Metals Market REPORT HIGHLIGHTS
| Aspects | Details |
|---|---|
| Study Period | 2019-2033 |
| Base Year | 2024 |
| Estimated Year | 2025 |
| Forecast Period | 2025-2033 |
| Historical Period | 2019-2024 |
| Growth Rate | CAGR of 5.5% from 2019-2033 |
| Segmentation |
|
Table of Contents
- 1. Introduction
- 1.1. Research Scope
- 1.2. Market Segmentation
- 1.3. Research Methodology
- 1.4. Definitions and Assumptions
- 2. Executive Summary
- 2.1. Introduction
- 3. Market Dynamics
- 3.1. Introduction
- 3.2. Market Drivers
- 3.2.1. Accelerating Demand for High-Performance Transportation Fuel; Increasing Investment in Refineries; Other Drivers
- 3.3. Market Restrains
- 3.3.1. High Production Costs; Other Restraints
- 3.4. Market Trends
- 3.4.1. Automotive Segment to Dominate the Market
- 4. Market Factor Analysis
- 4.1. Porters Five Forces
- 4.2. Supply/Value Chain
- 4.3. PESTEL analysis
- 4.4. Market Entropy
- 4.5. Patent/Trademark Analysis
- 5. Global Precious Metals Market Analysis, Insights and Forecast, 2019-2031
- 5.1. Market Analysis, Insights and Forecast - by Type
- 5.1.1. Platinum
- 5.1.2. Palladium
- 5.1.3. Rhodium
- 5.1.4. Iridium
- 5.1.5. Ruthenium
- 5.1.6. Other Types
- 5.2. Market Analysis, Insights and Forecast - by Application
- 5.2.1. Automotive
- 5.2.2. Pharmaceutical
- 5.2.3. Petrochemicals
- 5.2.4. Other Applications
- 5.3. Market Analysis, Insights and Forecast - by Region
- 5.3.1. Asia Pacific
- 5.3.2. North America
- 5.3.3. Europe
- 5.3.4. South America
- 5.3.5. Middle East and Africa
- 5.1. Market Analysis, Insights and Forecast - by Type
- 6. Asia Pacific Precious Metals Market Analysis, Insights and Forecast, 2019-2031
- 6.1. Market Analysis, Insights and Forecast - by Type
- 6.1.1. Platinum
- 6.1.2. Palladium
- 6.1.3. Rhodium
- 6.1.4. Iridium
- 6.1.5. Ruthenium
- 6.1.6. Other Types
- 6.2. Market Analysis, Insights and Forecast - by Application
- 6.2.1. Automotive
- 6.2.2. Pharmaceutical
- 6.2.3. Petrochemicals
- 6.2.4. Other Applications
- 6.1. Market Analysis, Insights and Forecast - by Type
- 7. North America Precious Metals Market Analysis, Insights and Forecast, 2019-2031
- 7.1. Market Analysis, Insights and Forecast - by Type
- 7.1.1. Platinum
- 7.1.2. Palladium
- 7.1.3. Rhodium
- 7.1.4. Iridium
- 7.1.5. Ruthenium
- 7.1.6. Other Types
- 7.2. Market Analysis, Insights and Forecast - by Application
- 7.2.1. Automotive
- 7.2.2. Pharmaceutical
- 7.2.3. Petrochemicals
- 7.2.4. Other Applications
- 7.1. Market Analysis, Insights and Forecast - by Type
- 8. Europe Precious Metals Market Analysis, Insights and Forecast, 2019-2031
- 8.1. Market Analysis, Insights and Forecast - by Type
- 8.1.1. Platinum
- 8.1.2. Palladium
- 8.1.3. Rhodium
- 8.1.4. Iridium
- 8.1.5. Ruthenium
- 8.1.6. Other Types
- 8.2. Market Analysis, Insights and Forecast - by Application
- 8.2.1. Automotive
- 8.2.2. Pharmaceutical
- 8.2.3. Petrochemicals
- 8.2.4. Other Applications
- 8.1. Market Analysis, Insights and Forecast - by Type
- 9. South America Precious Metals Market Analysis, Insights and Forecast, 2019-2031
- 9.1. Market Analysis, Insights and Forecast - by Type
- 9.1.1. Platinum
- 9.1.2. Palladium
- 9.1.3. Rhodium
- 9.1.4. Iridium
- 9.1.5. Ruthenium
- 9.1.6. Other Types
- 9.2. Market Analysis, Insights and Forecast - by Application
- 9.2.1. Automotive
- 9.2.2. Pharmaceutical
- 9.2.3. Petrochemicals
- 9.2.4. Other Applications
- 9.1. Market Analysis, Insights and Forecast - by Type
- 10. Middle East and Africa Precious Metals Market Analysis, Insights and Forecast, 2019-2031
- 10.1. Market Analysis, Insights and Forecast - by Type
- 10.1.1. Platinum
- 10.1.2. Palladium
- 10.1.3. Rhodium
- 10.1.4. Iridium
- 10.1.5. Ruthenium
- 10.1.6. Other Types
- 10.2. Market Analysis, Insights and Forecast - by Application
- 10.2.1. Automotive
- 10.2.2. Pharmaceutical
- 10.2.3. Petrochemicals
- 10.2.4. Other Applications
- 10.1. Market Analysis, Insights and Forecast - by Type
- 11. North America Precious Metals Market Analysis, Insights and Forecast, 2019-2031
- 11.1. Market Analysis, Insights and Forecast - By Country/Sub-region
- 11.1.1 United States
- 11.1.2 Canada
- 11.1.3 Mexico
- 12. Europe Precious Metals Market Analysis, Insights and Forecast, 2019-2031
- 12.1. Market Analysis, Insights and Forecast - By Country/Sub-region
- 12.1.1 Germany
- 12.1.2 France
- 12.1.3 Italy
- 12.1.4 United Kingdom
- 12.1.5 Netherlands
- 12.1.6 Rest of Europe
- 13. Asia Pacific Precious Metals Market Analysis, Insights and Forecast, 2019-2031
- 13.1. Market Analysis, Insights and Forecast - By Country/Sub-region
- 13.1.1 China
- 13.1.2 Japan
- 13.1.3 India
- 13.1.4 South Korea
- 13.1.5 Taiwan
- 13.1.6 Australia
- 13.1.7 Rest of Asia-Pacific
- 14. South America Precious Metals Market Analysis, Insights and Forecast, 2019-2031
- 14.1. Market Analysis, Insights and Forecast - By Country/Sub-region
- 14.1.1 Brazil
- 14.1.2 Argentina
- 14.1.3 Rest of South America
- 15. MEA Precious Metals Market Analysis, Insights and Forecast, 2019-2031
- 15.1. Market Analysis, Insights and Forecast - By Country/Sub-region
- 15.1.1 Middle East
- 15.1.2 Africa
- 16. Competitive Analysis
- 16.1. Global Market Share Analysis 2024
- 16.2. Company Profiles
- 16.2.1 Heraeus Holding
- 16.2.1.1. Overview
- 16.2.1.2. Products
- 16.2.1.3. SWOT Analysis
- 16.2.1.4. Recent Developments
- 16.2.1.5. Financials (Based on Availability)
- 16.2.2 Shaanxi kaida chemical co LTD
- 16.2.2.1. Overview
- 16.2.2.2. Products
- 16.2.2.3. SWOT Analysis
- 16.2.2.4. Recent Developments
- 16.2.2.5. Financials (Based on Availability)
- 16.2.3 Clariant
- 16.2.3.1. Overview
- 16.2.3.2. Products
- 16.2.3.3. SWOT Analysis
- 16.2.3.4. Recent Developments
- 16.2.3.5. Financials (Based on Availability)
- 16.2.4 Kaili Catalyst New Materials CO LTD
- 16.2.4.1. Overview
- 16.2.4.2. Products
- 16.2.4.3. SWOT Analysis
- 16.2.4.4. Recent Developments
- 16.2.4.5. Financials (Based on Availability)
- 16.2.5 Umicore Galvanotechnik GmbH
- 16.2.5.1. Overview
- 16.2.5.2. Products
- 16.2.5.3. SWOT Analysis
- 16.2.5.4. Recent Developments
- 16.2.5.5. Financials (Based on Availability)
- 16.2.6 American Elements
- 16.2.6.1. Overview
- 16.2.6.2. Products
- 16.2.6.3. SWOT Analysis
- 16.2.6.4. Recent Developments
- 16.2.6.5. Financials (Based on Availability)
- 16.2.7 CHIMET
- 16.2.7.1. Overview
- 16.2.7.2. Products
- 16.2.7.3. SWOT Analysis
- 16.2.7.4. Recent Developments
- 16.2.7.5. Financials (Based on Availability)
- 16.2.8 Evonik Industries AG
- 16.2.8.1. Overview
- 16.2.8.2. Products
- 16.2.8.3. SWOT Analysis
- 16.2.8.4. Recent Developments
- 16.2.8.5. Financials (Based on Availability)
- 16.2.9 Sabin Metal Corporation
- 16.2.9.1. Overview
- 16.2.9.2. Products
- 16.2.9.3. SWOT Analysis
- 16.2.9.4. Recent Developments
- 16.2.9.5. Financials (Based on Availability)
- 16.2.10 Souvenier Chemicals
- 16.2.10.1. Overview
- 16.2.10.2. Products
- 16.2.10.3. SWOT Analysis
- 16.2.10.4. Recent Developments
- 16.2.10.5. Financials (Based on Availability)
- 16.2.11 ReMetall Deutschland AG
- 16.2.11.1. Overview
- 16.2.11.2. Products
- 16.2.11.3. SWOT Analysis
- 16.2.11.4. Recent Developments
- 16.2.11.5. Financials (Based on Availability)
- 16.2.12 BASF SE
- 16.2.12.1. Overview
- 16.2.12.2. Products
- 16.2.12.3. SWOT Analysis
- 16.2.12.4. Recent Developments
- 16.2.12.5. Financials (Based on Availability)
- 16.2.13 Stanford Advanced Materials
- 16.2.13.1. Overview
- 16.2.13.2. Products
- 16.2.13.3. SWOT Analysis
- 16.2.13.4. Recent Developments
- 16.2.13.5. Financials (Based on Availability)
- 16.2.14 Catalytic Products International
- 16.2.14.1. Overview
- 16.2.14.2. Products
- 16.2.14.3. SWOT Analysis
- 16.2.14.4. Recent Developments
- 16.2.14.5. Financials (Based on Availability)
- 16.2.15 J&J Materials Inc
- 16.2.15.1. Overview
- 16.2.15.2. Products
- 16.2.15.3. SWOT Analysis
- 16.2.15.4. Recent Developments
- 16.2.15.5. Financials (Based on Availability)
- 16.2.16 Alfa Aesar Thermo Fisher Scientific
- 16.2.16.1. Overview
- 16.2.16.2. Products
- 16.2.16.3. SWOT Analysis
- 16.2.16.4. Recent Developments
- 16.2.16.5. Financials (Based on Availability)
- 16.2.17 Johnson Matthey
- 16.2.17.1. Overview
- 16.2.17.2. Products
- 16.2.17.3. SWOT Analysis
- 16.2.17.4. Recent Developments
- 16.2.17.5. Financials (Based on Availability)
- 16.2.18 ALS Limited
- 16.2.18.1. Overview
- 16.2.18.2. Products
- 16.2.18.3. SWOT Analysis
- 16.2.18.4. Recent Developments
- 16.2.18.5. Financials (Based on Availability)
- 16.2.1 Heraeus Holding
List of Figures
- Figure 1: Global Precious Metals Market Revenue Breakdown (Billion, %) by Region 2024 & 2032
- Figure 2: Global Precious Metals Market Volume Breakdown (K Tons, %) by Region 2024 & 2032
- Figure 3: North America Precious Metals Market Revenue (Billion), by Country 2024 & 2032
- Figure 4: North America Precious Metals Market Volume (K Tons), by Country 2024 & 2032
- Figure 5: North America Precious Metals Market Revenue Share (%), by Country 2024 & 2032
- Figure 6: North America Precious Metals Market Volume Share (%), by Country 2024 & 2032
- Figure 7: Europe Precious Metals Market Revenue (Billion), by Country 2024 & 2032
- Figure 8: Europe Precious Metals Market Volume (K Tons), by Country 2024 & 2032
- Figure 9: Europe Precious Metals Market Revenue Share (%), by Country 2024 & 2032
- Figure 10: Europe Precious Metals Market Volume Share (%), by Country 2024 & 2032
- Figure 11: Asia Pacific Precious Metals Market Revenue (Billion), by Country 2024 & 2032
- Figure 12: Asia Pacific Precious Metals Market Volume (K Tons), by Country 2024 & 2032
- Figure 13: Asia Pacific Precious Metals Market Revenue Share (%), by Country 2024 & 2032
- Figure 14: Asia Pacific Precious Metals Market Volume Share (%), by Country 2024 & 2032
- Figure 15: South America Precious Metals Market Revenue (Billion), by Country 2024 & 2032
- Figure 16: South America Precious Metals Market Volume (K Tons), by Country 2024 & 2032
- Figure 17: South America Precious Metals Market Revenue Share (%), by Country 2024 & 2032
- Figure 18: South America Precious Metals Market Volume Share (%), by Country 2024 & 2032
- Figure 19: MEA Precious Metals Market Revenue (Billion), by Country 2024 & 2032
- Figure 20: MEA Precious Metals Market Volume (K Tons), by Country 2024 & 2032
- Figure 21: MEA Precious Metals Market Revenue Share (%), by Country 2024 & 2032
- Figure 22: MEA Precious Metals Market Volume Share (%), by Country 2024 & 2032
- Figure 23: Asia Pacific Precious Metals Market Revenue (Billion), by Type 2024 & 2032
- Figure 24: Asia Pacific Precious Metals Market Volume (K Tons), by Type 2024 & 2032
- Figure 25: Asia Pacific Precious Metals Market Revenue Share (%), by Type 2024 & 2032
- Figure 26: Asia Pacific Precious Metals Market Volume Share (%), by Type 2024 & 2032
- Figure 27: Asia Pacific Precious Metals Market Revenue (Billion), by Application 2024 & 2032
- Figure 28: Asia Pacific Precious Metals Market Volume (K Tons), by Application 2024 & 2032
- Figure 29: Asia Pacific Precious Metals Market Revenue Share (%), by Application 2024 & 2032
- Figure 30: Asia Pacific Precious Metals Market Volume Share (%), by Application 2024 & 2032
- Figure 31: Asia Pacific Precious Metals Market Revenue (Billion), by Country 2024 & 2032
- Figure 32: Asia Pacific Precious Metals Market Volume (K Tons), by Country 2024 & 2032
- Figure 33: Asia Pacific Precious Metals Market Revenue Share (%), by Country 2024 & 2032
- Figure 34: Asia Pacific Precious Metals Market Volume Share (%), by Country 2024 & 2032
- Figure 35: North America Precious Metals Market Revenue (Billion), by Type 2024 & 2032
- Figure 36: North America Precious Metals Market Volume (K Tons), by Type 2024 & 2032
- Figure 37: North America Precious Metals Market Revenue Share (%), by Type 2024 & 2032
- Figure 38: North America Precious Metals Market Volume Share (%), by Type 2024 & 2032
- Figure 39: North America Precious Metals Market Revenue (Billion), by Application 2024 & 2032
- Figure 40: North America Precious Metals Market Volume (K Tons), by Application 2024 & 2032
- Figure 41: North America Precious Metals Market Revenue Share (%), by Application 2024 & 2032
- Figure 42: North America Precious Metals Market Volume Share (%), by Application 2024 & 2032
- Figure 43: North America Precious Metals Market Revenue (Billion), by Country 2024 & 2032
- Figure 44: North America Precious Metals Market Volume (K Tons), by Country 2024 & 2032
- Figure 45: North America Precious Metals Market Revenue Share (%), by Country 2024 & 2032
- Figure 46: North America Precious Metals Market Volume Share (%), by Country 2024 & 2032
- Figure 47: Europe Precious Metals Market Revenue (Billion), by Type 2024 & 2032
- Figure 48: Europe Precious Metals Market Volume (K Tons), by Type 2024 & 2032
- Figure 49: Europe Precious Metals Market Revenue Share (%), by Type 2024 & 2032
- Figure 50: Europe Precious Metals Market Volume Share (%), by Type 2024 & 2032
- Figure 51: Europe Precious Metals Market Revenue (Billion), by Application 2024 & 2032
- Figure 52: Europe Precious Metals Market Volume (K Tons), by Application 2024 & 2032
- Figure 53: Europe Precious Metals Market Revenue Share (%), by Application 2024 & 2032
- Figure 54: Europe Precious Metals Market Volume Share (%), by Application 2024 & 2032
- Figure 55: Europe Precious Metals Market Revenue (Billion), by Country 2024 & 2032
- Figure 56: Europe Precious Metals Market Volume (K Tons), by Country 2024 & 2032
- Figure 57: Europe Precious Metals Market Revenue Share (%), by Country 2024 & 2032
- Figure 58: Europe Precious Metals Market Volume Share (%), by Country 2024 & 2032
- Figure 59: South America Precious Metals Market Revenue (Billion), by Type 2024 & 2032
- Figure 60: South America Precious Metals Market Volume (K Tons), by Type 2024 & 2032
- Figure 61: South America Precious Metals Market Revenue Share (%), by Type 2024 & 2032
- Figure 62: South America Precious Metals Market Volume Share (%), by Type 2024 & 2032
- Figure 63: South America Precious Metals Market Revenue (Billion), by Application 2024 & 2032
- Figure 64: South America Precious Metals Market Volume (K Tons), by Application 2024 & 2032
- Figure 65: South America Precious Metals Market Revenue Share (%), by Application 2024 & 2032
- Figure 66: South America Precious Metals Market Volume Share (%), by Application 2024 & 2032
- Figure 67: South America Precious Metals Market Revenue (Billion), by Country 2024 & 2032
- Figure 68: South America Precious Metals Market Volume (K Tons), by Country 2024 & 2032
- Figure 69: South America Precious Metals Market Revenue Share (%), by Country 2024 & 2032
- Figure 70: South America Precious Metals Market Volume Share (%), by Country 2024 & 2032
- Figure 71: Middle East and Africa Precious Metals Market Revenue (Billion), by Type 2024 & 2032
- Figure 72: Middle East and Africa Precious Metals Market Volume (K Tons), by Type 2024 & 2032
- Figure 73: Middle East and Africa Precious Metals Market Revenue Share (%), by Type 2024 & 2032
- Figure 74: Middle East and Africa Precious Metals Market Volume Share (%), by Type 2024 & 2032
- Figure 75: Middle East and Africa Precious Metals Market Revenue (Billion), by Application 2024 & 2032
- Figure 76: Middle East and Africa Precious Metals Market Volume (K Tons), by Application 2024 & 2032
- Figure 77: Middle East and Africa Precious Metals Market Revenue Share (%), by Application 2024 & 2032
- Figure 78: Middle East and Africa Precious Metals Market Volume Share (%), by Application 2024 & 2032
- Figure 79: Middle East and Africa Precious Metals Market Revenue (Billion), by Country 2024 & 2032
- Figure 80: Middle East and Africa Precious Metals Market Volume (K Tons), by Country 2024 & 2032
- Figure 81: Middle East and Africa Precious Metals Market Revenue Share (%), by Country 2024 & 2032
- Figure 82: Middle East and Africa Precious Metals Market Volume Share (%), by Country 2024 & 2032
List of Tables
- Table 1: Global Precious Metals Market Revenue Billion Forecast, by Region 2019 & 2032
- Table 2: Global Precious Metals Market Volume K Tons Forecast, by Region 2019 & 2032
- Table 3: Global Precious Metals Market Revenue Billion Forecast, by Type 2019 & 2032
- Table 4: Global Precious Metals Market Volume K Tons Forecast, by Type 2019 & 2032
- Table 5: Global Precious Metals Market Revenue Billion Forecast, by Application 2019 & 2032
- Table 6: Global Precious Metals Market Volume K Tons Forecast, by Application 2019 & 2032
- Table 7: Global Precious Metals Market Revenue Billion Forecast, by Region 2019 & 2032
- Table 8: Global Precious Metals Market Volume K Tons Forecast, by Region 2019 & 2032
- Table 9: Global Precious Metals Market Revenue Billion Forecast, by Country 2019 & 2032
- Table 10: Global Precious Metals Market Volume K Tons Forecast, by Country 2019 & 2032
- Table 11: United States Precious Metals Market Revenue (Billion) Forecast, by Application 2019 & 2032
- Table 12: United States Precious Metals Market Volume (K Tons) Forecast, by Application 2019 & 2032
- Table 13: Canada Precious Metals Market Revenue (Billion) Forecast, by Application 2019 & 2032
- Table 14: Canada Precious Metals Market Volume (K Tons) Forecast, by Application 2019 & 2032
- Table 15: Mexico Precious Metals Market Revenue (Billion) Forecast, by Application 2019 & 2032
- Table 16: Mexico Precious Metals Market Volume (K Tons) Forecast, by Application 2019 & 2032
- Table 17: Global Precious Metals Market Revenue Billion Forecast, by Country 2019 & 2032
- Table 18: Global Precious Metals Market Volume K Tons Forecast, by Country 2019 & 2032
- Table 19: Germany Precious Metals Market Revenue (Billion) Forecast, by Application 2019 & 2032
- Table 20: Germany Precious Metals Market Volume (K Tons) Forecast, by Application 2019 & 2032
- Table 21: France Precious Metals Market Revenue (Billion) Forecast, by Application 2019 & 2032
- Table 22: France Precious Metals Market Volume (K Tons) Forecast, by Application 2019 & 2032
- Table 23: Italy Precious Metals Market Revenue (Billion) Forecast, by Application 2019 & 2032
- Table 24: Italy Precious Metals Market Volume (K Tons) Forecast, by Application 2019 & 2032
- Table 25: United Kingdom Precious Metals Market Revenue (Billion) Forecast, by Application 2019 & 2032
- Table 26: United Kingdom Precious Metals Market Volume (K Tons) Forecast, by Application 2019 & 2032
- Table 27: Netherlands Precious Metals Market Revenue (Billion) Forecast, by Application 2019 & 2032
- Table 28: Netherlands Precious Metals Market Volume (K Tons) Forecast, by Application 2019 & 2032
- Table 29: Rest of Europe Precious Metals Market Revenue (Billion) Forecast, by Application 2019 & 2032
- Table 30: Rest of Europe Precious Metals Market Volume (K Tons) Forecast, by Application 2019 & 2032
- Table 31: Global Precious Metals Market Revenue Billion Forecast, by Country 2019 & 2032
- Table 32: Global Precious Metals Market Volume K Tons Forecast, by Country 2019 & 2032
- Table 33: China Precious Metals Market Revenue (Billion) Forecast, by Application 2019 & 2032
- Table 34: China Precious Metals Market Volume (K Tons) Forecast, by Application 2019 & 2032
- Table 35: Japan Precious Metals Market Revenue (Billion) Forecast, by Application 2019 & 2032
- Table 36: Japan Precious Metals Market Volume (K Tons) Forecast, by Application 2019 & 2032
- Table 37: India Precious Metals Market Revenue (Billion) Forecast, by Application 2019 & 2032
- Table 38: India Precious Metals Market Volume (K Tons) Forecast, by Application 2019 & 2032
- Table 39: South Korea Precious Metals Market Revenue (Billion) Forecast, by Application 2019 & 2032
- Table 40: South Korea Precious Metals Market Volume (K Tons) Forecast, by Application 2019 & 2032
- Table 41: Taiwan Precious Metals Market Revenue (Billion) Forecast, by Application 2019 & 2032
- Table 42: Taiwan Precious Metals Market Volume (K Tons) Forecast, by Application 2019 & 2032
- Table 43: Australia Precious Metals Market Revenue (Billion) Forecast, by Application 2019 & 2032
- Table 44: Australia Precious Metals Market Volume (K Tons) Forecast, by Application 2019 & 2032
- Table 45: Rest of Asia-Pacific Precious Metals Market Revenue (Billion) Forecast, by Application 2019 & 2032
- Table 46: Rest of Asia-Pacific Precious Metals Market Volume (K Tons) Forecast, by Application 2019 & 2032
- Table 47: Global Precious Metals Market Revenue Billion Forecast, by Country 2019 & 2032
- Table 48: Global Precious Metals Market Volume K Tons Forecast, by Country 2019 & 2032
- Table 49: Brazil Precious Metals Market Revenue (Billion) Forecast, by Application 2019 & 2032
- Table 50: Brazil Precious Metals Market Volume (K Tons) Forecast, by Application 2019 & 2032
- Table 51: Argentina Precious Metals Market Revenue (Billion) Forecast, by Application 2019 & 2032
- Table 52: Argentina Precious Metals Market Volume (K Tons) Forecast, by Application 2019 & 2032
- Table 53: Rest of South America Precious Metals Market Revenue (Billion) Forecast, by Application 2019 & 2032
- Table 54: Rest of South America Precious Metals Market Volume (K Tons) Forecast, by Application 2019 & 2032
- Table 55: Global Precious Metals Market Revenue Billion Forecast, by Country 2019 & 2032
- Table 56: Global Precious Metals Market Volume K Tons Forecast, by Country 2019 & 2032
- Table 57: Middle East Precious Metals Market Revenue (Billion) Forecast, by Application 2019 & 2032
- Table 58: Middle East Precious Metals Market Volume (K Tons) Forecast, by Application 2019 & 2032
- Table 59: Africa Precious Metals Market Revenue (Billion) Forecast, by Application 2019 & 2032
- Table 60: Africa Precious Metals Market Volume (K Tons) Forecast, by Application 2019 & 2032
- Table 61: Global Precious Metals Market Revenue Billion Forecast, by Type 2019 & 2032
- Table 62: Global Precious Metals Market Volume K Tons Forecast, by Type 2019 & 2032
- Table 63: Global Precious Metals Market Revenue Billion Forecast, by Application 2019 & 2032
- Table 64: Global Precious Metals Market Volume K Tons Forecast, by Application 2019 & 2032
- Table 65: Global Precious Metals Market Revenue Billion Forecast, by Country 2019 & 2032
- Table 66: Global Precious Metals Market Volume K Tons Forecast, by Country 2019 & 2032
- Table 67: China Precious Metals Market Revenue (Billion) Forecast, by Application 2019 & 2032
- Table 68: China Precious Metals Market Volume (K Tons) Forecast, by Application 2019 & 2032
- Table 69: India Precious Metals Market Revenue (Billion) Forecast, by Application 2019 & 2032
- Table 70: India Precious Metals Market Volume (K Tons) Forecast, by Application 2019 & 2032
- Table 71: Japan Precious Metals Market Revenue (Billion) Forecast, by Application 2019 & 2032
- Table 72: Japan Precious Metals Market Volume (K Tons) Forecast, by Application 2019 & 2032
- Table 73: South Korea Precious Metals Market Revenue (Billion) Forecast, by Application 2019 & 2032
- Table 74: South Korea Precious Metals Market Volume (K Tons) Forecast, by Application 2019 & 2032
- Table 75: ASEAN Countries Precious Metals Market Revenue (Billion) Forecast, by Application 2019 & 2032
- Table 76: ASEAN Countries Precious Metals Market Volume (K Tons) Forecast, by Application 2019 & 2032
- Table 77: Rest of Asia Pacific Precious Metals Market Revenue (Billion) Forecast, by Application 2019 & 2032
- Table 78: Rest of Asia Pacific Precious Metals Market Volume (K Tons) Forecast, by Application 2019 & 2032
- Table 79: Global Precious Metals Market Revenue Billion Forecast, by Type 2019 & 2032
- Table 80: Global Precious Metals Market Volume K Tons Forecast, by Type 2019 & 2032
- Table 81: Global Precious Metals Market Revenue Billion Forecast, by Application 2019 & 2032
- Table 82: Global Precious Metals Market Volume K Tons Forecast, by Application 2019 & 2032
- Table 83: Global Precious Metals Market Revenue Billion Forecast, by Country 2019 & 2032
- Table 84: Global Precious Metals Market Volume K Tons Forecast, by Country 2019 & 2032
- Table 85: United States Precious Metals Market Revenue (Billion) Forecast, by Application 2019 & 2032
- Table 86: United States Precious Metals Market Volume (K Tons) Forecast, by Application 2019 & 2032
- Table 87: Canada Precious Metals Market Revenue (Billion) Forecast, by Application 2019 & 2032
- Table 88: Canada Precious Metals Market Volume (K Tons) Forecast, by Application 2019 & 2032
- Table 89: Mexico Precious Metals Market Revenue (Billion) Forecast, by Application 2019 & 2032
- Table 90: Mexico Precious Metals Market Volume (K Tons) Forecast, by Application 2019 & 2032
- Table 91: Global Precious Metals Market Revenue Billion Forecast, by Type 2019 & 2032
- Table 92: Global Precious Metals Market Volume K Tons Forecast, by Type 2019 & 2032
- Table 93: Global Precious Metals Market Revenue Billion Forecast, by Application 2019 & 2032
- Table 94: Global Precious Metals Market Volume K Tons Forecast, by Application 2019 & 2032
- Table 95: Global Precious Metals Market Revenue Billion Forecast, by Country 2019 & 2032
- Table 96: Global Precious Metals Market Volume K Tons Forecast, by Country 2019 & 2032
- Table 97: Germany Precious Metals Market Revenue (Billion) Forecast, by Application 2019 & 2032
- Table 98: Germany Precious Metals Market Volume (K Tons) Forecast, by Application 2019 & 2032
- Table 99: United Kingdom Precious Metals Market Revenue (Billion) Forecast, by Application 2019 & 2032
- Table 100: United Kingdom Precious Metals Market Volume (K Tons) Forecast, by Application 2019 & 2032
- Table 101: Italy Precious Metals Market Revenue (Billion) Forecast, by Application 2019 & 2032
- Table 102: Italy Precious Metals Market Volume (K Tons) Forecast, by Application 2019 & 2032
- Table 103: France Precious Metals Market Revenue (Billion) Forecast, by Application 2019 & 2032
- Table 104: France Precious Metals Market Volume (K Tons) Forecast, by Application 2019 & 2032
- Table 105: Rest of Europe Precious Metals Market Revenue (Billion) Forecast, by Application 2019 & 2032
- Table 106: Rest of Europe Precious Metals Market Volume (K Tons) Forecast, by Application 2019 & 2032
- Table 107: Global Precious Metals Market Revenue Billion Forecast, by Type 2019 & 2032
- Table 108: Global Precious Metals Market Volume K Tons Forecast, by Type 2019 & 2032
- Table 109: Global Precious Metals Market Revenue Billion Forecast, by Application 2019 & 2032
- Table 110: Global Precious Metals Market Volume K Tons Forecast, by Application 2019 & 2032
- Table 111: Global Precious Metals Market Revenue Billion Forecast, by Country 2019 & 2032
- Table 112: Global Precious Metals Market Volume K Tons Forecast, by Country 2019 & 2032
- Table 113: Brazil Precious Metals Market Revenue (Billion) Forecast, by Application 2019 & 2032
- Table 114: Brazil Precious Metals Market Volume (K Tons) Forecast, by Application 2019 & 2032
- Table 115: Argentina Precious Metals Market Revenue (Billion) Forecast, by Application 2019 & 2032
- Table 116: Argentina Precious Metals Market Volume (K Tons) Forecast, by Application 2019 & 2032
- Table 117: Rest of South America Precious Metals Market Revenue (Billion) Forecast, by Application 2019 & 2032
- Table 118: Rest of South America Precious Metals Market Volume (K Tons) Forecast, by Application 2019 & 2032
- Table 119: Global Precious Metals Market Revenue Billion Forecast, by Type 2019 & 2032
- Table 120: Global Precious Metals Market Volume K Tons Forecast, by Type 2019 & 2032
- Table 121: Global Precious Metals Market Revenue Billion Forecast, by Application 2019 & 2032
- Table 122: Global Precious Metals Market Volume K Tons Forecast, by Application 2019 & 2032
- Table 123: Global Precious Metals Market Revenue Billion Forecast, by Country 2019 & 2032
- Table 124: Global Precious Metals Market Volume K Tons Forecast, by Country 2019 & 2032
- Table 125: Saudi Arabia Precious Metals Market Revenue (Billion) Forecast, by Application 2019 & 2032
- Table 126: Saudi Arabia Precious Metals Market Volume (K Tons) Forecast, by Application 2019 & 2032
- Table 127: South Africa Precious Metals Market Revenue (Billion) Forecast, by Application 2019 & 2032
- Table 128: South Africa Precious Metals Market Volume (K Tons) Forecast, by Application 2019 & 2032
- Table 129: Rest of Middle East and Africa Precious Metals Market Revenue (Billion) Forecast, by Application 2019 & 2032
- Table 130: Rest of Middle East and Africa Precious Metals Market Volume (K Tons) Forecast, by Application 2019 & 2032
Frequently Asked Questions
1. What is the projected Compound Annual Growth Rate (CAGR) of the Precious Metals Market?
The projected CAGR is approximately 5.5%.
2. Which companies are prominent players in the Precious Metals Market?
Key companies in the market include Heraeus Holding, Shaanxi kaida chemical co LTD, Clariant, Kaili Catalyst New Materials CO LTD, Umicore Galvanotechnik GmbH, American Elements, CHIMET, Evonik Industries AG, Sabin Metal Corporation, Souvenier Chemicals, ReMetall Deutschland AG, BASF SE, Stanford Advanced Materials, Catalytic Products International, J&J Materials Inc, Alfa Aesar Thermo Fisher Scientific, Johnson Matthey, ALS Limited.
3. What are the main segments of the Precious Metals Market?
The market segments include Type, Application.
4. Can you provide details about the market size?
The market size is estimated to be USD 306.4 Billion as of 2022.
5. What are some drivers contributing to market growth?
Accelerating Demand for High-Performance Transportation Fuel; Increasing Investment in Refineries; Other Drivers.
6. What are the notable trends driving market growth?
Automotive Segment to Dominate the Market.
7. Are there any restraints impacting market growth?
High Production Costs; Other Restraints.
8. Can you provide examples of recent developments in the market?
Recent developments in the market studied will be covered in the final report.
9. What pricing options are available for accessing the report?
Pricing options include single-user, multi-user, and enterprise licenses priced at USD 4750, USD 5250, and USD 8750 respectively.
10. Is the market size provided in terms of value or volume?
The market size is provided in terms of value, measured in Billion and volume, measured in K Tons.
11. Are there any specific market keywords associated with the report?
Yes, the market keyword associated with the report is "Precious Metals Market," which aids in identifying and referencing the specific market segment covered.
12. How do I determine which pricing option suits my needs best?
The pricing options vary based on user requirements and access needs. Individual users may opt for single-user licenses, while businesses requiring broader access may choose multi-user or enterprise licenses for cost-effective access to the report.
13. Are there any additional resources or data provided in the Precious Metals Market report?
While the report offers comprehensive insights, it's advisable to review the specific contents or supplementary materials provided to ascertain if additional resources or data are available.
14. How can I stay updated on further developments or reports in the Precious Metals Market?
To stay informed about further developments, trends, and reports in the Precious Metals Market, consider subscribing to industry newsletters, following relevant companies and organizations, or regularly checking reputable industry news sources and publications.
Methodology
Step 1 - Identification of Relevant Samples Size from Population Database


Step 2 - Approaches for Defining Global Market Size (Value, Volume* & Price*)

Note*: In applicable scenarios
Step 3 - Data Sources
Primary Research
- Web Analytics
- Survey Reports
- Research Institute
- Latest Research Reports
- Opinion Leaders
Secondary Research
- Annual Reports
- White Paper
- Latest Press Release
- Industry Association
- Paid Database
- Investor Presentations

Step 4 - Data Triangulation
Involves using different sources of information in order to increase the validity of a study
These sources are likely to be stakeholders in a program - participants, other researchers, program staff, other community members, and so on.
Then we put all data in single framework & apply various statistical tools to find out the dynamic on the market.
During the analysis stage, feedback from the stakeholder groups would be compared to determine areas of agreement as well as areas of divergence
