

Key Insights
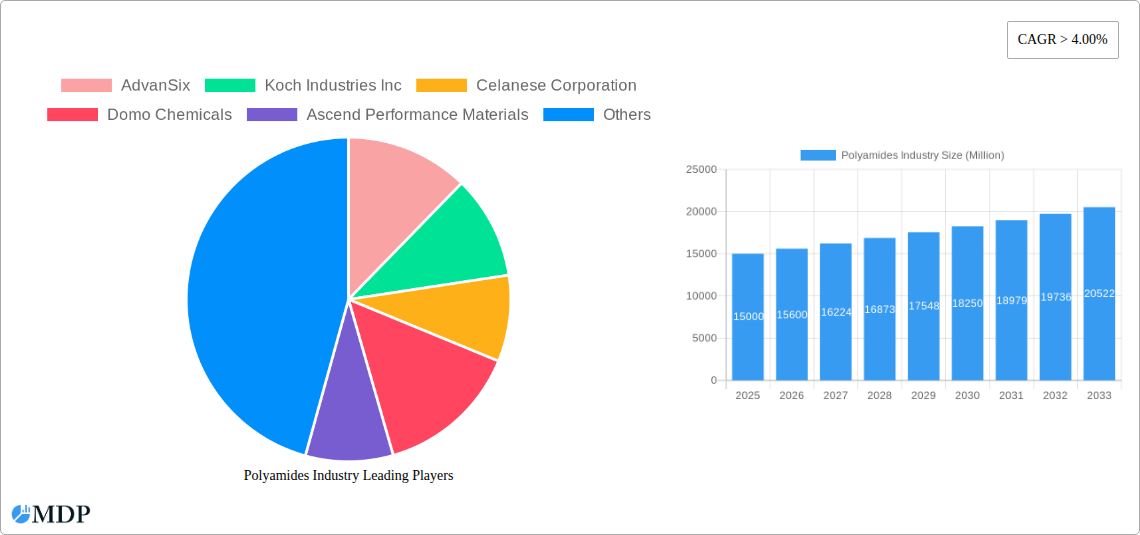
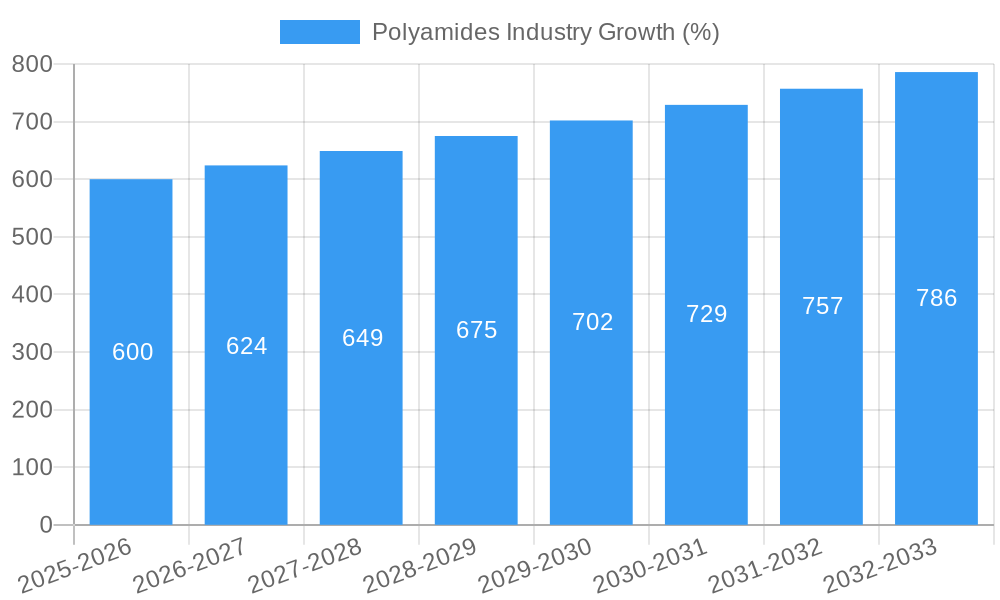
The global polyamides market is experiencing robust growth, driven by increasing demand across diverse end-use industries. The market, valued at approximately $15 billion in 2025, is projected to exhibit a compound annual growth rate (CAGR) exceeding 4% from 2025 to 2033. This expansion is fueled by several key factors. The automotive sector's reliance on polyamides for lightweighting initiatives, enhancing fuel efficiency and vehicle performance, is a significant contributor. Similarly, the burgeoning electronics and electrical industries leverage polyamides for their exceptional insulation and durability properties in various components. The building and construction sector also presents a significant growth avenue, with polyamides increasingly used in high-performance materials for infrastructure and construction applications. Furthermore, the packaging industry’s demand for lightweight, high-strength, and barrier-resistant materials is driving adoption of specific polyamide types. While potential raw material price fluctuations and environmental concerns related to production processes present challenges, ongoing research and development efforts focused on sustainable manufacturing practices and innovative polyamide formulations are mitigating these restraints. The market is segmented by end-user industry (aerospace, automotive, building and construction, electrical and electronics, industrial and machinery, packaging, other end-user industries) and sub-resin type (aramid, polyamide (PA), polyphthalamide). Major players like AdvanSix, Koch Industries Inc., Celanese Corporation, and BASF SE are strategically positioning themselves to capitalize on the market's growth trajectory through expansion, innovation, and strategic partnerships.
The competitive landscape is marked by both established players and emerging regional manufacturers, particularly in Asia. This dynamic competition is fostering innovation in polyamide formulations, leading to the development of specialized materials with enhanced properties. Future growth will be largely shaped by advancements in material science, sustainable manufacturing practices, and the increasing adoption of high-performance polyamides in next-generation technologies across diverse industries. The market's continued growth relies on the ability of manufacturers to address environmental concerns, maintain cost competitiveness, and consistently deliver high-quality, innovative polyamide solutions that cater to the evolving needs of their customers. The forecast period from 2025-2033 promises sustained expansion, making the polyamides market a compelling sector for investment and strategic engagement.
Polyamides Industry Market Report: 2019-2033
This comprehensive report provides a detailed analysis of the global polyamides industry, covering market dynamics, leading players, technological advancements, and future growth prospects. The study period spans from 2019 to 2033, with a base year of 2025 and a forecast period from 2025 to 2033. The report offers actionable insights for industry stakeholders, including manufacturers, investors, and researchers. The global polyamides market is projected to reach xx Million by 2033, exhibiting a CAGR of xx% during the forecast period.
Polyamides Industry Market Dynamics & Concentration
The global polyamides market is characterized by moderate concentration, with several major players holding significant market share. AdvanSix, Koch Industries Inc, Celanese Corporation, Domo Chemicals, Ascend Performance Materials, LANXESS, Highsun Holding Group, BASF SE, LIBOLO, and Hangzhou Juheshun New Materials Co Ltd are key industry participants. Market share dynamics are influenced by factors such as innovation, acquisitions, and regulatory changes. The market witnessed xx M&A deals between 2019 and 2024, indicating a trend towards consolidation. Innovation in sustainable polyamides and advancements in material properties are key drivers. Stringent regulatory frameworks related to environmental impact and product safety also shape industry practices. Product substitutes, such as other polymers, pose a competitive challenge. End-user trends, particularly in the automotive and electronics sectors, significantly influence demand.
- Market Concentration: Moderate, with top 10 players holding approximately xx% market share (2024).
- M&A Activity: xx deals between 2019 and 2024.
- Key Innovation Drivers: Sustainable polyamides, improved material properties.
- Regulatory Frameworks: Focus on environmental impact and product safety.
- Product Substitutes: Other polymers.
- End-User Trends: Growth in automotive and electronics sectors.
Polyamides Industry Industry Trends & Analysis
The polyamides industry is experiencing robust growth driven by rising demand across diverse end-use sectors. Technological advancements, particularly in high-performance polyamides, are fueling innovation. Consumer preferences for lightweight, durable, and sustainable materials are also shaping market trends. Competitive dynamics are characterized by continuous product development, capacity expansions, and strategic partnerships. The automotive sector is a major driver of growth, with the increasing adoption of polyamides in lightweight vehicle components. The electronics industry is another significant contributor, with polyamides utilized in various applications. The market exhibits a CAGR of xx% (2025-2033), with a market penetration of xx% in key segments by 2033.
Leading Markets & Segments in Polyamides Industry
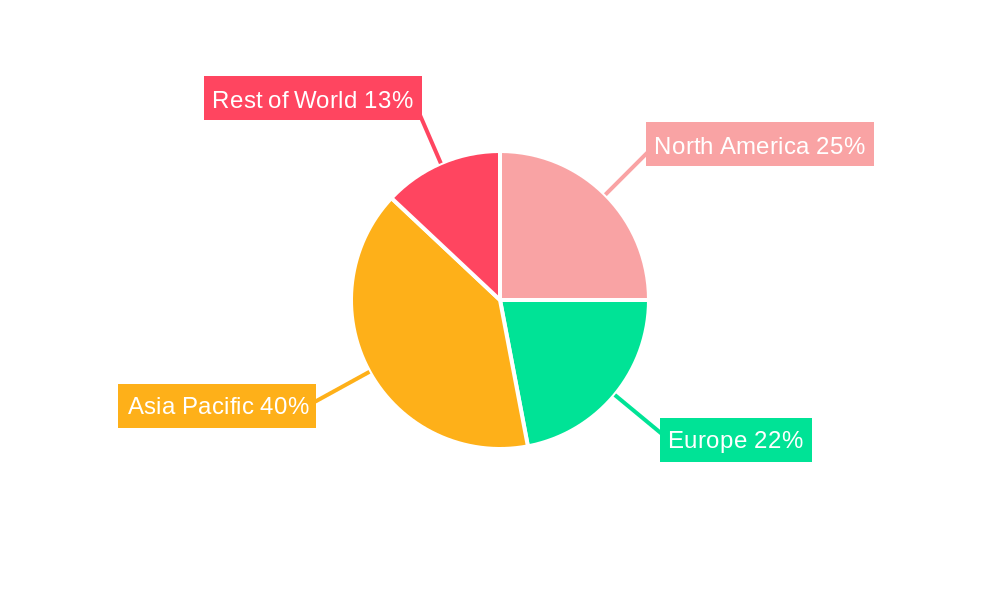
The automotive segment dominates the polyamides market, followed by the electrical and electronics sector. Geographically, Asia-Pacific is the leading region due to rapid industrialization and strong automotive production. Within Asia-Pacific, China and India are major markets. Europe and North America also contribute significantly. Key drivers for each segment include:
- Automotive: Lightweighting regulations, rising vehicle production.
- Electrical & Electronics: Growing demand for high-performance electronics.
- Building & Construction: Increasing use in pipes, fittings, and other applications.
- Packaging: Demand for flexible and durable packaging materials.
- Polyamide (PA): Largest share of the sub-resin type market.
- Aramid: High-growth segment due to its high strength properties.
The dominance of these segments is driven by factors such as favorable government policies, robust infrastructure development, and increasing consumer spending.
Polyamides Industry Product Developments
Recent product innovations focus on high-performance polyamides with enhanced properties like improved heat resistance, durability, and chemical resistance. These materials find applications in demanding environments such as aerospace, automotive, and electronics. Competitive advantages are achieved through improved processing characteristics, enhanced sustainability profiles (e.g., recycled content), and specialized functionalities (e.g., flame retardancy). The industry is witnessing a shift towards bio-based and recycled polyamides.
Key Drivers of Polyamides Industry Growth
Several factors drive the growth of the polyamides market: Technological advancements, including the development of high-performance grades, are increasing the range of applications. Economic growth in developing countries fuels demand for automobiles and consumer goods. Government regulations promoting lightweighting and sustainable materials further stimulate growth. For instance, the growing automotive sector's demand for lightweight materials significantly contributes to the polyamides market's expansion.
Challenges in the Polyamides Industry Market
The polyamides industry faces several challenges. Fluctuations in raw material prices, particularly oil prices, impact profitability. Supply chain disruptions can affect production and delivery. Intense competition from other materials, such as alternative polymers, necessitates continuous innovation. Stringent environmental regulations add to the cost burden. These challenges collectively impact the industry's overall growth potential, potentially decreasing it by xx% if not effectively managed.
Emerging Opportunities in Polyamides Industry
The polyamides industry presents promising growth opportunities. Technological breakthroughs in bio-based polyamides and recycling technologies open avenues for sustainable product development. Strategic partnerships and collaborations facilitate access to new markets and technologies. Market expansion into developing economies with robust infrastructure projects offer significant growth potential.
Leading Players in the Polyamides Industry Sector
- AdvanSix
- Koch Industries Inc
- Celanese Corporation
- Domo Chemicals
- Ascend Performance Materials
- LANXESS
- Highsun Holding Group
- BASF SE
- LIBOLO
- Hangzhou Juheshun New Materials Co Ltd
Key Milestones in Polyamides Industry Industry
- July 2022: BASF SE announced plans to expand its ultramid polyamide grade production capacity in India.
- September 2022: LANXESS introduced a sustainable polyamide resin, Durethan ECO.
- November 2022: Celanese Corporation completed the acquisition of DuPont's Mobility & Materials business.
Strategic Outlook for Polyamides Industry Market
The polyamides market holds significant long-term growth potential, driven by continuous technological advancements, expanding applications, and increasing demand from key end-use sectors. Strategic opportunities exist in developing sustainable solutions, strengthening supply chain resilience, and forging strategic alliances to capitalize on emerging market trends and gain competitive advantage. Focus on innovation in high-performance and bio-based polyamides will be crucial for future success.
Polyamides Industry Segmentation
-
1. End User Industry
- 1.1. Aerospace
- 1.2. Automotive
- 1.3. Building and Construction
- 1.4. Electrical and Electronics
- 1.5. Industrial and Machinery
- 1.6. Packaging
- 1.7. Other End-user Industries
-
2. Sub Resin Type
- 2.1. Aramid
- 2.2. Polyamide (PA) 6
- 2.3. Polyamide (PA) 66
- 2.4. Polyphthalamide
Polyamides Industry Segmentation By Geography
-
1. North America
- 1.1. United States
- 1.2. Canada
- 1.3. Mexico
-
2. South America
- 2.1. Brazil
- 2.2. Argentina
- 2.3. Rest of South America
-
3. Europe
- 3.1. United Kingdom
- 3.2. Germany
- 3.3. France
- 3.4. Italy
- 3.5. Spain
- 3.6. Russia
- 3.7. Benelux
- 3.8. Nordics
- 3.9. Rest of Europe
-
4. Middle East & Africa
- 4.1. Turkey
- 4.2. Israel
- 4.3. GCC
- 4.4. North Africa
- 4.5. South Africa
- 4.6. Rest of Middle East & Africa
-
5. Asia Pacific
- 5.1. China
- 5.2. India
- 5.3. Japan
- 5.4. South Korea
- 5.5. ASEAN
- 5.6. Oceania
- 5.7. Rest of Asia Pacific
Polyamides Industry REPORT HIGHLIGHTS
| Aspects | Details |
|---|---|
| Study Period | 2019-2033 |
| Base Year | 2024 |
| Estimated Year | 2025 |
| Forecast Period | 2025-2033 |
| Historical Period | 2019-2024 |
| Growth Rate | CAGR of > 4.00% from 2019-2033 |
| Segmentation |
|
Table of Contents
- 1. Introduction
- 1.1. Research Scope
- 1.2. Market Segmentation
- 1.3. Research Methodology
- 1.4. Definitions and Assumptions
- 2. Executive Summary
- 2.1. Introduction
- 3. Market Dynamics
- 3.1. Introduction
- 3.2. Market Drivers
- 3.2.1. Rapidly Growing Demand from the Poultry Industry; Increased Intake of Human Nutritional Supplements; Other Drivers
- 3.3. Market Restrains
- 3.3.1. Outbreak of Animal Diseases; Other Restraints
- 3.4. Market Trends
- 3.4.1. shift toward innovation and sustainability
- 4. Market Factor Analysis
- 4.1. Porters Five Forces
- 4.2. Supply/Value Chain
- 4.3. PESTEL analysis
- 4.4. Market Entropy
- 4.5. Patent/Trademark Analysis
- 5. Global Polyamides Industry Analysis, Insights and Forecast, 2019-2031
- 5.1. Market Analysis, Insights and Forecast - by End User Industry
- 5.1.1. Aerospace
- 5.1.2. Automotive
- 5.1.3. Building and Construction
- 5.1.4. Electrical and Electronics
- 5.1.5. Industrial and Machinery
- 5.1.6. Packaging
- 5.1.7. Other End-user Industries
- 5.2. Market Analysis, Insights and Forecast - by Sub Resin Type
- 5.2.1. Aramid
- 5.2.2. Polyamide (PA) 6
- 5.2.3. Polyamide (PA) 66
- 5.2.4. Polyphthalamide
- 5.3. Market Analysis, Insights and Forecast - by Region
- 5.3.1. North America
- 5.3.2. South America
- 5.3.3. Europe
- 5.3.4. Middle East & Africa
- 5.3.5. Asia Pacific
- 5.1. Market Analysis, Insights and Forecast - by End User Industry
- 6. North America Polyamides Industry Analysis, Insights and Forecast, 2019-2031
- 6.1. Market Analysis, Insights and Forecast - by End User Industry
- 6.1.1. Aerospace
- 6.1.2. Automotive
- 6.1.3. Building and Construction
- 6.1.4. Electrical and Electronics
- 6.1.5. Industrial and Machinery
- 6.1.6. Packaging
- 6.1.7. Other End-user Industries
- 6.2. Market Analysis, Insights and Forecast - by Sub Resin Type
- 6.2.1. Aramid
- 6.2.2. Polyamide (PA) 6
- 6.2.3. Polyamide (PA) 66
- 6.2.4. Polyphthalamide
- 6.1. Market Analysis, Insights and Forecast - by End User Industry
- 7. South America Polyamides Industry Analysis, Insights and Forecast, 2019-2031
- 7.1. Market Analysis, Insights and Forecast - by End User Industry
- 7.1.1. Aerospace
- 7.1.2. Automotive
- 7.1.3. Building and Construction
- 7.1.4. Electrical and Electronics
- 7.1.5. Industrial and Machinery
- 7.1.6. Packaging
- 7.1.7. Other End-user Industries
- 7.2. Market Analysis, Insights and Forecast - by Sub Resin Type
- 7.2.1. Aramid
- 7.2.2. Polyamide (PA) 6
- 7.2.3. Polyamide (PA) 66
- 7.2.4. Polyphthalamide
- 7.1. Market Analysis, Insights and Forecast - by End User Industry
- 8. Europe Polyamides Industry Analysis, Insights and Forecast, 2019-2031
- 8.1. Market Analysis, Insights and Forecast - by End User Industry
- 8.1.1. Aerospace
- 8.1.2. Automotive
- 8.1.3. Building and Construction
- 8.1.4. Electrical and Electronics
- 8.1.5. Industrial and Machinery
- 8.1.6. Packaging
- 8.1.7. Other End-user Industries
- 8.2. Market Analysis, Insights and Forecast - by Sub Resin Type
- 8.2.1. Aramid
- 8.2.2. Polyamide (PA) 6
- 8.2.3. Polyamide (PA) 66
- 8.2.4. Polyphthalamide
- 8.1. Market Analysis, Insights and Forecast - by End User Industry
- 9. Middle East & Africa Polyamides Industry Analysis, Insights and Forecast, 2019-2031
- 9.1. Market Analysis, Insights and Forecast - by End User Industry
- 9.1.1. Aerospace
- 9.1.2. Automotive
- 9.1.3. Building and Construction
- 9.1.4. Electrical and Electronics
- 9.1.5. Industrial and Machinery
- 9.1.6. Packaging
- 9.1.7. Other End-user Industries
- 9.2. Market Analysis, Insights and Forecast - by Sub Resin Type
- 9.2.1. Aramid
- 9.2.2. Polyamide (PA) 6
- 9.2.3. Polyamide (PA) 66
- 9.2.4. Polyphthalamide
- 9.1. Market Analysis, Insights and Forecast - by End User Industry
- 10. Asia Pacific Polyamides Industry Analysis, Insights and Forecast, 2019-2031
- 10.1. Market Analysis, Insights and Forecast - by End User Industry
- 10.1.1. Aerospace
- 10.1.2. Automotive
- 10.1.3. Building and Construction
- 10.1.4. Electrical and Electronics
- 10.1.5. Industrial and Machinery
- 10.1.6. Packaging
- 10.1.7. Other End-user Industries
- 10.2. Market Analysis, Insights and Forecast - by Sub Resin Type
- 10.2.1. Aramid
- 10.2.2. Polyamide (PA) 6
- 10.2.3. Polyamide (PA) 66
- 10.2.4. Polyphthalamide
- 10.1. Market Analysis, Insights and Forecast - by End User Industry
- 11. Competitive Analysis
- 11.1. Global Market Share Analysis 2024
- 11.2. Company Profiles
- 11.2.1 AdvanSix
- 11.2.1.1. Overview
- 11.2.1.2. Products
- 11.2.1.3. SWOT Analysis
- 11.2.1.4. Recent Developments
- 11.2.1.5. Financials (Based on Availability)
- 11.2.2 Koch Industries Inc
- 11.2.2.1. Overview
- 11.2.2.2. Products
- 11.2.2.3. SWOT Analysis
- 11.2.2.4. Recent Developments
- 11.2.2.5. Financials (Based on Availability)
- 11.2.3 Celanese Corporation
- 11.2.3.1. Overview
- 11.2.3.2. Products
- 11.2.3.3. SWOT Analysis
- 11.2.3.4. Recent Developments
- 11.2.3.5. Financials (Based on Availability)
- 11.2.4 Domo Chemicals
- 11.2.4.1. Overview
- 11.2.4.2. Products
- 11.2.4.3. SWOT Analysis
- 11.2.4.4. Recent Developments
- 11.2.4.5. Financials (Based on Availability)
- 11.2.5 Ascend Performance Materials
- 11.2.5.1. Overview
- 11.2.5.2. Products
- 11.2.5.3. SWOT Analysis
- 11.2.5.4. Recent Developments
- 11.2.5.5. Financials (Based on Availability)
- 11.2.6 LANXESS
- 11.2.6.1. Overview
- 11.2.6.2. Products
- 11.2.6.3. SWOT Analysis
- 11.2.6.4. Recent Developments
- 11.2.6.5. Financials (Based on Availability)
- 11.2.7 Highsun Holding Group
- 11.2.7.1. Overview
- 11.2.7.2. Products
- 11.2.7.3. SWOT Analysis
- 11.2.7.4. Recent Developments
- 11.2.7.5. Financials (Based on Availability)
- 11.2.8 BASF SE
- 11.2.8.1. Overview
- 11.2.8.2. Products
- 11.2.8.3. SWOT Analysis
- 11.2.8.4. Recent Developments
- 11.2.8.5. Financials (Based on Availability)
- 11.2.9 LIBOLO
- 11.2.9.1. Overview
- 11.2.9.2. Products
- 11.2.9.3. SWOT Analysis
- 11.2.9.4. Recent Developments
- 11.2.9.5. Financials (Based on Availability)
- 11.2.10 Hangzhou Juheshun New Materials Co Ltd
- 11.2.10.1. Overview
- 11.2.10.2. Products
- 11.2.10.3. SWOT Analysis
- 11.2.10.4. Recent Developments
- 11.2.10.5. Financials (Based on Availability)
- 11.2.1 AdvanSix
List of Figures
- Figure 1: Global Polyamides Industry Revenue Breakdown (Million, %) by Region 2024 & 2032
- Figure 2: Global Polyamides Industry Volume Breakdown (K Tons, %) by Region 2024 & 2032
- Figure 3: North America Polyamides Industry Revenue (Million), by End User Industry 2024 & 2032
- Figure 4: North America Polyamides Industry Volume (K Tons), by End User Industry 2024 & 2032
- Figure 5: North America Polyamides Industry Revenue Share (%), by End User Industry 2024 & 2032
- Figure 6: North America Polyamides Industry Volume Share (%), by End User Industry 2024 & 2032
- Figure 7: North America Polyamides Industry Revenue (Million), by Sub Resin Type 2024 & 2032
- Figure 8: North America Polyamides Industry Volume (K Tons), by Sub Resin Type 2024 & 2032
- Figure 9: North America Polyamides Industry Revenue Share (%), by Sub Resin Type 2024 & 2032
- Figure 10: North America Polyamides Industry Volume Share (%), by Sub Resin Type 2024 & 2032
- Figure 11: North America Polyamides Industry Revenue (Million), by Country 2024 & 2032
- Figure 12: North America Polyamides Industry Volume (K Tons), by Country 2024 & 2032
- Figure 13: North America Polyamides Industry Revenue Share (%), by Country 2024 & 2032
- Figure 14: North America Polyamides Industry Volume Share (%), by Country 2024 & 2032
- Figure 15: South America Polyamides Industry Revenue (Million), by End User Industry 2024 & 2032
- Figure 16: South America Polyamides Industry Volume (K Tons), by End User Industry 2024 & 2032
- Figure 17: South America Polyamides Industry Revenue Share (%), by End User Industry 2024 & 2032
- Figure 18: South America Polyamides Industry Volume Share (%), by End User Industry 2024 & 2032
- Figure 19: South America Polyamides Industry Revenue (Million), by Sub Resin Type 2024 & 2032
- Figure 20: South America Polyamides Industry Volume (K Tons), by Sub Resin Type 2024 & 2032
- Figure 21: South America Polyamides Industry Revenue Share (%), by Sub Resin Type 2024 & 2032
- Figure 22: South America Polyamides Industry Volume Share (%), by Sub Resin Type 2024 & 2032
- Figure 23: South America Polyamides Industry Revenue (Million), by Country 2024 & 2032
- Figure 24: South America Polyamides Industry Volume (K Tons), by Country 2024 & 2032
- Figure 25: South America Polyamides Industry Revenue Share (%), by Country 2024 & 2032
- Figure 26: South America Polyamides Industry Volume Share (%), by Country 2024 & 2032
- Figure 27: Europe Polyamides Industry Revenue (Million), by End User Industry 2024 & 2032
- Figure 28: Europe Polyamides Industry Volume (K Tons), by End User Industry 2024 & 2032
- Figure 29: Europe Polyamides Industry Revenue Share (%), by End User Industry 2024 & 2032
- Figure 30: Europe Polyamides Industry Volume Share (%), by End User Industry 2024 & 2032
- Figure 31: Europe Polyamides Industry Revenue (Million), by Sub Resin Type 2024 & 2032
- Figure 32: Europe Polyamides Industry Volume (K Tons), by Sub Resin Type 2024 & 2032
- Figure 33: Europe Polyamides Industry Revenue Share (%), by Sub Resin Type 2024 & 2032
- Figure 34: Europe Polyamides Industry Volume Share (%), by Sub Resin Type 2024 & 2032
- Figure 35: Europe Polyamides Industry Revenue (Million), by Country 2024 & 2032
- Figure 36: Europe Polyamides Industry Volume (K Tons), by Country 2024 & 2032
- Figure 37: Europe Polyamides Industry Revenue Share (%), by Country 2024 & 2032
- Figure 38: Europe Polyamides Industry Volume Share (%), by Country 2024 & 2032
- Figure 39: Middle East & Africa Polyamides Industry Revenue (Million), by End User Industry 2024 & 2032
- Figure 40: Middle East & Africa Polyamides Industry Volume (K Tons), by End User Industry 2024 & 2032
- Figure 41: Middle East & Africa Polyamides Industry Revenue Share (%), by End User Industry 2024 & 2032
- Figure 42: Middle East & Africa Polyamides Industry Volume Share (%), by End User Industry 2024 & 2032
- Figure 43: Middle East & Africa Polyamides Industry Revenue (Million), by Sub Resin Type 2024 & 2032
- Figure 44: Middle East & Africa Polyamides Industry Volume (K Tons), by Sub Resin Type 2024 & 2032
- Figure 45: Middle East & Africa Polyamides Industry Revenue Share (%), by Sub Resin Type 2024 & 2032
- Figure 46: Middle East & Africa Polyamides Industry Volume Share (%), by Sub Resin Type 2024 & 2032
- Figure 47: Middle East & Africa Polyamides Industry Revenue (Million), by Country 2024 & 2032
- Figure 48: Middle East & Africa Polyamides Industry Volume (K Tons), by Country 2024 & 2032
- Figure 49: Middle East & Africa Polyamides Industry Revenue Share (%), by Country 2024 & 2032
- Figure 50: Middle East & Africa Polyamides Industry Volume Share (%), by Country 2024 & 2032
- Figure 51: Asia Pacific Polyamides Industry Revenue (Million), by End User Industry 2024 & 2032
- Figure 52: Asia Pacific Polyamides Industry Volume (K Tons), by End User Industry 2024 & 2032
- Figure 53: Asia Pacific Polyamides Industry Revenue Share (%), by End User Industry 2024 & 2032
- Figure 54: Asia Pacific Polyamides Industry Volume Share (%), by End User Industry 2024 & 2032
- Figure 55: Asia Pacific Polyamides Industry Revenue (Million), by Sub Resin Type 2024 & 2032
- Figure 56: Asia Pacific Polyamides Industry Volume (K Tons), by Sub Resin Type 2024 & 2032
- Figure 57: Asia Pacific Polyamides Industry Revenue Share (%), by Sub Resin Type 2024 & 2032
- Figure 58: Asia Pacific Polyamides Industry Volume Share (%), by Sub Resin Type 2024 & 2032
- Figure 59: Asia Pacific Polyamides Industry Revenue (Million), by Country 2024 & 2032
- Figure 60: Asia Pacific Polyamides Industry Volume (K Tons), by Country 2024 & 2032
- Figure 61: Asia Pacific Polyamides Industry Revenue Share (%), by Country 2024 & 2032
- Figure 62: Asia Pacific Polyamides Industry Volume Share (%), by Country 2024 & 2032
List of Tables
- Table 1: Global Polyamides Industry Revenue Million Forecast, by Region 2019 & 2032
- Table 2: Global Polyamides Industry Volume K Tons Forecast, by Region 2019 & 2032
- Table 3: Global Polyamides Industry Revenue Million Forecast, by End User Industry 2019 & 2032
- Table 4: Global Polyamides Industry Volume K Tons Forecast, by End User Industry 2019 & 2032
- Table 5: Global Polyamides Industry Revenue Million Forecast, by Sub Resin Type 2019 & 2032
- Table 6: Global Polyamides Industry Volume K Tons Forecast, by Sub Resin Type 2019 & 2032
- Table 7: Global Polyamides Industry Revenue Million Forecast, by Region 2019 & 2032
- Table 8: Global Polyamides Industry Volume K Tons Forecast, by Region 2019 & 2032
- Table 9: Global Polyamides Industry Revenue Million Forecast, by End User Industry 2019 & 2032
- Table 10: Global Polyamides Industry Volume K Tons Forecast, by End User Industry 2019 & 2032
- Table 11: Global Polyamides Industry Revenue Million Forecast, by Sub Resin Type 2019 & 2032
- Table 12: Global Polyamides Industry Volume K Tons Forecast, by Sub Resin Type 2019 & 2032
- Table 13: Global Polyamides Industry Revenue Million Forecast, by Country 2019 & 2032
- Table 14: Global Polyamides Industry Volume K Tons Forecast, by Country 2019 & 2032
- Table 15: United States Polyamides Industry Revenue (Million) Forecast, by Application 2019 & 2032
- Table 16: United States Polyamides Industry Volume (K Tons) Forecast, by Application 2019 & 2032
- Table 17: Canada Polyamides Industry Revenue (Million) Forecast, by Application 2019 & 2032
- Table 18: Canada Polyamides Industry Volume (K Tons) Forecast, by Application 2019 & 2032
- Table 19: Mexico Polyamides Industry Revenue (Million) Forecast, by Application 2019 & 2032
- Table 20: Mexico Polyamides Industry Volume (K Tons) Forecast, by Application 2019 & 2032
- Table 21: Global Polyamides Industry Revenue Million Forecast, by End User Industry 2019 & 2032
- Table 22: Global Polyamides Industry Volume K Tons Forecast, by End User Industry 2019 & 2032
- Table 23: Global Polyamides Industry Revenue Million Forecast, by Sub Resin Type 2019 & 2032
- Table 24: Global Polyamides Industry Volume K Tons Forecast, by Sub Resin Type 2019 & 2032
- Table 25: Global Polyamides Industry Revenue Million Forecast, by Country 2019 & 2032
- Table 26: Global Polyamides Industry Volume K Tons Forecast, by Country 2019 & 2032
- Table 27: Brazil Polyamides Industry Revenue (Million) Forecast, by Application 2019 & 2032
- Table 28: Brazil Polyamides Industry Volume (K Tons) Forecast, by Application 2019 & 2032
- Table 29: Argentina Polyamides Industry Revenue (Million) Forecast, by Application 2019 & 2032
- Table 30: Argentina Polyamides Industry Volume (K Tons) Forecast, by Application 2019 & 2032
- Table 31: Rest of South America Polyamides Industry Revenue (Million) Forecast, by Application 2019 & 2032
- Table 32: Rest of South America Polyamides Industry Volume (K Tons) Forecast, by Application 2019 & 2032
- Table 33: Global Polyamides Industry Revenue Million Forecast, by End User Industry 2019 & 2032
- Table 34: Global Polyamides Industry Volume K Tons Forecast, by End User Industry 2019 & 2032
- Table 35: Global Polyamides Industry Revenue Million Forecast, by Sub Resin Type 2019 & 2032
- Table 36: Global Polyamides Industry Volume K Tons Forecast, by Sub Resin Type 2019 & 2032
- Table 37: Global Polyamides Industry Revenue Million Forecast, by Country 2019 & 2032
- Table 38: Global Polyamides Industry Volume K Tons Forecast, by Country 2019 & 2032
- Table 39: United Kingdom Polyamides Industry Revenue (Million) Forecast, by Application 2019 & 2032
- Table 40: United Kingdom Polyamides Industry Volume (K Tons) Forecast, by Application 2019 & 2032
- Table 41: Germany Polyamides Industry Revenue (Million) Forecast, by Application 2019 & 2032
- Table 42: Germany Polyamides Industry Volume (K Tons) Forecast, by Application 2019 & 2032
- Table 43: France Polyamides Industry Revenue (Million) Forecast, by Application 2019 & 2032
- Table 44: France Polyamides Industry Volume (K Tons) Forecast, by Application 2019 & 2032
- Table 45: Italy Polyamides Industry Revenue (Million) Forecast, by Application 2019 & 2032
- Table 46: Italy Polyamides Industry Volume (K Tons) Forecast, by Application 2019 & 2032
- Table 47: Spain Polyamides Industry Revenue (Million) Forecast, by Application 2019 & 2032
- Table 48: Spain Polyamides Industry Volume (K Tons) Forecast, by Application 2019 & 2032
- Table 49: Russia Polyamides Industry Revenue (Million) Forecast, by Application 2019 & 2032
- Table 50: Russia Polyamides Industry Volume (K Tons) Forecast, by Application 2019 & 2032
- Table 51: Benelux Polyamides Industry Revenue (Million) Forecast, by Application 2019 & 2032
- Table 52: Benelux Polyamides Industry Volume (K Tons) Forecast, by Application 2019 & 2032
- Table 53: Nordics Polyamides Industry Revenue (Million) Forecast, by Application 2019 & 2032
- Table 54: Nordics Polyamides Industry Volume (K Tons) Forecast, by Application 2019 & 2032
- Table 55: Rest of Europe Polyamides Industry Revenue (Million) Forecast, by Application 2019 & 2032
- Table 56: Rest of Europe Polyamides Industry Volume (K Tons) Forecast, by Application 2019 & 2032
- Table 57: Global Polyamides Industry Revenue Million Forecast, by End User Industry 2019 & 2032
- Table 58: Global Polyamides Industry Volume K Tons Forecast, by End User Industry 2019 & 2032
- Table 59: Global Polyamides Industry Revenue Million Forecast, by Sub Resin Type 2019 & 2032
- Table 60: Global Polyamides Industry Volume K Tons Forecast, by Sub Resin Type 2019 & 2032
- Table 61: Global Polyamides Industry Revenue Million Forecast, by Country 2019 & 2032
- Table 62: Global Polyamides Industry Volume K Tons Forecast, by Country 2019 & 2032
- Table 63: Turkey Polyamides Industry Revenue (Million) Forecast, by Application 2019 & 2032
- Table 64: Turkey Polyamides Industry Volume (K Tons) Forecast, by Application 2019 & 2032
- Table 65: Israel Polyamides Industry Revenue (Million) Forecast, by Application 2019 & 2032
- Table 66: Israel Polyamides Industry Volume (K Tons) Forecast, by Application 2019 & 2032
- Table 67: GCC Polyamides Industry Revenue (Million) Forecast, by Application 2019 & 2032
- Table 68: GCC Polyamides Industry Volume (K Tons) Forecast, by Application 2019 & 2032
- Table 69: North Africa Polyamides Industry Revenue (Million) Forecast, by Application 2019 & 2032
- Table 70: North Africa Polyamides Industry Volume (K Tons) Forecast, by Application 2019 & 2032
- Table 71: South Africa Polyamides Industry Revenue (Million) Forecast, by Application 2019 & 2032
- Table 72: South Africa Polyamides Industry Volume (K Tons) Forecast, by Application 2019 & 2032
- Table 73: Rest of Middle East & Africa Polyamides Industry Revenue (Million) Forecast, by Application 2019 & 2032
- Table 74: Rest of Middle East & Africa Polyamides Industry Volume (K Tons) Forecast, by Application 2019 & 2032
- Table 75: Global Polyamides Industry Revenue Million Forecast, by End User Industry 2019 & 2032
- Table 76: Global Polyamides Industry Volume K Tons Forecast, by End User Industry 2019 & 2032
- Table 77: Global Polyamides Industry Revenue Million Forecast, by Sub Resin Type 2019 & 2032
- Table 78: Global Polyamides Industry Volume K Tons Forecast, by Sub Resin Type 2019 & 2032
- Table 79: Global Polyamides Industry Revenue Million Forecast, by Country 2019 & 2032
- Table 80: Global Polyamides Industry Volume K Tons Forecast, by Country 2019 & 2032
- Table 81: China Polyamides Industry Revenue (Million) Forecast, by Application 2019 & 2032
- Table 82: China Polyamides Industry Volume (K Tons) Forecast, by Application 2019 & 2032
- Table 83: India Polyamides Industry Revenue (Million) Forecast, by Application 2019 & 2032
- Table 84: India Polyamides Industry Volume (K Tons) Forecast, by Application 2019 & 2032
- Table 85: Japan Polyamides Industry Revenue (Million) Forecast, by Application 2019 & 2032
- Table 86: Japan Polyamides Industry Volume (K Tons) Forecast, by Application 2019 & 2032
- Table 87: South Korea Polyamides Industry Revenue (Million) Forecast, by Application 2019 & 2032
- Table 88: South Korea Polyamides Industry Volume (K Tons) Forecast, by Application 2019 & 2032
- Table 89: ASEAN Polyamides Industry Revenue (Million) Forecast, by Application 2019 & 2032
- Table 90: ASEAN Polyamides Industry Volume (K Tons) Forecast, by Application 2019 & 2032
- Table 91: Oceania Polyamides Industry Revenue (Million) Forecast, by Application 2019 & 2032
- Table 92: Oceania Polyamides Industry Volume (K Tons) Forecast, by Application 2019 & 2032
- Table 93: Rest of Asia Pacific Polyamides Industry Revenue (Million) Forecast, by Application 2019 & 2032
- Table 94: Rest of Asia Pacific Polyamides Industry Volume (K Tons) Forecast, by Application 2019 & 2032
Frequently Asked Questions
1. What is the projected Compound Annual Growth Rate (CAGR) of the Polyamides Industry?
The projected CAGR is approximately > 4.00%.
2. Which companies are prominent players in the Polyamides Industry?
Key companies in the market include AdvanSix, Koch Industries Inc, Celanese Corporation, Domo Chemicals, Ascend Performance Materials, LANXESS, Highsun Holding Group, BASF SE, LIBOLO, Hangzhou Juheshun New Materials Co Ltd.
3. What are the main segments of the Polyamides Industry?
The market segments include End User Industry, Sub Resin Type.
4. Can you provide details about the market size?
The market size is estimated to be USD XX Million as of 2022.
5. What are some drivers contributing to market growth?
Rapidly Growing Demand from the Poultry Industry; Increased Intake of Human Nutritional Supplements; Other Drivers.
6. What are the notable trends driving market growth?
shift toward innovation and sustainability.
7. Are there any restraints impacting market growth?
Outbreak of Animal Diseases; Other Restraints.
8. Can you provide examples of recent developments in the market?
November 2022: Celanese Corporation completed the acquisition of the Mobility & Materials (“M&M”) business of DuPont. This acquisition enhanced the company's product portfolio of engineered thermoplastics through the addition of well-recognized brands and intellectual properties of DuPont.September 2022: LANXESS introduced a sustainable polyamide resin, Durethan ECO, which consists of recycled fibers made from waste glass to reduce its carbon footprint.July 2022: BASF SE announced plans to expand its ultramid polyamide grade production capacity in India to meet the growing demand from automotive, electrical and electronics, industrial, and consumer goods applications.
9. What pricing options are available for accessing the report?
Pricing options include single-user, multi-user, and enterprise licenses priced at USD 3800, USD 4500, and USD 5800 respectively.
10. Is the market size provided in terms of value or volume?
The market size is provided in terms of value, measured in Million and volume, measured in K Tons.
11. Are there any specific market keywords associated with the report?
Yes, the market keyword associated with the report is "Polyamides Industry," which aids in identifying and referencing the specific market segment covered.
12. How do I determine which pricing option suits my needs best?
The pricing options vary based on user requirements and access needs. Individual users may opt for single-user licenses, while businesses requiring broader access may choose multi-user or enterprise licenses for cost-effective access to the report.
13. Are there any additional resources or data provided in the Polyamides Industry report?
While the report offers comprehensive insights, it's advisable to review the specific contents or supplementary materials provided to ascertain if additional resources or data are available.
14. How can I stay updated on further developments or reports in the Polyamides Industry?
To stay informed about further developments, trends, and reports in the Polyamides Industry, consider subscribing to industry newsletters, following relevant companies and organizations, or regularly checking reputable industry news sources and publications.
Methodology
Step 1 - Identification of Relevant Samples Size from Population Database


Step 2 - Approaches for Defining Global Market Size (Value, Volume* & Price*)

Note*: In applicable scenarios
Step 3 - Data Sources
Primary Research
- Web Analytics
- Survey Reports
- Research Institute
- Latest Research Reports
- Opinion Leaders
Secondary Research
- Annual Reports
- White Paper
- Latest Press Release
- Industry Association
- Paid Database
- Investor Presentations

Step 4 - Data Triangulation
Involves using different sources of information in order to increase the validity of a study
These sources are likely to be stakeholders in a program - participants, other researchers, program staff, other community members, and so on.
Then we put all data in single framework & apply various statistical tools to find out the dynamic on the market.
During the analysis stage, feedback from the stakeholder groups would be compared to determine areas of agreement as well as areas of divergence
