

Key Insights
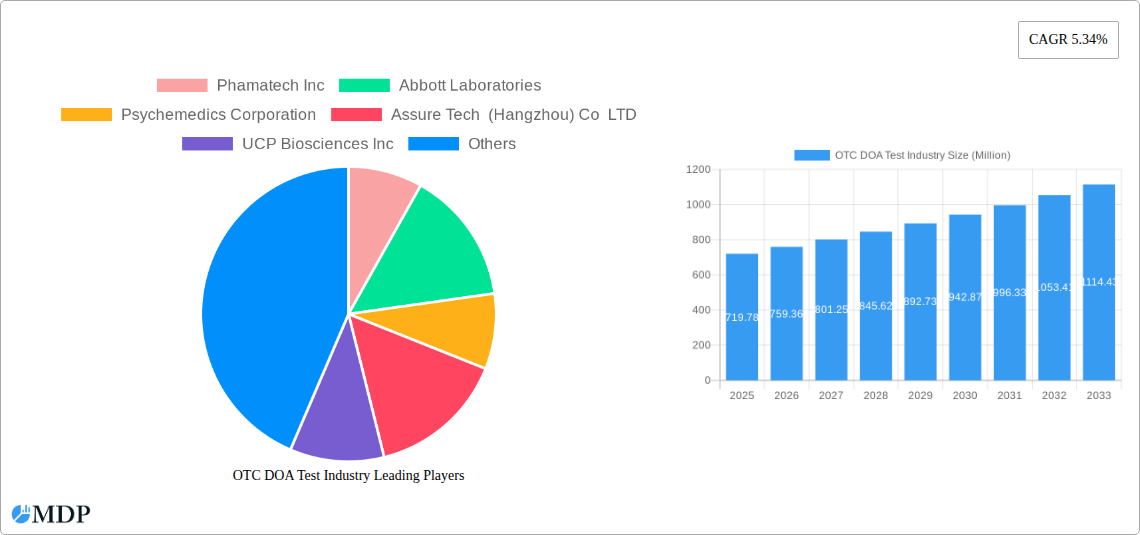
The over-the-counter (OTC) drug of abuse (DOA) testing market, valued at $719.78 million in 2025, is projected to experience robust growth, driven by increasing demand for convenient and readily available drug screening solutions. This growth is fueled by several key factors. Rising concerns about substance abuse in workplaces and among individuals contribute significantly to the market expansion. The increasing prevalence of opioid addiction and other drug-related issues necessitates readily accessible testing options for early detection and intervention. Furthermore, advancements in testing technologies, leading to more accurate, user-friendly, and cost-effective tests, are driving market adoption. The market's segmentation by test type (test cups, test strips, others) and sample type (saliva, urine, blood, others) reflects the diverse needs and preferences of consumers and healthcare providers. The presence of established players like Abbott Laboratories and emerging companies like Assure Tech (Hangzhou) Co LTD indicates a competitive landscape characterized by innovation and expansion into new markets.
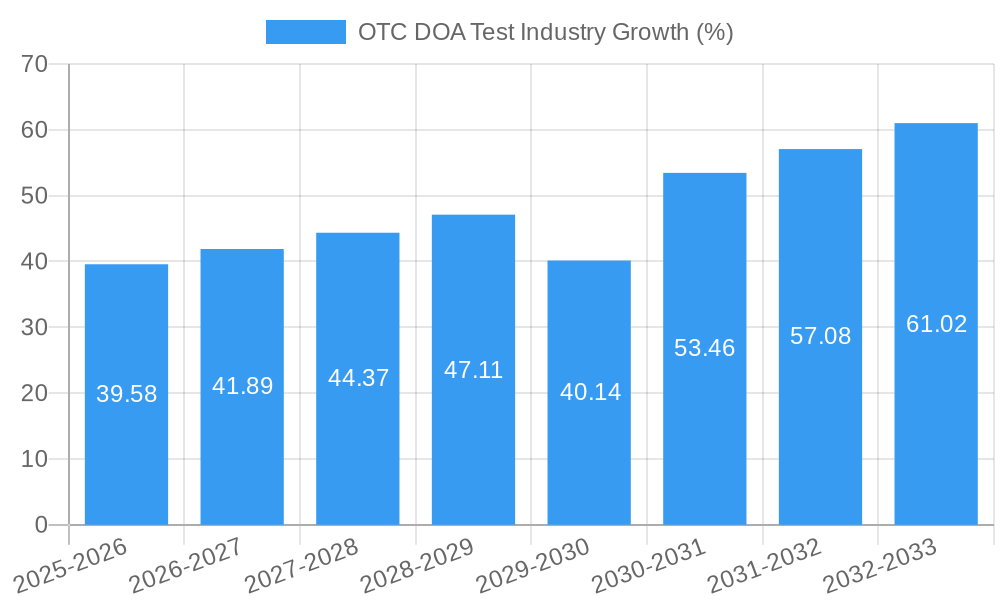
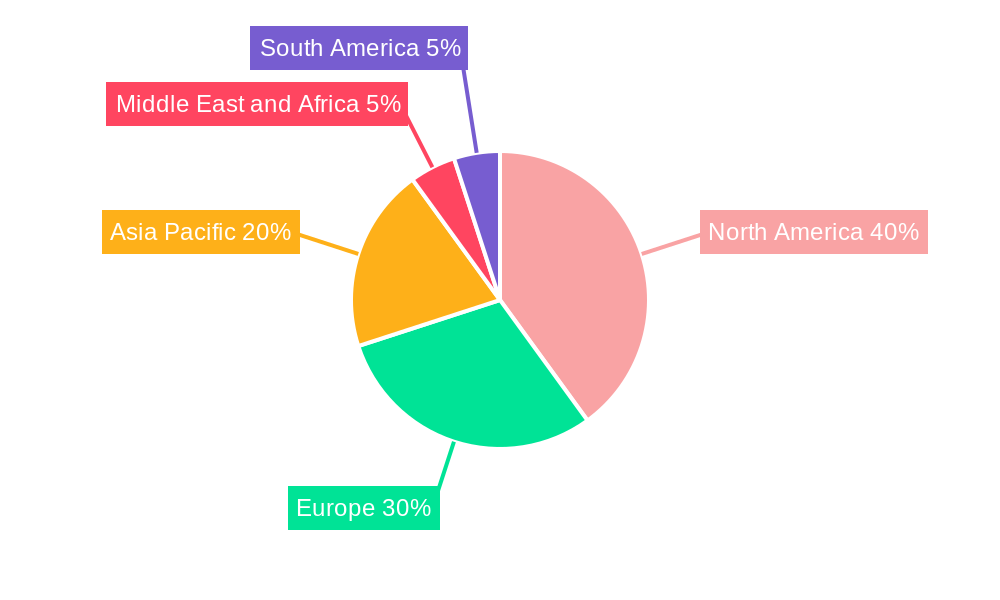
The market's Compound Annual Growth Rate (CAGR) of 5.34% from 2019 to 2024 suggests a continued upward trajectory. Considering the projected growth drivers and the expanding global awareness of substance abuse, a conservative projection for the forecast period (2025-2033) anticipates a steady increase in market value, influenced by geographic expansion, particularly in rapidly developing economies in Asia-Pacific. The regional distribution, with North America likely holding the largest market share initially, is expected to diversify as awareness and affordability improve in other regions. However, regulatory hurdles and potential concerns regarding test accuracy in certain segments could pose challenges to market expansion. The competitive dynamics will continue to shape the market, with companies focusing on product differentiation, technological advancements, and strategic partnerships to gain a competitive edge.
OTC DOA Test Industry Market Report: 2019-2033
This comprehensive report provides an in-depth analysis of the Over-the-Counter (OTC) Drug of Abuse (DOA) Test industry, projecting a market valued at USD XX million by 2033. The report covers the period 2019-2033, with a base year of 2025 and a forecast period of 2025-2033. It examines market dynamics, leading players like Phamatech Inc, Abbott Laboratories, and Psychemedics Corporation, and key industry trends impacting growth. This report is essential for investors, manufacturers, and stakeholders seeking a clear understanding of this rapidly evolving market.
OTC DOA Test Industry Market Dynamics & Concentration
The OTC DOA test market exhibits a moderately concentrated landscape, with a handful of major players controlling a significant market share. While precise market share data for each company remains proprietary, industry estimates suggest that the top five companies hold approximately 60% of the market. This concentration is driven by significant investments in R&D, robust distribution networks, and strong brand recognition. Innovation plays a key role, with companies constantly striving to develop faster, more accurate, and user-friendly tests. Regulatory frameworks, particularly concerning accuracy and labeling requirements, heavily influence market dynamics. The presence of substitute testing methods, such as those used in clinical settings, also creates competitive pressure. End-user trends, particularly increased consumer awareness of substance abuse issues and a growing preference for at-home testing, fuel market growth. M&A activity within the industry has been moderate, with approximately 5-7 significant deals occurring over the past five years. This activity reflects a consolidation trend among players aiming to expand their product portfolios and geographic reach.
- Market Concentration: Moderately concentrated, top 5 players hold ~60% market share (estimated).
- Innovation Drivers: Demand for faster, more accurate, and user-friendly tests.
- Regulatory Frameworks: Stringent regulations on accuracy and labeling.
- Product Substitutes: Clinical laboratory testing methods.
- End-User Trends: Increased consumer awareness and preference for at-home testing.
- M&A Activity: Moderate, approximately 5-7 significant deals in the last five years.
OTC DOA Test Industry Industry Trends & Analysis
The OTC DOA test market is experiencing robust growth, driven by several key factors. The compound annual growth rate (CAGR) from 2025 to 2033 is projected to be approximately XX%, exceeding the overall diagnostics market CAGR. This growth is fueled by increasing consumer awareness of substance abuse, coupled with a rising demand for convenient and readily available testing options. Technological advancements, including the development of more sensitive and specific tests, further contribute to this expansion. Consumer preferences are shifting towards easy-to-use, at-home tests offering rapid results, leading to increased market penetration of saliva and urine-based tests. However, competitive dynamics are intense, with established players and new entrants vying for market share through product innovation and strategic partnerships. The market penetration of OTC DOA tests has increased by approximately XX% in the last five years.
Leading Markets & Segments in OTC DOA Test Industry
The North American market currently dominates the OTC DOA test industry, accounting for approximately XX% of global revenue. This dominance is driven by several factors:
- Economic Factors: High disposable incomes and healthcare spending.
- Regulatory Environment: Relatively favorable regulatory environment for OTC diagnostics.
- Consumer Awareness: High levels of public awareness about substance abuse and mental health.
- Infrastructure: Well-established distribution networks for healthcare products.
Within the product segment, Test Strips hold the largest market share due to their convenience, affordability, and ease of use. Saliva-based tests are also gaining rapid traction, as they provide a non-invasive and convenient method for testing. Other test types and sample types are expected to grow gradually over the forecast period.
OTC DOA Test Industry Product Developments
Recent years have witnessed significant innovation in OTC DOA testing, primarily focused on enhancing accuracy, speed, and user-friendliness. Miniaturization of test devices and development of point-of-care diagnostics using smartphone integration are prominent trends. This technological advancement facilitates broader accessibility and improved results interpretation. Companies are also focusing on developing tests with better sensitivity and specificity, reducing false positive and false negative rates. These innovations cater to the growing demand for reliable and efficient at-home testing solutions.
Key Drivers of OTC DOA Test Industry Growth
Several factors are propelling the growth of the OTC DOA test market. Firstly, advancements in testing technologies are enabling more accurate and rapid results. Secondly, increased awareness of substance abuse disorders and mental health issues is driving consumer demand. Thirdly, favorable regulatory landscapes in certain regions are facilitating market expansion. Finally, the convenience and affordability of at-home testing are attractive to consumers. The HHS funding initiative of USD 58.5 Million in 2022 for contingency management tests in California showcases the growing government support for these initiatives.
Challenges in the OTC DOA Test Industry Market
The OTC DOA test market faces several hurdles. Stringent regulatory approvals can delay product launches, impacting time-to-market. Supply chain disruptions, especially concerning raw materials, can affect production and availability. Finally, intense competition among established and emerging players creates pricing pressure and limits profit margins. The overall market disruption due to these factors is estimated at about XX%.
Emerging Opportunities in OTC DOA Test Industry
The OTC DOA test market presents several promising opportunities. The integration of artificial intelligence (AI) and machine learning (ML) into testing technologies offers significant potential to enhance accuracy and interpretation. Strategic collaborations between testing companies and healthcare providers or telehealth platforms can expand market reach and access. Furthermore, expanding into emerging markets with increasing consumer awareness of substance abuse and affordability offers significant growth potential.
Leading Players in the OTC DOA Test Industry Sector
- Abbott Laboratories
- Psychemedics Corporation
- Assure Tech (Hangzhou) Co LTD
- UCP Biosciences Inc
- Dragerwerk AG & Co KGaA
- Orient New Life Medical Co Ltd
- Confirm BioSciences
- Atlas Medical GmbH
- Phamatech Inc
Key Milestones in OTC DOA Test Industry Industry
- March 2022: Department of Health and Human Services (HHS) offered USD 58.5 million in funding for contingency management tests for stimulant use disorder in California. This significantly boosted market growth and investor confidence.
- October 2021: VeritequeUSA Inc. launched Verifique, its first consumer brand of narcotics and explosives testing kits, signifying increased market penetration beyond law enforcement and government agencies.
Strategic Outlook for OTC DOA Test Industry Market
The OTC DOA test market is poised for continued expansion driven by technological innovation, rising consumer demand, and favorable regulatory developments. Strategic partnerships, particularly with telehealth platforms and healthcare providers, will prove crucial for market penetration. Companies focusing on developing accurate, user-friendly, and affordable tests will enjoy a competitive advantage. Expansion into emerging markets presents a significant growth opportunity. The industry’s future is marked by a greater focus on integrated solutions, advanced diagnostics, and personalized healthcare approaches.
OTC DOA Test Industry Segmentation
-
1. Type
- 1.1. Test Cups
- 1.2. Test Strips
- 1.3. Others
-
2. Sample Type
- 2.1. Saliva
- 2.2. Urine
- 2.3. Blood
- 2.4. Others
OTC DOA Test Industry Segmentation By Geography
-
1. North America
- 1.1. United States
- 1.2. Canada
- 1.3. Mexico
-
2. Europe
- 2.1. Germany
- 2.2. United Kingdom
- 2.3. France
- 2.4. Italy
- 2.5. Spain
- 2.6. Rest of Europe
-
3. Asia Pacific
- 3.1. China
- 3.2. Japan
- 3.3. India
- 3.4. Australia
- 3.5. South Korea
- 3.6. Rest of Asia Pacific
-
4. Middle East and Africa
- 4.1. GCC
- 4.2. South Africa
- 4.3. Rest of Middle East and Africa
-
5. South America
- 5.1. Brazil
- 5.2. Argentina
- 5.3. Rest of South America
OTC DOA Test Industry REPORT HIGHLIGHTS
| Aspects | Details |
|---|---|
| Study Period | 2019-2033 |
| Base Year | 2024 |
| Estimated Year | 2025 |
| Forecast Period | 2025-2033 |
| Historical Period | 2019-2024 |
| Growth Rate | CAGR of 5.34% from 2019-2033 |
| Segmentation |
|
Table of Contents
- 1. Introduction
- 1.1. Research Scope
- 1.2. Market Segmentation
- 1.3. Research Methodology
- 1.4. Definitions and Assumptions
- 2. Executive Summary
- 2.1. Introduction
- 3. Market Dynamics
- 3.1. Introduction
- 3.2. Market Drivers
- 3.2.1. Growing Use and Production of Illicit Drugs; Increasing Initiatives by Governemnt Organizations to Reduce Drug Abuse
- 3.3. Market Restrains
- 3.3.1. Lack of Awareness and Consideration of Drug Testing
- 3.4. Market Trends
- 3.4.1. Test Strip Segment is Expected to Hold a Significant Market Share Over the Forecast Period
- 4. Market Factor Analysis
- 4.1. Porters Five Forces
- 4.2. Supply/Value Chain
- 4.3. PESTEL analysis
- 4.4. Market Entropy
- 4.5. Patent/Trademark Analysis
- 5. Global OTC DOA Test Industry Analysis, Insights and Forecast, 2019-2031
- 5.1. Market Analysis, Insights and Forecast - by Type
- 5.1.1. Test Cups
- 5.1.2. Test Strips
- 5.1.3. Others
- 5.2. Market Analysis, Insights and Forecast - by Sample Type
- 5.2.1. Saliva
- 5.2.2. Urine
- 5.2.3. Blood
- 5.2.4. Others
- 5.3. Market Analysis, Insights and Forecast - by Region
- 5.3.1. North America
- 5.3.2. Europe
- 5.3.3. Asia Pacific
- 5.3.4. Middle East and Africa
- 5.3.5. South America
- 5.1. Market Analysis, Insights and Forecast - by Type
- 6. North America OTC DOA Test Industry Analysis, Insights and Forecast, 2019-2031
- 6.1. Market Analysis, Insights and Forecast - by Type
- 6.1.1. Test Cups
- 6.1.2. Test Strips
- 6.1.3. Others
- 6.2. Market Analysis, Insights and Forecast - by Sample Type
- 6.2.1. Saliva
- 6.2.2. Urine
- 6.2.3. Blood
- 6.2.4. Others
- 6.1. Market Analysis, Insights and Forecast - by Type
- 7. Europe OTC DOA Test Industry Analysis, Insights and Forecast, 2019-2031
- 7.1. Market Analysis, Insights and Forecast - by Type
- 7.1.1. Test Cups
- 7.1.2. Test Strips
- 7.1.3. Others
- 7.2. Market Analysis, Insights and Forecast - by Sample Type
- 7.2.1. Saliva
- 7.2.2. Urine
- 7.2.3. Blood
- 7.2.4. Others
- 7.1. Market Analysis, Insights and Forecast - by Type
- 8. Asia Pacific OTC DOA Test Industry Analysis, Insights and Forecast, 2019-2031
- 8.1. Market Analysis, Insights and Forecast - by Type
- 8.1.1. Test Cups
- 8.1.2. Test Strips
- 8.1.3. Others
- 8.2. Market Analysis, Insights and Forecast - by Sample Type
- 8.2.1. Saliva
- 8.2.2. Urine
- 8.2.3. Blood
- 8.2.4. Others
- 8.1. Market Analysis, Insights and Forecast - by Type
- 9. Middle East and Africa OTC DOA Test Industry Analysis, Insights and Forecast, 2019-2031
- 9.1. Market Analysis, Insights and Forecast - by Type
- 9.1.1. Test Cups
- 9.1.2. Test Strips
- 9.1.3. Others
- 9.2. Market Analysis, Insights and Forecast - by Sample Type
- 9.2.1. Saliva
- 9.2.2. Urine
- 9.2.3. Blood
- 9.2.4. Others
- 9.1. Market Analysis, Insights and Forecast - by Type
- 10. South America OTC DOA Test Industry Analysis, Insights and Forecast, 2019-2031
- 10.1. Market Analysis, Insights and Forecast - by Type
- 10.1.1. Test Cups
- 10.1.2. Test Strips
- 10.1.3. Others
- 10.2. Market Analysis, Insights and Forecast - by Sample Type
- 10.2.1. Saliva
- 10.2.2. Urine
- 10.2.3. Blood
- 10.2.4. Others
- 10.1. Market Analysis, Insights and Forecast - by Type
- 11. North America OTC DOA Test Industry Analysis, Insights and Forecast, 2019-2031
- 11.1. Market Analysis, Insights and Forecast - By Country/Sub-region
- 11.1.1 United States
- 11.1.2 Canada
- 11.1.3 Mexico
- 12. Europe OTC DOA Test Industry Analysis, Insights and Forecast, 2019-2031
- 12.1. Market Analysis, Insights and Forecast - By Country/Sub-region
- 12.1.1 Germany
- 12.1.2 United Kingdom
- 12.1.3 France
- 12.1.4 Italy
- 12.1.5 Spain
- 12.1.6 Rest of Europe
- 13. Asia Pacific OTC DOA Test Industry Analysis, Insights and Forecast, 2019-2031
- 13.1. Market Analysis, Insights and Forecast - By Country/Sub-region
- 13.1.1 China
- 13.1.2 Japan
- 13.1.3 India
- 13.1.4 Australia
- 13.1.5 South Korea
- 13.1.6 Rest of Asia Pacific
- 14. Middle East and Africa OTC DOA Test Industry Analysis, Insights and Forecast, 2019-2031
- 14.1. Market Analysis, Insights and Forecast - By Country/Sub-region
- 14.1.1 GCC
- 14.1.2 South Africa
- 14.1.3 Rest of Middle East and Africa
- 15. South America OTC DOA Test Industry Analysis, Insights and Forecast, 2019-2031
- 15.1. Market Analysis, Insights and Forecast - By Country/Sub-region
- 15.1.1 Brazil
- 15.1.2 Argentina
- 15.1.3 Rest of South America
- 16. Competitive Analysis
- 16.1. Global Market Share Analysis 2024
- 16.2. Company Profiles
- 16.2.1 Phamatech Inc
- 16.2.1.1. Overview
- 16.2.1.2. Products
- 16.2.1.3. SWOT Analysis
- 16.2.1.4. Recent Developments
- 16.2.1.5. Financials (Based on Availability)
- 16.2.2 Abbott Laboratories
- 16.2.2.1. Overview
- 16.2.2.2. Products
- 16.2.2.3. SWOT Analysis
- 16.2.2.4. Recent Developments
- 16.2.2.5. Financials (Based on Availability)
- 16.2.3 Psychemedics Corporation
- 16.2.3.1. Overview
- 16.2.3.2. Products
- 16.2.3.3. SWOT Analysis
- 16.2.3.4. Recent Developments
- 16.2.3.5. Financials (Based on Availability)
- 16.2.4 Assure Tech (Hangzhou) Co LTD
- 16.2.4.1. Overview
- 16.2.4.2. Products
- 16.2.4.3. SWOT Analysis
- 16.2.4.4. Recent Developments
- 16.2.4.5. Financials (Based on Availability)
- 16.2.5 UCP Biosciences Inc
- 16.2.5.1. Overview
- 16.2.5.2. Products
- 16.2.5.3. SWOT Analysis
- 16.2.5.4. Recent Developments
- 16.2.5.5. Financials (Based on Availability)
- 16.2.6 Dragerwerk AG & Co KGaA
- 16.2.6.1. Overview
- 16.2.6.2. Products
- 16.2.6.3. SWOT Analysis
- 16.2.6.4. Recent Developments
- 16.2.6.5. Financials (Based on Availability)
- 16.2.7 Orient New Life Medical Co Ltd
- 16.2.7.1. Overview
- 16.2.7.2. Products
- 16.2.7.3. SWOT Analysis
- 16.2.7.4. Recent Developments
- 16.2.7.5. Financials (Based on Availability)
- 16.2.8 Confirm BioSciences
- 16.2.8.1. Overview
- 16.2.8.2. Products
- 16.2.8.3. SWOT Analysis
- 16.2.8.4. Recent Developments
- 16.2.8.5. Financials (Based on Availability)
- 16.2.9 Atlas Medical GmbH
- 16.2.9.1. Overview
- 16.2.9.2. Products
- 16.2.9.3. SWOT Analysis
- 16.2.9.4. Recent Developments
- 16.2.9.5. Financials (Based on Availability)
- 16.2.1 Phamatech Inc
List of Figures
- Figure 1: Global OTC DOA Test Industry Revenue Breakdown (Million, %) by Region 2024 & 2032
- Figure 2: Global OTC DOA Test Industry Volume Breakdown (K Unit, %) by Region 2024 & 2032
- Figure 3: North America OTC DOA Test Industry Revenue (Million), by Country 2024 & 2032
- Figure 4: North America OTC DOA Test Industry Volume (K Unit), by Country 2024 & 2032
- Figure 5: North America OTC DOA Test Industry Revenue Share (%), by Country 2024 & 2032
- Figure 6: North America OTC DOA Test Industry Volume Share (%), by Country 2024 & 2032
- Figure 7: Europe OTC DOA Test Industry Revenue (Million), by Country 2024 & 2032
- Figure 8: Europe OTC DOA Test Industry Volume (K Unit), by Country 2024 & 2032
- Figure 9: Europe OTC DOA Test Industry Revenue Share (%), by Country 2024 & 2032
- Figure 10: Europe OTC DOA Test Industry Volume Share (%), by Country 2024 & 2032
- Figure 11: Asia Pacific OTC DOA Test Industry Revenue (Million), by Country 2024 & 2032
- Figure 12: Asia Pacific OTC DOA Test Industry Volume (K Unit), by Country 2024 & 2032
- Figure 13: Asia Pacific OTC DOA Test Industry Revenue Share (%), by Country 2024 & 2032
- Figure 14: Asia Pacific OTC DOA Test Industry Volume Share (%), by Country 2024 & 2032
- Figure 15: Middle East and Africa OTC DOA Test Industry Revenue (Million), by Country 2024 & 2032
- Figure 16: Middle East and Africa OTC DOA Test Industry Volume (K Unit), by Country 2024 & 2032
- Figure 17: Middle East and Africa OTC DOA Test Industry Revenue Share (%), by Country 2024 & 2032
- Figure 18: Middle East and Africa OTC DOA Test Industry Volume Share (%), by Country 2024 & 2032
- Figure 19: South America OTC DOA Test Industry Revenue (Million), by Country 2024 & 2032
- Figure 20: South America OTC DOA Test Industry Volume (K Unit), by Country 2024 & 2032
- Figure 21: South America OTC DOA Test Industry Revenue Share (%), by Country 2024 & 2032
- Figure 22: South America OTC DOA Test Industry Volume Share (%), by Country 2024 & 2032
- Figure 23: North America OTC DOA Test Industry Revenue (Million), by Type 2024 & 2032
- Figure 24: North America OTC DOA Test Industry Volume (K Unit), by Type 2024 & 2032
- Figure 25: North America OTC DOA Test Industry Revenue Share (%), by Type 2024 & 2032
- Figure 26: North America OTC DOA Test Industry Volume Share (%), by Type 2024 & 2032
- Figure 27: North America OTC DOA Test Industry Revenue (Million), by Sample Type 2024 & 2032
- Figure 28: North America OTC DOA Test Industry Volume (K Unit), by Sample Type 2024 & 2032
- Figure 29: North America OTC DOA Test Industry Revenue Share (%), by Sample Type 2024 & 2032
- Figure 30: North America OTC DOA Test Industry Volume Share (%), by Sample Type 2024 & 2032
- Figure 31: North America OTC DOA Test Industry Revenue (Million), by Country 2024 & 2032
- Figure 32: North America OTC DOA Test Industry Volume (K Unit), by Country 2024 & 2032
- Figure 33: North America OTC DOA Test Industry Revenue Share (%), by Country 2024 & 2032
- Figure 34: North America OTC DOA Test Industry Volume Share (%), by Country 2024 & 2032
- Figure 35: Europe OTC DOA Test Industry Revenue (Million), by Type 2024 & 2032
- Figure 36: Europe OTC DOA Test Industry Volume (K Unit), by Type 2024 & 2032
- Figure 37: Europe OTC DOA Test Industry Revenue Share (%), by Type 2024 & 2032
- Figure 38: Europe OTC DOA Test Industry Volume Share (%), by Type 2024 & 2032
- Figure 39: Europe OTC DOA Test Industry Revenue (Million), by Sample Type 2024 & 2032
- Figure 40: Europe OTC DOA Test Industry Volume (K Unit), by Sample Type 2024 & 2032
- Figure 41: Europe OTC DOA Test Industry Revenue Share (%), by Sample Type 2024 & 2032
- Figure 42: Europe OTC DOA Test Industry Volume Share (%), by Sample Type 2024 & 2032
- Figure 43: Europe OTC DOA Test Industry Revenue (Million), by Country 2024 & 2032
- Figure 44: Europe OTC DOA Test Industry Volume (K Unit), by Country 2024 & 2032
- Figure 45: Europe OTC DOA Test Industry Revenue Share (%), by Country 2024 & 2032
- Figure 46: Europe OTC DOA Test Industry Volume Share (%), by Country 2024 & 2032
- Figure 47: Asia Pacific OTC DOA Test Industry Revenue (Million), by Type 2024 & 2032
- Figure 48: Asia Pacific OTC DOA Test Industry Volume (K Unit), by Type 2024 & 2032
- Figure 49: Asia Pacific OTC DOA Test Industry Revenue Share (%), by Type 2024 & 2032
- Figure 50: Asia Pacific OTC DOA Test Industry Volume Share (%), by Type 2024 & 2032
- Figure 51: Asia Pacific OTC DOA Test Industry Revenue (Million), by Sample Type 2024 & 2032
- Figure 52: Asia Pacific OTC DOA Test Industry Volume (K Unit), by Sample Type 2024 & 2032
- Figure 53: Asia Pacific OTC DOA Test Industry Revenue Share (%), by Sample Type 2024 & 2032
- Figure 54: Asia Pacific OTC DOA Test Industry Volume Share (%), by Sample Type 2024 & 2032
- Figure 55: Asia Pacific OTC DOA Test Industry Revenue (Million), by Country 2024 & 2032
- Figure 56: Asia Pacific OTC DOA Test Industry Volume (K Unit), by Country 2024 & 2032
- Figure 57: Asia Pacific OTC DOA Test Industry Revenue Share (%), by Country 2024 & 2032
- Figure 58: Asia Pacific OTC DOA Test Industry Volume Share (%), by Country 2024 & 2032
- Figure 59: Middle East and Africa OTC DOA Test Industry Revenue (Million), by Type 2024 & 2032
- Figure 60: Middle East and Africa OTC DOA Test Industry Volume (K Unit), by Type 2024 & 2032
- Figure 61: Middle East and Africa OTC DOA Test Industry Revenue Share (%), by Type 2024 & 2032
- Figure 62: Middle East and Africa OTC DOA Test Industry Volume Share (%), by Type 2024 & 2032
- Figure 63: Middle East and Africa OTC DOA Test Industry Revenue (Million), by Sample Type 2024 & 2032
- Figure 64: Middle East and Africa OTC DOA Test Industry Volume (K Unit), by Sample Type 2024 & 2032
- Figure 65: Middle East and Africa OTC DOA Test Industry Revenue Share (%), by Sample Type 2024 & 2032
- Figure 66: Middle East and Africa OTC DOA Test Industry Volume Share (%), by Sample Type 2024 & 2032
- Figure 67: Middle East and Africa OTC DOA Test Industry Revenue (Million), by Country 2024 & 2032
- Figure 68: Middle East and Africa OTC DOA Test Industry Volume (K Unit), by Country 2024 & 2032
- Figure 69: Middle East and Africa OTC DOA Test Industry Revenue Share (%), by Country 2024 & 2032
- Figure 70: Middle East and Africa OTC DOA Test Industry Volume Share (%), by Country 2024 & 2032
- Figure 71: South America OTC DOA Test Industry Revenue (Million), by Type 2024 & 2032
- Figure 72: South America OTC DOA Test Industry Volume (K Unit), by Type 2024 & 2032
- Figure 73: South America OTC DOA Test Industry Revenue Share (%), by Type 2024 & 2032
- Figure 74: South America OTC DOA Test Industry Volume Share (%), by Type 2024 & 2032
- Figure 75: South America OTC DOA Test Industry Revenue (Million), by Sample Type 2024 & 2032
- Figure 76: South America OTC DOA Test Industry Volume (K Unit), by Sample Type 2024 & 2032
- Figure 77: South America OTC DOA Test Industry Revenue Share (%), by Sample Type 2024 & 2032
- Figure 78: South America OTC DOA Test Industry Volume Share (%), by Sample Type 2024 & 2032
- Figure 79: South America OTC DOA Test Industry Revenue (Million), by Country 2024 & 2032
- Figure 80: South America OTC DOA Test Industry Volume (K Unit), by Country 2024 & 2032
- Figure 81: South America OTC DOA Test Industry Revenue Share (%), by Country 2024 & 2032
- Figure 82: South America OTC DOA Test Industry Volume Share (%), by Country 2024 & 2032
List of Tables
- Table 1: Global OTC DOA Test Industry Revenue Million Forecast, by Region 2019 & 2032
- Table 2: Global OTC DOA Test Industry Volume K Unit Forecast, by Region 2019 & 2032
- Table 3: Global OTC DOA Test Industry Revenue Million Forecast, by Type 2019 & 2032
- Table 4: Global OTC DOA Test Industry Volume K Unit Forecast, by Type 2019 & 2032
- Table 5: Global OTC DOA Test Industry Revenue Million Forecast, by Sample Type 2019 & 2032
- Table 6: Global OTC DOA Test Industry Volume K Unit Forecast, by Sample Type 2019 & 2032
- Table 7: Global OTC DOA Test Industry Revenue Million Forecast, by Region 2019 & 2032
- Table 8: Global OTC DOA Test Industry Volume K Unit Forecast, by Region 2019 & 2032
- Table 9: Global OTC DOA Test Industry Revenue Million Forecast, by Country 2019 & 2032
- Table 10: Global OTC DOA Test Industry Volume K Unit Forecast, by Country 2019 & 2032
- Table 11: United States OTC DOA Test Industry Revenue (Million) Forecast, by Application 2019 & 2032
- Table 12: United States OTC DOA Test Industry Volume (K Unit) Forecast, by Application 2019 & 2032
- Table 13: Canada OTC DOA Test Industry Revenue (Million) Forecast, by Application 2019 & 2032
- Table 14: Canada OTC DOA Test Industry Volume (K Unit) Forecast, by Application 2019 & 2032
- Table 15: Mexico OTC DOA Test Industry Revenue (Million) Forecast, by Application 2019 & 2032
- Table 16: Mexico OTC DOA Test Industry Volume (K Unit) Forecast, by Application 2019 & 2032
- Table 17: Global OTC DOA Test Industry Revenue Million Forecast, by Country 2019 & 2032
- Table 18: Global OTC DOA Test Industry Volume K Unit Forecast, by Country 2019 & 2032
- Table 19: Germany OTC DOA Test Industry Revenue (Million) Forecast, by Application 2019 & 2032
- Table 20: Germany OTC DOA Test Industry Volume (K Unit) Forecast, by Application 2019 & 2032
- Table 21: United Kingdom OTC DOA Test Industry Revenue (Million) Forecast, by Application 2019 & 2032
- Table 22: United Kingdom OTC DOA Test Industry Volume (K Unit) Forecast, by Application 2019 & 2032
- Table 23: France OTC DOA Test Industry Revenue (Million) Forecast, by Application 2019 & 2032
- Table 24: France OTC DOA Test Industry Volume (K Unit) Forecast, by Application 2019 & 2032
- Table 25: Italy OTC DOA Test Industry Revenue (Million) Forecast, by Application 2019 & 2032
- Table 26: Italy OTC DOA Test Industry Volume (K Unit) Forecast, by Application 2019 & 2032
- Table 27: Spain OTC DOA Test Industry Revenue (Million) Forecast, by Application 2019 & 2032
- Table 28: Spain OTC DOA Test Industry Volume (K Unit) Forecast, by Application 2019 & 2032
- Table 29: Rest of Europe OTC DOA Test Industry Revenue (Million) Forecast, by Application 2019 & 2032
- Table 30: Rest of Europe OTC DOA Test Industry Volume (K Unit) Forecast, by Application 2019 & 2032
- Table 31: Global OTC DOA Test Industry Revenue Million Forecast, by Country 2019 & 2032
- Table 32: Global OTC DOA Test Industry Volume K Unit Forecast, by Country 2019 & 2032
- Table 33: China OTC DOA Test Industry Revenue (Million) Forecast, by Application 2019 & 2032
- Table 34: China OTC DOA Test Industry Volume (K Unit) Forecast, by Application 2019 & 2032
- Table 35: Japan OTC DOA Test Industry Revenue (Million) Forecast, by Application 2019 & 2032
- Table 36: Japan OTC DOA Test Industry Volume (K Unit) Forecast, by Application 2019 & 2032
- Table 37: India OTC DOA Test Industry Revenue (Million) Forecast, by Application 2019 & 2032
- Table 38: India OTC DOA Test Industry Volume (K Unit) Forecast, by Application 2019 & 2032
- Table 39: Australia OTC DOA Test Industry Revenue (Million) Forecast, by Application 2019 & 2032
- Table 40: Australia OTC DOA Test Industry Volume (K Unit) Forecast, by Application 2019 & 2032
- Table 41: South Korea OTC DOA Test Industry Revenue (Million) Forecast, by Application 2019 & 2032
- Table 42: South Korea OTC DOA Test Industry Volume (K Unit) Forecast, by Application 2019 & 2032
- Table 43: Rest of Asia Pacific OTC DOA Test Industry Revenue (Million) Forecast, by Application 2019 & 2032
- Table 44: Rest of Asia Pacific OTC DOA Test Industry Volume (K Unit) Forecast, by Application 2019 & 2032
- Table 45: Global OTC DOA Test Industry Revenue Million Forecast, by Country 2019 & 2032
- Table 46: Global OTC DOA Test Industry Volume K Unit Forecast, by Country 2019 & 2032
- Table 47: GCC OTC DOA Test Industry Revenue (Million) Forecast, by Application 2019 & 2032
- Table 48: GCC OTC DOA Test Industry Volume (K Unit) Forecast, by Application 2019 & 2032
- Table 49: South Africa OTC DOA Test Industry Revenue (Million) Forecast, by Application 2019 & 2032
- Table 50: South Africa OTC DOA Test Industry Volume (K Unit) Forecast, by Application 2019 & 2032
- Table 51: Rest of Middle East and Africa OTC DOA Test Industry Revenue (Million) Forecast, by Application 2019 & 2032
- Table 52: Rest of Middle East and Africa OTC DOA Test Industry Volume (K Unit) Forecast, by Application 2019 & 2032
- Table 53: Global OTC DOA Test Industry Revenue Million Forecast, by Country 2019 & 2032
- Table 54: Global OTC DOA Test Industry Volume K Unit Forecast, by Country 2019 & 2032
- Table 55: Brazil OTC DOA Test Industry Revenue (Million) Forecast, by Application 2019 & 2032
- Table 56: Brazil OTC DOA Test Industry Volume (K Unit) Forecast, by Application 2019 & 2032
- Table 57: Argentina OTC DOA Test Industry Revenue (Million) Forecast, by Application 2019 & 2032
- Table 58: Argentina OTC DOA Test Industry Volume (K Unit) Forecast, by Application 2019 & 2032
- Table 59: Rest of South America OTC DOA Test Industry Revenue (Million) Forecast, by Application 2019 & 2032
- Table 60: Rest of South America OTC DOA Test Industry Volume (K Unit) Forecast, by Application 2019 & 2032
- Table 61: Global OTC DOA Test Industry Revenue Million Forecast, by Type 2019 & 2032
- Table 62: Global OTC DOA Test Industry Volume K Unit Forecast, by Type 2019 & 2032
- Table 63: Global OTC DOA Test Industry Revenue Million Forecast, by Sample Type 2019 & 2032
- Table 64: Global OTC DOA Test Industry Volume K Unit Forecast, by Sample Type 2019 & 2032
- Table 65: Global OTC DOA Test Industry Revenue Million Forecast, by Country 2019 & 2032
- Table 66: Global OTC DOA Test Industry Volume K Unit Forecast, by Country 2019 & 2032
- Table 67: United States OTC DOA Test Industry Revenue (Million) Forecast, by Application 2019 & 2032
- Table 68: United States OTC DOA Test Industry Volume (K Unit) Forecast, by Application 2019 & 2032
- Table 69: Canada OTC DOA Test Industry Revenue (Million) Forecast, by Application 2019 & 2032
- Table 70: Canada OTC DOA Test Industry Volume (K Unit) Forecast, by Application 2019 & 2032
- Table 71: Mexico OTC DOA Test Industry Revenue (Million) Forecast, by Application 2019 & 2032
- Table 72: Mexico OTC DOA Test Industry Volume (K Unit) Forecast, by Application 2019 & 2032
- Table 73: Global OTC DOA Test Industry Revenue Million Forecast, by Type 2019 & 2032
- Table 74: Global OTC DOA Test Industry Volume K Unit Forecast, by Type 2019 & 2032
- Table 75: Global OTC DOA Test Industry Revenue Million Forecast, by Sample Type 2019 & 2032
- Table 76: Global OTC DOA Test Industry Volume K Unit Forecast, by Sample Type 2019 & 2032
- Table 77: Global OTC DOA Test Industry Revenue Million Forecast, by Country 2019 & 2032
- Table 78: Global OTC DOA Test Industry Volume K Unit Forecast, by Country 2019 & 2032
- Table 79: Germany OTC DOA Test Industry Revenue (Million) Forecast, by Application 2019 & 2032
- Table 80: Germany OTC DOA Test Industry Volume (K Unit) Forecast, by Application 2019 & 2032
- Table 81: United Kingdom OTC DOA Test Industry Revenue (Million) Forecast, by Application 2019 & 2032
- Table 82: United Kingdom OTC DOA Test Industry Volume (K Unit) Forecast, by Application 2019 & 2032
- Table 83: France OTC DOA Test Industry Revenue (Million) Forecast, by Application 2019 & 2032
- Table 84: France OTC DOA Test Industry Volume (K Unit) Forecast, by Application 2019 & 2032
- Table 85: Italy OTC DOA Test Industry Revenue (Million) Forecast, by Application 2019 & 2032
- Table 86: Italy OTC DOA Test Industry Volume (K Unit) Forecast, by Application 2019 & 2032
- Table 87: Spain OTC DOA Test Industry Revenue (Million) Forecast, by Application 2019 & 2032
- Table 88: Spain OTC DOA Test Industry Volume (K Unit) Forecast, by Application 2019 & 2032
- Table 89: Rest of Europe OTC DOA Test Industry Revenue (Million) Forecast, by Application 2019 & 2032
- Table 90: Rest of Europe OTC DOA Test Industry Volume (K Unit) Forecast, by Application 2019 & 2032
- Table 91: Global OTC DOA Test Industry Revenue Million Forecast, by Type 2019 & 2032
- Table 92: Global OTC DOA Test Industry Volume K Unit Forecast, by Type 2019 & 2032
- Table 93: Global OTC DOA Test Industry Revenue Million Forecast, by Sample Type 2019 & 2032
- Table 94: Global OTC DOA Test Industry Volume K Unit Forecast, by Sample Type 2019 & 2032
- Table 95: Global OTC DOA Test Industry Revenue Million Forecast, by Country 2019 & 2032
- Table 96: Global OTC DOA Test Industry Volume K Unit Forecast, by Country 2019 & 2032
- Table 97: China OTC DOA Test Industry Revenue (Million) Forecast, by Application 2019 & 2032
- Table 98: China OTC DOA Test Industry Volume (K Unit) Forecast, by Application 2019 & 2032
- Table 99: Japan OTC DOA Test Industry Revenue (Million) Forecast, by Application 2019 & 2032
- Table 100: Japan OTC DOA Test Industry Volume (K Unit) Forecast, by Application 2019 & 2032
- Table 101: India OTC DOA Test Industry Revenue (Million) Forecast, by Application 2019 & 2032
- Table 102: India OTC DOA Test Industry Volume (K Unit) Forecast, by Application 2019 & 2032
- Table 103: Australia OTC DOA Test Industry Revenue (Million) Forecast, by Application 2019 & 2032
- Table 104: Australia OTC DOA Test Industry Volume (K Unit) Forecast, by Application 2019 & 2032
- Table 105: South Korea OTC DOA Test Industry Revenue (Million) Forecast, by Application 2019 & 2032
- Table 106: South Korea OTC DOA Test Industry Volume (K Unit) Forecast, by Application 2019 & 2032
- Table 107: Rest of Asia Pacific OTC DOA Test Industry Revenue (Million) Forecast, by Application 2019 & 2032
- Table 108: Rest of Asia Pacific OTC DOA Test Industry Volume (K Unit) Forecast, by Application 2019 & 2032
- Table 109: Global OTC DOA Test Industry Revenue Million Forecast, by Type 2019 & 2032
- Table 110: Global OTC DOA Test Industry Volume K Unit Forecast, by Type 2019 & 2032
- Table 111: Global OTC DOA Test Industry Revenue Million Forecast, by Sample Type 2019 & 2032
- Table 112: Global OTC DOA Test Industry Volume K Unit Forecast, by Sample Type 2019 & 2032
- Table 113: Global OTC DOA Test Industry Revenue Million Forecast, by Country 2019 & 2032
- Table 114: Global OTC DOA Test Industry Volume K Unit Forecast, by Country 2019 & 2032
- Table 115: GCC OTC DOA Test Industry Revenue (Million) Forecast, by Application 2019 & 2032
- Table 116: GCC OTC DOA Test Industry Volume (K Unit) Forecast, by Application 2019 & 2032
- Table 117: South Africa OTC DOA Test Industry Revenue (Million) Forecast, by Application 2019 & 2032
- Table 118: South Africa OTC DOA Test Industry Volume (K Unit) Forecast, by Application 2019 & 2032
- Table 119: Rest of Middle East and Africa OTC DOA Test Industry Revenue (Million) Forecast, by Application 2019 & 2032
- Table 120: Rest of Middle East and Africa OTC DOA Test Industry Volume (K Unit) Forecast, by Application 2019 & 2032
- Table 121: Global OTC DOA Test Industry Revenue Million Forecast, by Type 2019 & 2032
- Table 122: Global OTC DOA Test Industry Volume K Unit Forecast, by Type 2019 & 2032
- Table 123: Global OTC DOA Test Industry Revenue Million Forecast, by Sample Type 2019 & 2032
- Table 124: Global OTC DOA Test Industry Volume K Unit Forecast, by Sample Type 2019 & 2032
- Table 125: Global OTC DOA Test Industry Revenue Million Forecast, by Country 2019 & 2032
- Table 126: Global OTC DOA Test Industry Volume K Unit Forecast, by Country 2019 & 2032
- Table 127: Brazil OTC DOA Test Industry Revenue (Million) Forecast, by Application 2019 & 2032
- Table 128: Brazil OTC DOA Test Industry Volume (K Unit) Forecast, by Application 2019 & 2032
- Table 129: Argentina OTC DOA Test Industry Revenue (Million) Forecast, by Application 2019 & 2032
- Table 130: Argentina OTC DOA Test Industry Volume (K Unit) Forecast, by Application 2019 & 2032
- Table 131: Rest of South America OTC DOA Test Industry Revenue (Million) Forecast, by Application 2019 & 2032
- Table 132: Rest of South America OTC DOA Test Industry Volume (K Unit) Forecast, by Application 2019 & 2032
Frequently Asked Questions
1. What is the projected Compound Annual Growth Rate (CAGR) of the OTC DOA Test Industry?
The projected CAGR is approximately 5.34%.
2. Which companies are prominent players in the OTC DOA Test Industry?
Key companies in the market include Phamatech Inc, Abbott Laboratories, Psychemedics Corporation, Assure Tech (Hangzhou) Co LTD, UCP Biosciences Inc, Dragerwerk AG & Co KGaA, Orient New Life Medical Co Ltd, Confirm BioSciences, Atlas Medical GmbH.
3. What are the main segments of the OTC DOA Test Industry?
The market segments include Type, Sample Type.
4. Can you provide details about the market size?
The market size is estimated to be USD 719.78 Million as of 2022.
5. What are some drivers contributing to market growth?
Growing Use and Production of Illicit Drugs; Increasing Initiatives by Governemnt Organizations to Reduce Drug Abuse.
6. What are the notable trends driving market growth?
Test Strip Segment is Expected to Hold a Significant Market Share Over the Forecast Period.
7. Are there any restraints impacting market growth?
Lack of Awareness and Consideration of Drug Testing.
8. Can you provide examples of recent developments in the market?
In March 2022, the Department of Health and Human Services (HHS) offered funding of USD 58.5 million in contingency management tests for people with stimulant use disorder in California.
9. What pricing options are available for accessing the report?
Pricing options include single-user, multi-user, and enterprise licenses priced at USD 4750, USD 5250, and USD 8750 respectively.
10. Is the market size provided in terms of value or volume?
The market size is provided in terms of value, measured in Million and volume, measured in K Unit.
11. Are there any specific market keywords associated with the report?
Yes, the market keyword associated with the report is "OTC DOA Test Industry," which aids in identifying and referencing the specific market segment covered.
12. How do I determine which pricing option suits my needs best?
The pricing options vary based on user requirements and access needs. Individual users may opt for single-user licenses, while businesses requiring broader access may choose multi-user or enterprise licenses for cost-effective access to the report.
13. Are there any additional resources or data provided in the OTC DOA Test Industry report?
While the report offers comprehensive insights, it's advisable to review the specific contents or supplementary materials provided to ascertain if additional resources or data are available.
14. How can I stay updated on further developments or reports in the OTC DOA Test Industry?
To stay informed about further developments, trends, and reports in the OTC DOA Test Industry, consider subscribing to industry newsletters, following relevant companies and organizations, or regularly checking reputable industry news sources and publications.
Methodology
Step 1 - Identification of Relevant Samples Size from Population Database


Step 2 - Approaches for Defining Global Market Size (Value, Volume* & Price*)

Note*: In applicable scenarios
Step 3 - Data Sources
Primary Research
- Web Analytics
- Survey Reports
- Research Institute
- Latest Research Reports
- Opinion Leaders
Secondary Research
- Annual Reports
- White Paper
- Latest Press Release
- Industry Association
- Paid Database
- Investor Presentations

Step 4 - Data Triangulation
Involves using different sources of information in order to increase the validity of a study
These sources are likely to be stakeholders in a program - participants, other researchers, program staff, other community members, and so on.
Then we put all data in single framework & apply various statistical tools to find out the dynamic on the market.
During the analysis stage, feedback from the stakeholder groups would be compared to determine areas of agreement as well as areas of divergence
