

Key Insights
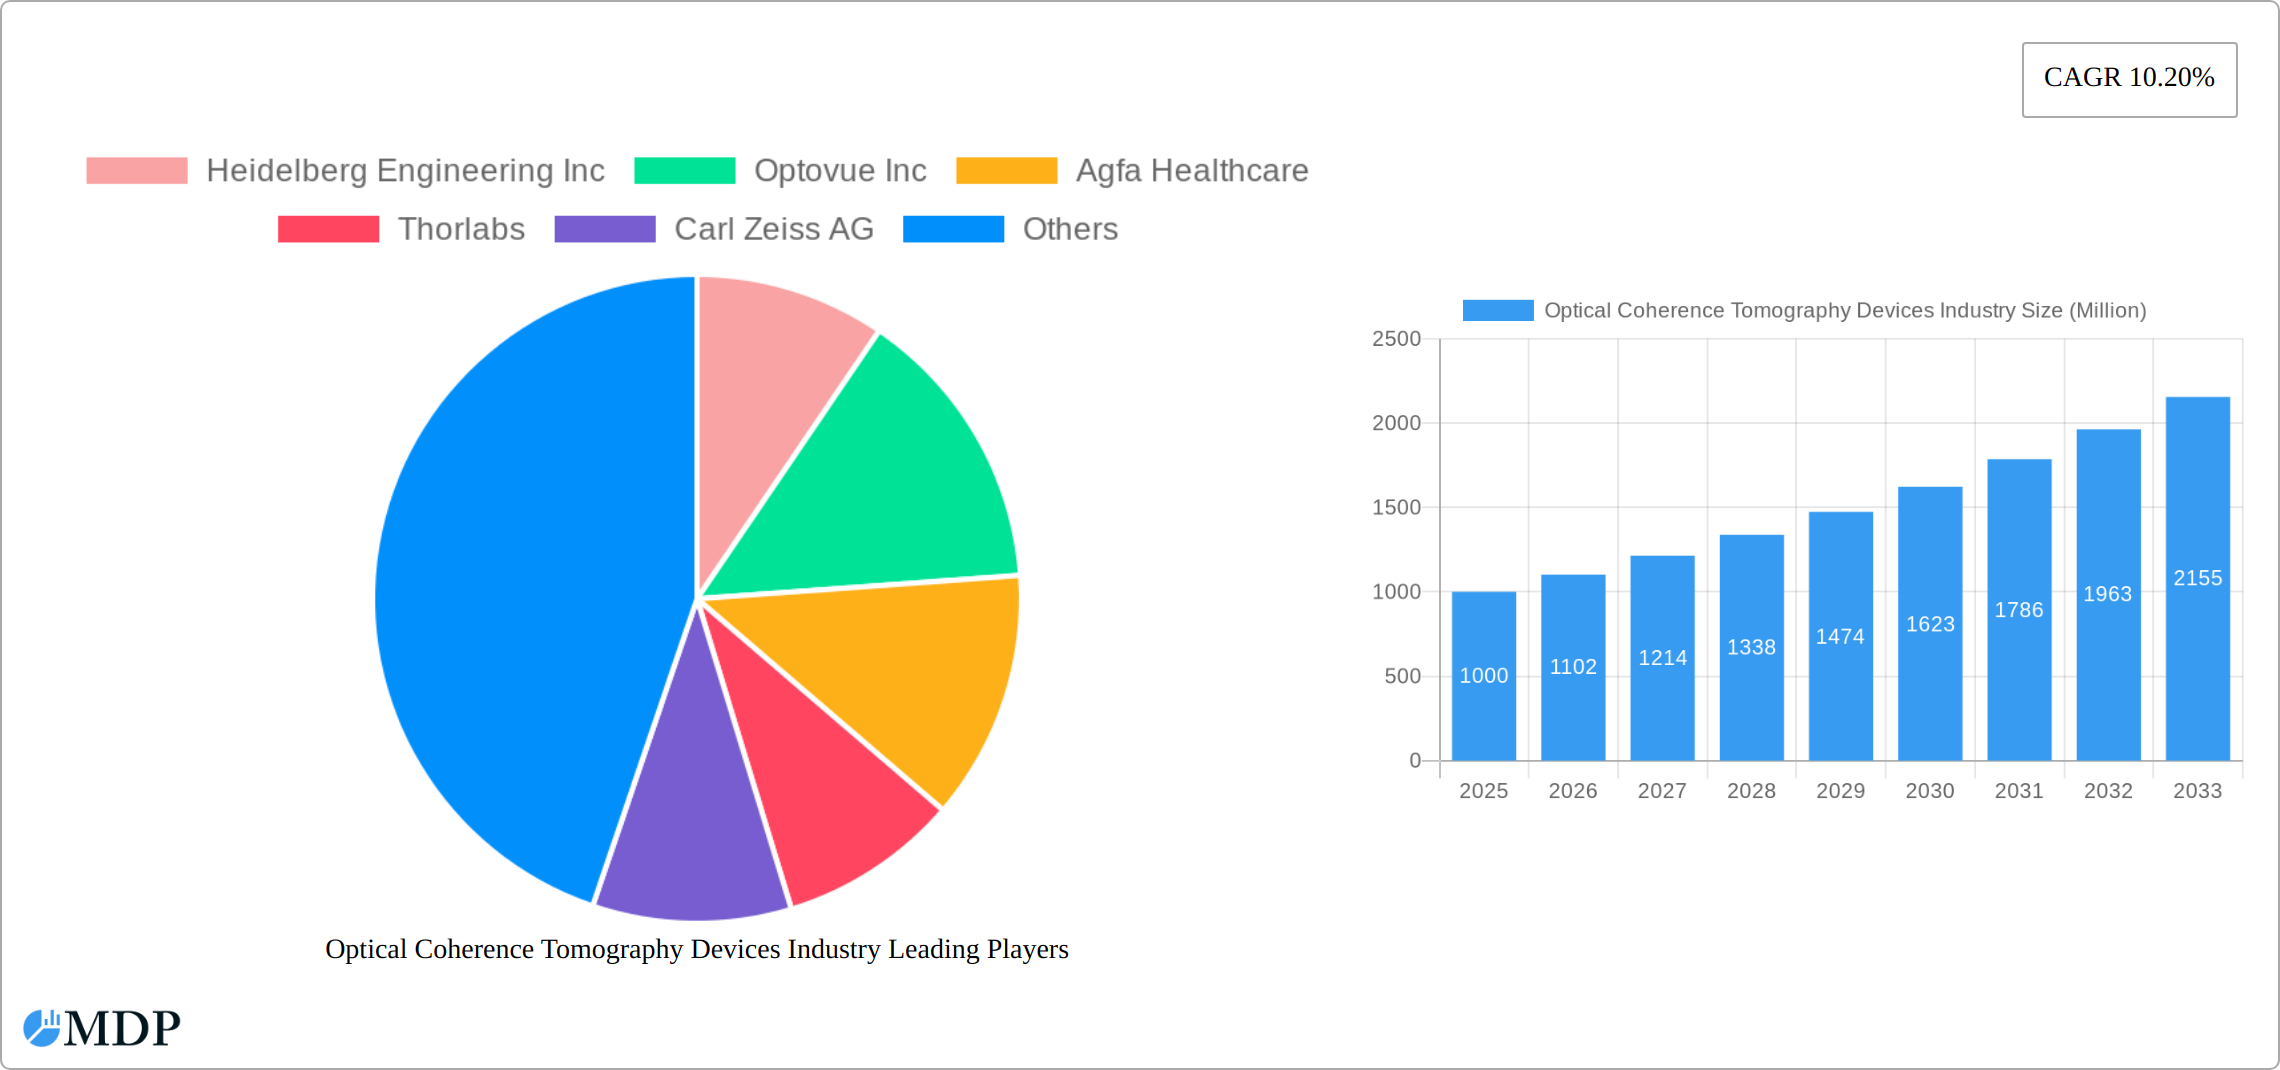
The Optical Coherence Tomography (OCT) devices market is experiencing robust growth, projected to maintain a Compound Annual Growth Rate (CAGR) of 10.2% from 2025 to 2033. This expansion is fueled by several key drivers. The increasing prevalence of chronic eye diseases like glaucoma and age-related macular degeneration is significantly boosting demand for ophthalmic OCT devices, a major segment within the market. Similarly, the rising incidence of cardiovascular diseases and the need for precise diagnostics are driving growth in the cardiovascular application segment. Advancements in technology, such as the development of handheld and more portable OCT devices, are enhancing accessibility and convenience, further fueling market expansion. The integration of OCT technology into other medical imaging modalities is also contributing to its wider adoption. While the market faces certain restraints, such as high initial investment costs for advanced systems and the need for skilled professionals for operation and interpretation, these challenges are being mitigated by technological advancements leading to more cost-effective and user-friendly devices. The market segmentation shows a strong preference for handheld devices due to their portability and ease of use in various settings, though tabletop devices continue to dominate in specialized clinical environments. Geographically, North America and Europe currently hold the largest market share, owing to well-established healthcare infrastructure and high adoption rates. However, the Asia-Pacific region is expected to witness significant growth in the coming years due to increasing healthcare expenditure and rising awareness about eye and cardiovascular health.
The competitive landscape is characterized by a mix of established players and emerging companies. Major players like Heidelberg Engineering, Optovue, and Carl Zeiss are driving innovation and expanding their market presence through strategic partnerships and product launches. The continued development of more sophisticated OCT technologies with enhanced image resolution and faster scan speeds, along with the exploration of new applications, will further propel market growth throughout the forecast period. This includes the integration of artificial intelligence for automated image analysis and the development of OCT devices for applications beyond ophthalmology and cardiology, such as dermatology and gastroenterology, representing significant future opportunities for growth. The market's trajectory suggests a promising future for OCT technology, driven by improving healthcare infrastructure, technological advancements, and an increased focus on early diagnosis and personalized medicine. Assuming a 2025 market size of $1 billion (a reasonable estimation based on typical market sizes for medical imaging technologies with similar growth rates), the market is poised for substantial expansion in the coming years.
Optical Coherence Tomography (OCT) Devices Industry Report: 2019-2033
This comprehensive report provides an in-depth analysis of the Optical Coherence Tomography (OCT) Devices industry, covering market dynamics, leading players, technological advancements, and future growth prospects. The study period spans from 2019 to 2033, with 2025 serving as the base and estimated year. The forecast period extends from 2025 to 2033, while the historical period covers 2019-2024. This report is invaluable for industry stakeholders, investors, and researchers seeking a clear understanding of this rapidly evolving market. The global OCT devices market is projected to reach xx Million by 2033.
Optical Coherence Tomography Devices Industry Market Dynamics & Concentration
The Optical Coherence Tomography (OCT) devices market is characterized by a moderately concentrated landscape with several key players vying for market share. Market concentration is influenced by factors such as technological advancements, regulatory approvals, and mergers and acquisitions (M&A) activities. Over the historical period (2019-2024), the market witnessed xx M&A deals, primarily driven by the need to expand product portfolios and geographical reach. Major players like Heidelberg Engineering Inc. and Carl Zeiss AG hold significant market share, estimated at xx% and xx% respectively in 2025. The industry is marked by continuous innovation, with companies investing heavily in research and development to improve image quality, speed, and portability of OCT devices. Regulatory frameworks, particularly those concerning medical device approvals, significantly influence market entry and product adoption. The availability of substitute technologies, such as ultrasound and MRI, presents competitive pressure. End-user trends, primarily driven by increasing demand for minimally invasive diagnostic tools and improved patient care, continue to fuel market growth.
Market Share (2025):
- Heidelberg Engineering Inc: xx%
- Carl Zeiss AG: xx%
- Optovue Inc: xx%
- Others: xx%
M&A Activity (2019-2024): xx deals
Optical Coherence Tomography Devices Industry Industry Trends & Analysis
The OCT devices market is experiencing robust growth, driven by several key factors. The rising prevalence of chronic diseases, such as cardiovascular diseases and ophthalmic conditions, significantly boosts the demand for accurate and non-invasive diagnostic tools. Technological advancements, such as the development of handheld and high-speed OCT systems, are enhancing the accessibility and efficiency of OCT imaging. Consumer preferences are shifting towards portable and user-friendly devices, creating opportunities for smaller, more versatile OCT systems. The market exhibits strong competitive dynamics, with companies continuously striving to improve product features, expand their geographical reach, and forge strategic partnerships. The Compound Annual Growth Rate (CAGR) for the forecast period (2025-2033) is estimated to be xx%, indicating substantial market expansion. Market penetration is increasing, particularly in developing economies where access to advanced diagnostic technologies is expanding.

Leading Markets & Segments in Optical Coherence Tomography Devices Industry
The ophthalmology segment remains the dominant application of Optical Coherence Tomography (OCT) devices, capturing approximately 70% of the market share in 2025. This significant share is fueled by the increasing adoption of OCT for the precise diagnosis and ongoing management of various retinal diseases. North America and Europe continue to lead geographically, driven by substantial healthcare expenditure, advanced medical infrastructure, and a robust presence of key industry players. While Tabletop OCT devices currently hold a larger market share (60%) than Handheld OCT devices (40%) due to their superior image quality and advanced features, the Handheld segment demonstrates significantly faster growth, projected to significantly impact the market in the coming years.
- Leading Segment (Application): Ophthalmology
- Key Drivers: High prevalence of age-related macular degeneration (AMD), diabetic retinopathy, glaucoma, and other retinal diseases; increasing demand for precise, non-invasive diagnostic tools; favorable reimbursement policies in developed nations; and the growing adoption of OCT for monitoring disease progression and treatment response.
- Leading Segment (Type): Tabletop OCT Devices
- Key Drivers: Superior image resolution and quality; broader range of advanced features, including angiography and en face imaging; established clinical workflow integration; and a strong history of reliable performance and data analysis capabilities.
- Leading Regions: North America and Europe
- Key Drivers: High healthcare spending per capita; well-developed healthcare infrastructure, including specialized eye care centers; strong regulatory frameworks supporting the adoption of new medical technologies; and a high concentration of ophthalmologists and other specialists utilizing OCT technology.
Optical Coherence Tomography Devices Industry Product Developments
Recent product developments focus on enhancing image quality, speed, and portability. High-speed OCT systems offer faster scan times, improving workflow efficiency. Handheld OCT devices are becoming increasingly popular due to their portability and suitability for point-of-care diagnostics. Integration of advanced image processing algorithms is improving diagnostic accuracy and reducing the need for operator expertise. Miniaturization and advancements in optical components are leading to smaller and more cost-effective devices.
Key Drivers of Optical Coherence Tomography Devices Industry Growth
Technological advancements are pivotal, leading to improved image quality, faster scan times, and increased portability. The rising prevalence of chronic diseases, particularly ophthalmic and cardiovascular conditions, significantly boosts demand. Favorable reimbursement policies in developed markets stimulate market expansion. Increasing awareness about early diagnosis and preventative healthcare among consumers also drives growth.
Challenges in the Optical Coherence Tomography Devices Industry Market
Regulatory hurdles for medical device approval create significant barriers to market entry. Supply chain disruptions can affect the availability of critical components, impacting production and potentially leading to price fluctuations. Intense competition from established players and emerging competitors puts pressure on pricing and profit margins.
Emerging Opportunities in Optical Coherence Tomography Devices Industry
The OCT devices market is poised for substantial growth, driven by several key factors. Advancements in technology are leading to more compact, portable, and affordable OCT systems, expanding accessibility to broader patient populations and clinical settings. Strategic collaborations between OCT device manufacturers and healthcare providers are accelerating market penetration and improving patient access to these crucial diagnostic tools. Furthermore, the expansion into developing economies with growing healthcare infrastructure presents significant untapped potential. The integration of artificial intelligence (AI) and machine learning (ML) for automated image analysis and disease detection promises to further enhance the efficiency and diagnostic capabilities of OCT.
Leading Players in the Optical Coherence Tomography Devices Industry Sector
- Heidelberg Engineering Inc
- Optovue Inc
- Agfa Healthcare
- Thorlabs
- Carl Zeiss AG
- Terumo Medical Corporation
- Topcon Corporation
- OPTOPOL Technology
- Leica Microsystems (Danaher)
- Novacam Technologies
Key Milestones in Optical Coherence Tomography Devices Industry Industry
- April 2022: Alcon launched the Alcon Fidelis Virtual Reality (VR) Ophthalmic Surgical Simulator, enhancing training for cataract surgeons.
- January 2022: Haag-StreitUK launched the Optovue iScan80, an affordable and versatile high-speed OCT system.
Strategic Outlook for Optical Coherence Tomography Devices Industry Market
The OCT devices market is poised for sustained growth, fueled by continuous technological innovation, increasing global healthcare spending, and a heightened awareness of the importance of early disease detection and preventative care for ophthalmic conditions. Strategic alliances and partnerships, focused on expanding into emerging markets and developing integrated diagnostic platforms, will be pivotal in shaping the future landscape. The development of AI-powered diagnostic tools will also be a significant driver of growth, promising to improve the speed, accuracy, and efficiency of OCT analysis. This presents compelling opportunities for both established players and emerging companies to innovate and capture market share in this dynamic sector.
Optical Coherence Tomography Devices Industry Segmentation
-
1. Type
- 1.1. Handheld OCT devices
- 1.2. Tabletop OCT devices
-
2. Application
- 2.1. Dermatology
- 2.2. Ophthalmology
- 2.3. Cardiovascular
- 2.4. Others
Optical Coherence Tomography Devices Industry Segmentation By Geography
-
1. North America
- 1.1. United States
- 1.2. Canada
- 1.3. Mexico
-
2. Europe
- 2.1. Germany
- 2.2. United Kingdom
- 2.3. France
- 2.4. Italy
- 2.5. Spain
- 2.6. Rest of Europe
-
3. Asia Pacific
- 3.1. China
- 3.2. Japan
- 3.3. India
- 3.4. Australia
- 3.5. South Korea
- 3.6. Rest of Asia Pacific
-
4. Middle East and Africa
- 4.1. GCC
- 4.2. South Africa
- 4.3. Rest of Middle East and Africa
-
5. South America
- 5.1. Brazil
- 5.2. Argentina
- 5.3. Rest of South America

Optical Coherence Tomography Devices Industry REPORT HIGHLIGHTS
| Aspects | Details |
|---|---|
| Study Period | 2019-2033 |
| Base Year | 2024 |
| Estimated Year | 2025 |
| Forecast Period | 2025-2033 |
| Historical Period | 2019-2024 |
| Growth Rate | CAGR of 10.20% from 2019-2033 |
| Segmentation |
|
Table of Contents
- 1. Introduction
- 1.1. Research Scope
- 1.2. Market Segmentation
- 1.3. Research Methodology
- 1.4. Definitions and Assumptions
- 2. Executive Summary
- 2.1. Introduction
- 3. Market Dynamics
- 3.1. Introduction
- 3.2. Market Drivers
- 3.2.1. Increasing Demand in Biomedical Application; Recent Technological Developments in Diagnostics
- 3.3. Market Restrains
- 3.3.1. Reimbursement Policies
- 3.4. Market Trends
- 3.4.1. Opthalmology by Application in Optical Coherence Tomography Market is Expected to Witness a Healthy Growth in Future.
- 4. Market Factor Analysis
- 4.1. Porters Five Forces
- 4.2. Supply/Value Chain
- 4.3. PESTEL analysis
- 4.4. Market Entropy
- 4.5. Patent/Trademark Analysis
- 5. Global Optical Coherence Tomography Devices Industry Analysis, Insights and Forecast, 2019-2031
- 5.1. Market Analysis, Insights and Forecast - by Type
- 5.1.1. Handheld OCT devices
- 5.1.2. Tabletop OCT devices
- 5.2. Market Analysis, Insights and Forecast - by Application
- 5.2.1. Dermatology
- 5.2.2. Ophthalmology
- 5.2.3. Cardiovascular
- 5.2.4. Others
- 5.3. Market Analysis, Insights and Forecast - by Region
- 5.3.1. North America
- 5.3.2. Europe
- 5.3.3. Asia Pacific
- 5.3.4. Middle East and Africa
- 5.3.5. South America
- 5.1. Market Analysis, Insights and Forecast - by Type
- 6. North America Optical Coherence Tomography Devices Industry Analysis, Insights and Forecast, 2019-2031
- 6.1. Market Analysis, Insights and Forecast - by Type
- 6.1.1. Handheld OCT devices
- 6.1.2. Tabletop OCT devices
- 6.2. Market Analysis, Insights and Forecast - by Application
- 6.2.1. Dermatology
- 6.2.2. Ophthalmology
- 6.2.3. Cardiovascular
- 6.2.4. Others
- 6.1. Market Analysis, Insights and Forecast - by Type
- 7. Europe Optical Coherence Tomography Devices Industry Analysis, Insights and Forecast, 2019-2031
- 7.1. Market Analysis, Insights and Forecast - by Type
- 7.1.1. Handheld OCT devices
- 7.1.2. Tabletop OCT devices
- 7.2. Market Analysis, Insights and Forecast - by Application
- 7.2.1. Dermatology
- 7.2.2. Ophthalmology
- 7.2.3. Cardiovascular
- 7.2.4. Others
- 7.1. Market Analysis, Insights and Forecast - by Type
- 8. Asia Pacific Optical Coherence Tomography Devices Industry Analysis, Insights and Forecast, 2019-2031
- 8.1. Market Analysis, Insights and Forecast - by Type
- 8.1.1. Handheld OCT devices
- 8.1.2. Tabletop OCT devices
- 8.2. Market Analysis, Insights and Forecast - by Application
- 8.2.1. Dermatology
- 8.2.2. Ophthalmology
- 8.2.3. Cardiovascular
- 8.2.4. Others
- 8.1. Market Analysis, Insights and Forecast - by Type
- 9. Middle East and Africa Optical Coherence Tomography Devices Industry Analysis, Insights and Forecast, 2019-2031
- 9.1. Market Analysis, Insights and Forecast - by Type
- 9.1.1. Handheld OCT devices
- 9.1.2. Tabletop OCT devices
- 9.2. Market Analysis, Insights and Forecast - by Application
- 9.2.1. Dermatology
- 9.2.2. Ophthalmology
- 9.2.3. Cardiovascular
- 9.2.4. Others
- 9.1. Market Analysis, Insights and Forecast - by Type
- 10. South America Optical Coherence Tomography Devices Industry Analysis, Insights and Forecast, 2019-2031
- 10.1. Market Analysis, Insights and Forecast - by Type
- 10.1.1. Handheld OCT devices
- 10.1.2. Tabletop OCT devices
- 10.2. Market Analysis, Insights and Forecast - by Application
- 10.2.1. Dermatology
- 10.2.2. Ophthalmology
- 10.2.3. Cardiovascular
- 10.2.4. Others
- 10.1. Market Analysis, Insights and Forecast - by Type
- 11. North America Optical Coherence Tomography Devices Industry Analysis, Insights and Forecast, 2019-2031
- 11.1. Market Analysis, Insights and Forecast - By Country/Sub-region
- 11.1.1 United States
- 11.1.2 Canada
- 11.1.3 Mexico
- 12. Europe Optical Coherence Tomography Devices Industry Analysis, Insights and Forecast, 2019-2031
- 12.1. Market Analysis, Insights and Forecast - By Country/Sub-region
- 12.1.1 Germany
- 12.1.2 United Kingdom
- 12.1.3 France
- 12.1.4 Italy
- 12.1.5 Spain
- 12.1.6 Rest of Europe
- 13. Asia Pacific Optical Coherence Tomography Devices Industry Analysis, Insights and Forecast, 2019-2031
- 13.1. Market Analysis, Insights and Forecast - By Country/Sub-region
- 13.1.1 China
- 13.1.2 Japan
- 13.1.3 India
- 13.1.4 Australia
- 13.1.5 South Korea
- 13.1.6 Rest of Asia Pacific
- 14. Middle East and Africa Optical Coherence Tomography Devices Industry Analysis, Insights and Forecast, 2019-2031
- 14.1. Market Analysis, Insights and Forecast - By Country/Sub-region
- 14.1.1 GCC
- 14.1.2 South Africa
- 14.1.3 Rest of Middle East and Africa
- 15. South America Optical Coherence Tomography Devices Industry Analysis, Insights and Forecast, 2019-2031
- 15.1. Market Analysis, Insights and Forecast - By Country/Sub-region
- 15.1.1 Brazil
- 15.1.2 Argentina
- 15.1.3 Rest of South America
- 16. Competitive Analysis
- 16.1. Global Market Share Analysis 2024
- 16.2. Company Profiles
- 16.2.1 Heidelberg Engineering Inc
- 16.2.1.1. Overview
- 16.2.1.2. Products
- 16.2.1.3. SWOT Analysis
- 16.2.1.4. Recent Developments
- 16.2.1.5. Financials (Based on Availability)
- 16.2.2 Optovue Inc
- 16.2.2.1. Overview
- 16.2.2.2. Products
- 16.2.2.3. SWOT Analysis
- 16.2.2.4. Recent Developments
- 16.2.2.5. Financials (Based on Availability)
- 16.2.3 Agfa Healthcare
- 16.2.3.1. Overview
- 16.2.3.2. Products
- 16.2.3.3. SWOT Analysis
- 16.2.3.4. Recent Developments
- 16.2.3.5. Financials (Based on Availability)
- 16.2.4 Thorlabs
- 16.2.4.1. Overview
- 16.2.4.2. Products
- 16.2.4.3. SWOT Analysis
- 16.2.4.4. Recent Developments
- 16.2.4.5. Financials (Based on Availability)
- 16.2.5 Carl Zeiss AG
- 16.2.5.1. Overview
- 16.2.5.2. Products
- 16.2.5.3. SWOT Analysis
- 16.2.5.4. Recent Developments
- 16.2.5.5. Financials (Based on Availability)
- 16.2.6 Terumo Medical Corporation
- 16.2.6.1. Overview
- 16.2.6.2. Products
- 16.2.6.3. SWOT Analysis
- 16.2.6.4. Recent Developments
- 16.2.6.5. Financials (Based on Availability)
- 16.2.7 Topcon Corporation
- 16.2.7.1. Overview
- 16.2.7.2. Products
- 16.2.7.3. SWOT Analysis
- 16.2.7.4. Recent Developments
- 16.2.7.5. Financials (Based on Availability)
- 16.2.8 OPTOPOL Technology
- 16.2.8.1. Overview
- 16.2.8.2. Products
- 16.2.8.3. SWOT Analysis
- 16.2.8.4. Recent Developments
- 16.2.8.5. Financials (Based on Availability)
- 16.2.9 Leica Microsystems (Danaher)
- 16.2.9.1. Overview
- 16.2.9.2. Products
- 16.2.9.3. SWOT Analysis
- 16.2.9.4. Recent Developments
- 16.2.9.5. Financials (Based on Availability)
- 16.2.10 Novacam Technologies
- 16.2.10.1. Overview
- 16.2.10.2. Products
- 16.2.10.3. SWOT Analysis
- 16.2.10.4. Recent Developments
- 16.2.10.5. Financials (Based on Availability)
- 16.2.1 Heidelberg Engineering Inc
List of Figures
- Figure 1: Global Optical Coherence Tomography Devices Industry Revenue Breakdown (Million, %) by Region 2024 & 2032
- Figure 2: Global Optical Coherence Tomography Devices Industry Volume Breakdown (K Unit, %) by Region 2024 & 2032
- Figure 3: North America Optical Coherence Tomography Devices Industry Revenue (Million), by Country 2024 & 2032
- Figure 4: North America Optical Coherence Tomography Devices Industry Volume (K Unit), by Country 2024 & 2032
- Figure 5: North America Optical Coherence Tomography Devices Industry Revenue Share (%), by Country 2024 & 2032
- Figure 6: North America Optical Coherence Tomography Devices Industry Volume Share (%), by Country 2024 & 2032
- Figure 7: Europe Optical Coherence Tomography Devices Industry Revenue (Million), by Country 2024 & 2032
- Figure 8: Europe Optical Coherence Tomography Devices Industry Volume (K Unit), by Country 2024 & 2032
- Figure 9: Europe Optical Coherence Tomography Devices Industry Revenue Share (%), by Country 2024 & 2032
- Figure 10: Europe Optical Coherence Tomography Devices Industry Volume Share (%), by Country 2024 & 2032
- Figure 11: Asia Pacific Optical Coherence Tomography Devices Industry Revenue (Million), by Country 2024 & 2032
- Figure 12: Asia Pacific Optical Coherence Tomography Devices Industry Volume (K Unit), by Country 2024 & 2032
- Figure 13: Asia Pacific Optical Coherence Tomography Devices Industry Revenue Share (%), by Country 2024 & 2032
- Figure 14: Asia Pacific Optical Coherence Tomography Devices Industry Volume Share (%), by Country 2024 & 2032
- Figure 15: Middle East and Africa Optical Coherence Tomography Devices Industry Revenue (Million), by Country 2024 & 2032
- Figure 16: Middle East and Africa Optical Coherence Tomography Devices Industry Volume (K Unit), by Country 2024 & 2032
- Figure 17: Middle East and Africa Optical Coherence Tomography Devices Industry Revenue Share (%), by Country 2024 & 2032
- Figure 18: Middle East and Africa Optical Coherence Tomography Devices Industry Volume Share (%), by Country 2024 & 2032
- Figure 19: South America Optical Coherence Tomography Devices Industry Revenue (Million), by Country 2024 & 2032
- Figure 20: South America Optical Coherence Tomography Devices Industry Volume (K Unit), by Country 2024 & 2032
- Figure 21: South America Optical Coherence Tomography Devices Industry Revenue Share (%), by Country 2024 & 2032
- Figure 22: South America Optical Coherence Tomography Devices Industry Volume Share (%), by Country 2024 & 2032
- Figure 23: North America Optical Coherence Tomography Devices Industry Revenue (Million), by Type 2024 & 2032
- Figure 24: North America Optical Coherence Tomography Devices Industry Volume (K Unit), by Type 2024 & 2032
- Figure 25: North America Optical Coherence Tomography Devices Industry Revenue Share (%), by Type 2024 & 2032
- Figure 26: North America Optical Coherence Tomography Devices Industry Volume Share (%), by Type 2024 & 2032
- Figure 27: North America Optical Coherence Tomography Devices Industry Revenue (Million), by Application 2024 & 2032
- Figure 28: North America Optical Coherence Tomography Devices Industry Volume (K Unit), by Application 2024 & 2032
- Figure 29: North America Optical Coherence Tomography Devices Industry Revenue Share (%), by Application 2024 & 2032
- Figure 30: North America Optical Coherence Tomography Devices Industry Volume Share (%), by Application 2024 & 2032
- Figure 31: North America Optical Coherence Tomography Devices Industry Revenue (Million), by Country 2024 & 2032
- Figure 32: North America Optical Coherence Tomography Devices Industry Volume (K Unit), by Country 2024 & 2032
- Figure 33: North America Optical Coherence Tomography Devices Industry Revenue Share (%), by Country 2024 & 2032
- Figure 34: North America Optical Coherence Tomography Devices Industry Volume Share (%), by Country 2024 & 2032
- Figure 35: Europe Optical Coherence Tomography Devices Industry Revenue (Million), by Type 2024 & 2032
- Figure 36: Europe Optical Coherence Tomography Devices Industry Volume (K Unit), by Type 2024 & 2032
- Figure 37: Europe Optical Coherence Tomography Devices Industry Revenue Share (%), by Type 2024 & 2032
- Figure 38: Europe Optical Coherence Tomography Devices Industry Volume Share (%), by Type 2024 & 2032
- Figure 39: Europe Optical Coherence Tomography Devices Industry Revenue (Million), by Application 2024 & 2032
- Figure 40: Europe Optical Coherence Tomography Devices Industry Volume (K Unit), by Application 2024 & 2032
- Figure 41: Europe Optical Coherence Tomography Devices Industry Revenue Share (%), by Application 2024 & 2032
- Figure 42: Europe Optical Coherence Tomography Devices Industry Volume Share (%), by Application 2024 & 2032
- Figure 43: Europe Optical Coherence Tomography Devices Industry Revenue (Million), by Country 2024 & 2032
- Figure 44: Europe Optical Coherence Tomography Devices Industry Volume (K Unit), by Country 2024 & 2032
- Figure 45: Europe Optical Coherence Tomography Devices Industry Revenue Share (%), by Country 2024 & 2032
- Figure 46: Europe Optical Coherence Tomography Devices Industry Volume Share (%), by Country 2024 & 2032
- Figure 47: Asia Pacific Optical Coherence Tomography Devices Industry Revenue (Million), by Type 2024 & 2032
- Figure 48: Asia Pacific Optical Coherence Tomography Devices Industry Volume (K Unit), by Type 2024 & 2032
- Figure 49: Asia Pacific Optical Coherence Tomography Devices Industry Revenue Share (%), by Type 2024 & 2032
- Figure 50: Asia Pacific Optical Coherence Tomography Devices Industry Volume Share (%), by Type 2024 & 2032
- Figure 51: Asia Pacific Optical Coherence Tomography Devices Industry Revenue (Million), by Application 2024 & 2032
- Figure 52: Asia Pacific Optical Coherence Tomography Devices Industry Volume (K Unit), by Application 2024 & 2032
- Figure 53: Asia Pacific Optical Coherence Tomography Devices Industry Revenue Share (%), by Application 2024 & 2032
- Figure 54: Asia Pacific Optical Coherence Tomography Devices Industry Volume Share (%), by Application 2024 & 2032
- Figure 55: Asia Pacific Optical Coherence Tomography Devices Industry Revenue (Million), by Country 2024 & 2032
- Figure 56: Asia Pacific Optical Coherence Tomography Devices Industry Volume (K Unit), by Country 2024 & 2032
- Figure 57: Asia Pacific Optical Coherence Tomography Devices Industry Revenue Share (%), by Country 2024 & 2032
- Figure 58: Asia Pacific Optical Coherence Tomography Devices Industry Volume Share (%), by Country 2024 & 2032
- Figure 59: Middle East and Africa Optical Coherence Tomography Devices Industry Revenue (Million), by Type 2024 & 2032
- Figure 60: Middle East and Africa Optical Coherence Tomography Devices Industry Volume (K Unit), by Type 2024 & 2032
- Figure 61: Middle East and Africa Optical Coherence Tomography Devices Industry Revenue Share (%), by Type 2024 & 2032
- Figure 62: Middle East and Africa Optical Coherence Tomography Devices Industry Volume Share (%), by Type 2024 & 2032
- Figure 63: Middle East and Africa Optical Coherence Tomography Devices Industry Revenue (Million), by Application 2024 & 2032
- Figure 64: Middle East and Africa Optical Coherence Tomography Devices Industry Volume (K Unit), by Application 2024 & 2032
- Figure 65: Middle East and Africa Optical Coherence Tomography Devices Industry Revenue Share (%), by Application 2024 & 2032
- Figure 66: Middle East and Africa Optical Coherence Tomography Devices Industry Volume Share (%), by Application 2024 & 2032
- Figure 67: Middle East and Africa Optical Coherence Tomography Devices Industry Revenue (Million), by Country 2024 & 2032
- Figure 68: Middle East and Africa Optical Coherence Tomography Devices Industry Volume (K Unit), by Country 2024 & 2032
- Figure 69: Middle East and Africa Optical Coherence Tomography Devices Industry Revenue Share (%), by Country 2024 & 2032
- Figure 70: Middle East and Africa Optical Coherence Tomography Devices Industry Volume Share (%), by Country 2024 & 2032
- Figure 71: South America Optical Coherence Tomography Devices Industry Revenue (Million), by Type 2024 & 2032
- Figure 72: South America Optical Coherence Tomography Devices Industry Volume (K Unit), by Type 2024 & 2032
- Figure 73: South America Optical Coherence Tomography Devices Industry Revenue Share (%), by Type 2024 & 2032
- Figure 74: South America Optical Coherence Tomography Devices Industry Volume Share (%), by Type 2024 & 2032
- Figure 75: South America Optical Coherence Tomography Devices Industry Revenue (Million), by Application 2024 & 2032
- Figure 76: South America Optical Coherence Tomography Devices Industry Volume (K Unit), by Application 2024 & 2032
- Figure 77: South America Optical Coherence Tomography Devices Industry Revenue Share (%), by Application 2024 & 2032
- Figure 78: South America Optical Coherence Tomography Devices Industry Volume Share (%), by Application 2024 & 2032
- Figure 79: South America Optical Coherence Tomography Devices Industry Revenue (Million), by Country 2024 & 2032
- Figure 80: South America Optical Coherence Tomography Devices Industry Volume (K Unit), by Country 2024 & 2032
- Figure 81: South America Optical Coherence Tomography Devices Industry Revenue Share (%), by Country 2024 & 2032
- Figure 82: South America Optical Coherence Tomography Devices Industry Volume Share (%), by Country 2024 & 2032
List of Tables
- Table 1: Global Optical Coherence Tomography Devices Industry Revenue Million Forecast, by Region 2019 & 2032
- Table 2: Global Optical Coherence Tomography Devices Industry Volume K Unit Forecast, by Region 2019 & 2032
- Table 3: Global Optical Coherence Tomography Devices Industry Revenue Million Forecast, by Type 2019 & 2032
- Table 4: Global Optical Coherence Tomography Devices Industry Volume K Unit Forecast, by Type 2019 & 2032
- Table 5: Global Optical Coherence Tomography Devices Industry Revenue Million Forecast, by Application 2019 & 2032
- Table 6: Global Optical Coherence Tomography Devices Industry Volume K Unit Forecast, by Application 2019 & 2032
- Table 7: Global Optical Coherence Tomography Devices Industry Revenue Million Forecast, by Region 2019 & 2032
- Table 8: Global Optical Coherence Tomography Devices Industry Volume K Unit Forecast, by Region 2019 & 2032
- Table 9: Global Optical Coherence Tomography Devices Industry Revenue Million Forecast, by Country 2019 & 2032
- Table 10: Global Optical Coherence Tomography Devices Industry Volume K Unit Forecast, by Country 2019 & 2032
- Table 11: United States Optical Coherence Tomography Devices Industry Revenue (Million) Forecast, by Application 2019 & 2032
- Table 12: United States Optical Coherence Tomography Devices Industry Volume (K Unit) Forecast, by Application 2019 & 2032
- Table 13: Canada Optical Coherence Tomography Devices Industry Revenue (Million) Forecast, by Application 2019 & 2032
- Table 14: Canada Optical Coherence Tomography Devices Industry Volume (K Unit) Forecast, by Application 2019 & 2032
- Table 15: Mexico Optical Coherence Tomography Devices Industry Revenue (Million) Forecast, by Application 2019 & 2032
- Table 16: Mexico Optical Coherence Tomography Devices Industry Volume (K Unit) Forecast, by Application 2019 & 2032
- Table 17: Global Optical Coherence Tomography Devices Industry Revenue Million Forecast, by Country 2019 & 2032
- Table 18: Global Optical Coherence Tomography Devices Industry Volume K Unit Forecast, by Country 2019 & 2032
- Table 19: Germany Optical Coherence Tomography Devices Industry Revenue (Million) Forecast, by Application 2019 & 2032
- Table 20: Germany Optical Coherence Tomography Devices Industry Volume (K Unit) Forecast, by Application 2019 & 2032
- Table 21: United Kingdom Optical Coherence Tomography Devices Industry Revenue (Million) Forecast, by Application 2019 & 2032
- Table 22: United Kingdom Optical Coherence Tomography Devices Industry Volume (K Unit) Forecast, by Application 2019 & 2032
- Table 23: France Optical Coherence Tomography Devices Industry Revenue (Million) Forecast, by Application 2019 & 2032
- Table 24: France Optical Coherence Tomography Devices Industry Volume (K Unit) Forecast, by Application 2019 & 2032
- Table 25: Italy Optical Coherence Tomography Devices Industry Revenue (Million) Forecast, by Application 2019 & 2032
- Table 26: Italy Optical Coherence Tomography Devices Industry Volume (K Unit) Forecast, by Application 2019 & 2032
- Table 27: Spain Optical Coherence Tomography Devices Industry Revenue (Million) Forecast, by Application 2019 & 2032
- Table 28: Spain Optical Coherence Tomography Devices Industry Volume (K Unit) Forecast, by Application 2019 & 2032
- Table 29: Rest of Europe Optical Coherence Tomography Devices Industry Revenue (Million) Forecast, by Application 2019 & 2032
- Table 30: Rest of Europe Optical Coherence Tomography Devices Industry Volume (K Unit) Forecast, by Application 2019 & 2032
- Table 31: Global Optical Coherence Tomography Devices Industry Revenue Million Forecast, by Country 2019 & 2032
- Table 32: Global Optical Coherence Tomography Devices Industry Volume K Unit Forecast, by Country 2019 & 2032
- Table 33: China Optical Coherence Tomography Devices Industry Revenue (Million) Forecast, by Application 2019 & 2032
- Table 34: China Optical Coherence Tomography Devices Industry Volume (K Unit) Forecast, by Application 2019 & 2032
- Table 35: Japan Optical Coherence Tomography Devices Industry Revenue (Million) Forecast, by Application 2019 & 2032
- Table 36: Japan Optical Coherence Tomography Devices Industry Volume (K Unit) Forecast, by Application 2019 & 2032
- Table 37: India Optical Coherence Tomography Devices Industry Revenue (Million) Forecast, by Application 2019 & 2032
- Table 38: India Optical Coherence Tomography Devices Industry Volume (K Unit) Forecast, by Application 2019 & 2032
- Table 39: Australia Optical Coherence Tomography Devices Industry Revenue (Million) Forecast, by Application 2019 & 2032
- Table 40: Australia Optical Coherence Tomography Devices Industry Volume (K Unit) Forecast, by Application 2019 & 2032
- Table 41: South Korea Optical Coherence Tomography Devices Industry Revenue (Million) Forecast, by Application 2019 & 2032
- Table 42: South Korea Optical Coherence Tomography Devices Industry Volume (K Unit) Forecast, by Application 2019 & 2032
- Table 43: Rest of Asia Pacific Optical Coherence Tomography Devices Industry Revenue (Million) Forecast, by Application 2019 & 2032
- Table 44: Rest of Asia Pacific Optical Coherence Tomography Devices Industry Volume (K Unit) Forecast, by Application 2019 & 2032
- Table 45: Global Optical Coherence Tomography Devices Industry Revenue Million Forecast, by Country 2019 & 2032
- Table 46: Global Optical Coherence Tomography Devices Industry Volume K Unit Forecast, by Country 2019 & 2032
- Table 47: GCC Optical Coherence Tomography Devices Industry Revenue (Million) Forecast, by Application 2019 & 2032
- Table 48: GCC Optical Coherence Tomography Devices Industry Volume (K Unit) Forecast, by Application 2019 & 2032
- Table 49: South Africa Optical Coherence Tomography Devices Industry Revenue (Million) Forecast, by Application 2019 & 2032
- Table 50: South Africa Optical Coherence Tomography Devices Industry Volume (K Unit) Forecast, by Application 2019 & 2032
- Table 51: Rest of Middle East and Africa Optical Coherence Tomography Devices Industry Revenue (Million) Forecast, by Application 2019 & 2032
- Table 52: Rest of Middle East and Africa Optical Coherence Tomography Devices Industry Volume (K Unit) Forecast, by Application 2019 & 2032
- Table 53: Global Optical Coherence Tomography Devices Industry Revenue Million Forecast, by Country 2019 & 2032
- Table 54: Global Optical Coherence Tomography Devices Industry Volume K Unit Forecast, by Country 2019 & 2032
- Table 55: Brazil Optical Coherence Tomography Devices Industry Revenue (Million) Forecast, by Application 2019 & 2032
- Table 56: Brazil Optical Coherence Tomography Devices Industry Volume (K Unit) Forecast, by Application 2019 & 2032
- Table 57: Argentina Optical Coherence Tomography Devices Industry Revenue (Million) Forecast, by Application 2019 & 2032
- Table 58: Argentina Optical Coherence Tomography Devices Industry Volume (K Unit) Forecast, by Application 2019 & 2032
- Table 59: Rest of South America Optical Coherence Tomography Devices Industry Revenue (Million) Forecast, by Application 2019 & 2032
- Table 60: Rest of South America Optical Coherence Tomography Devices Industry Volume (K Unit) Forecast, by Application 2019 & 2032
- Table 61: Global Optical Coherence Tomography Devices Industry Revenue Million Forecast, by Type 2019 & 2032
- Table 62: Global Optical Coherence Tomography Devices Industry Volume K Unit Forecast, by Type 2019 & 2032
- Table 63: Global Optical Coherence Tomography Devices Industry Revenue Million Forecast, by Application 2019 & 2032
- Table 64: Global Optical Coherence Tomography Devices Industry Volume K Unit Forecast, by Application 2019 & 2032
- Table 65: Global Optical Coherence Tomography Devices Industry Revenue Million Forecast, by Country 2019 & 2032
- Table 66: Global Optical Coherence Tomography Devices Industry Volume K Unit Forecast, by Country 2019 & 2032
- Table 67: United States Optical Coherence Tomography Devices Industry Revenue (Million) Forecast, by Application 2019 & 2032
- Table 68: United States Optical Coherence Tomography Devices Industry Volume (K Unit) Forecast, by Application 2019 & 2032
- Table 69: Canada Optical Coherence Tomography Devices Industry Revenue (Million) Forecast, by Application 2019 & 2032
- Table 70: Canada Optical Coherence Tomography Devices Industry Volume (K Unit) Forecast, by Application 2019 & 2032
- Table 71: Mexico Optical Coherence Tomography Devices Industry Revenue (Million) Forecast, by Application 2019 & 2032
- Table 72: Mexico Optical Coherence Tomography Devices Industry Volume (K Unit) Forecast, by Application 2019 & 2032
- Table 73: Global Optical Coherence Tomography Devices Industry Revenue Million Forecast, by Type 2019 & 2032
- Table 74: Global Optical Coherence Tomography Devices Industry Volume K Unit Forecast, by Type 2019 & 2032
- Table 75: Global Optical Coherence Tomography Devices Industry Revenue Million Forecast, by Application 2019 & 2032
- Table 76: Global Optical Coherence Tomography Devices Industry Volume K Unit Forecast, by Application 2019 & 2032
- Table 77: Global Optical Coherence Tomography Devices Industry Revenue Million Forecast, by Country 2019 & 2032
- Table 78: Global Optical Coherence Tomography Devices Industry Volume K Unit Forecast, by Country 2019 & 2032
- Table 79: Germany Optical Coherence Tomography Devices Industry Revenue (Million) Forecast, by Application 2019 & 2032
- Table 80: Germany Optical Coherence Tomography Devices Industry Volume (K Unit) Forecast, by Application 2019 & 2032
- Table 81: United Kingdom Optical Coherence Tomography Devices Industry Revenue (Million) Forecast, by Application 2019 & 2032
- Table 82: United Kingdom Optical Coherence Tomography Devices Industry Volume (K Unit) Forecast, by Application 2019 & 2032
- Table 83: France Optical Coherence Tomography Devices Industry Revenue (Million) Forecast, by Application 2019 & 2032
- Table 84: France Optical Coherence Tomography Devices Industry Volume (K Unit) Forecast, by Application 2019 & 2032
- Table 85: Italy Optical Coherence Tomography Devices Industry Revenue (Million) Forecast, by Application 2019 & 2032
- Table 86: Italy Optical Coherence Tomography Devices Industry Volume (K Unit) Forecast, by Application 2019 & 2032
- Table 87: Spain Optical Coherence Tomography Devices Industry Revenue (Million) Forecast, by Application 2019 & 2032
- Table 88: Spain Optical Coherence Tomography Devices Industry Volume (K Unit) Forecast, by Application 2019 & 2032
- Table 89: Rest of Europe Optical Coherence Tomography Devices Industry Revenue (Million) Forecast, by Application 2019 & 2032
- Table 90: Rest of Europe Optical Coherence Tomography Devices Industry Volume (K Unit) Forecast, by Application 2019 & 2032
- Table 91: Global Optical Coherence Tomography Devices Industry Revenue Million Forecast, by Type 2019 & 2032
- Table 92: Global Optical Coherence Tomography Devices Industry Volume K Unit Forecast, by Type 2019 & 2032
- Table 93: Global Optical Coherence Tomography Devices Industry Revenue Million Forecast, by Application 2019 & 2032
- Table 94: Global Optical Coherence Tomography Devices Industry Volume K Unit Forecast, by Application 2019 & 2032
- Table 95: Global Optical Coherence Tomography Devices Industry Revenue Million Forecast, by Country 2019 & 2032
- Table 96: Global Optical Coherence Tomography Devices Industry Volume K Unit Forecast, by Country 2019 & 2032
- Table 97: China Optical Coherence Tomography Devices Industry Revenue (Million) Forecast, by Application 2019 & 2032
- Table 98: China Optical Coherence Tomography Devices Industry Volume (K Unit) Forecast, by Application 2019 & 2032
- Table 99: Japan Optical Coherence Tomography Devices Industry Revenue (Million) Forecast, by Application 2019 & 2032
- Table 100: Japan Optical Coherence Tomography Devices Industry Volume (K Unit) Forecast, by Application 2019 & 2032
- Table 101: India Optical Coherence Tomography Devices Industry Revenue (Million) Forecast, by Application 2019 & 2032
- Table 102: India Optical Coherence Tomography Devices Industry Volume (K Unit) Forecast, by Application 2019 & 2032
- Table 103: Australia Optical Coherence Tomography Devices Industry Revenue (Million) Forecast, by Application 2019 & 2032
- Table 104: Australia Optical Coherence Tomography Devices Industry Volume (K Unit) Forecast, by Application 2019 & 2032
- Table 105: South Korea Optical Coherence Tomography Devices Industry Revenue (Million) Forecast, by Application 2019 & 2032
- Table 106: South Korea Optical Coherence Tomography Devices Industry Volume (K Unit) Forecast, by Application 2019 & 2032
- Table 107: Rest of Asia Pacific Optical Coherence Tomography Devices Industry Revenue (Million) Forecast, by Application 2019 & 2032
- Table 108: Rest of Asia Pacific Optical Coherence Tomography Devices Industry Volume (K Unit) Forecast, by Application 2019 & 2032
- Table 109: Global Optical Coherence Tomography Devices Industry Revenue Million Forecast, by Type 2019 & 2032
- Table 110: Global Optical Coherence Tomography Devices Industry Volume K Unit Forecast, by Type 2019 & 2032
- Table 111: Global Optical Coherence Tomography Devices Industry Revenue Million Forecast, by Application 2019 & 2032
- Table 112: Global Optical Coherence Tomography Devices Industry Volume K Unit Forecast, by Application 2019 & 2032
- Table 113: Global Optical Coherence Tomography Devices Industry Revenue Million Forecast, by Country 2019 & 2032
- Table 114: Global Optical Coherence Tomography Devices Industry Volume K Unit Forecast, by Country 2019 & 2032
- Table 115: GCC Optical Coherence Tomography Devices Industry Revenue (Million) Forecast, by Application 2019 & 2032
- Table 116: GCC Optical Coherence Tomography Devices Industry Volume (K Unit) Forecast, by Application 2019 & 2032
- Table 117: South Africa Optical Coherence Tomography Devices Industry Revenue (Million) Forecast, by Application 2019 & 2032
- Table 118: South Africa Optical Coherence Tomography Devices Industry Volume (K Unit) Forecast, by Application 2019 & 2032
- Table 119: Rest of Middle East and Africa Optical Coherence Tomography Devices Industry Revenue (Million) Forecast, by Application 2019 & 2032
- Table 120: Rest of Middle East and Africa Optical Coherence Tomography Devices Industry Volume (K Unit) Forecast, by Application 2019 & 2032
- Table 121: Global Optical Coherence Tomography Devices Industry Revenue Million Forecast, by Type 2019 & 2032
- Table 122: Global Optical Coherence Tomography Devices Industry Volume K Unit Forecast, by Type 2019 & 2032
- Table 123: Global Optical Coherence Tomography Devices Industry Revenue Million Forecast, by Application 2019 & 2032
- Table 124: Global Optical Coherence Tomography Devices Industry Volume K Unit Forecast, by Application 2019 & 2032
- Table 125: Global Optical Coherence Tomography Devices Industry Revenue Million Forecast, by Country 2019 & 2032
- Table 126: Global Optical Coherence Tomography Devices Industry Volume K Unit Forecast, by Country 2019 & 2032
- Table 127: Brazil Optical Coherence Tomography Devices Industry Revenue (Million) Forecast, by Application 2019 & 2032
- Table 128: Brazil Optical Coherence Tomography Devices Industry Volume (K Unit) Forecast, by Application 2019 & 2032
- Table 129: Argentina Optical Coherence Tomography Devices Industry Revenue (Million) Forecast, by Application 2019 & 2032
- Table 130: Argentina Optical Coherence Tomography Devices Industry Volume (K Unit) Forecast, by Application 2019 & 2032
- Table 131: Rest of South America Optical Coherence Tomography Devices Industry Revenue (Million) Forecast, by Application 2019 & 2032
- Table 132: Rest of South America Optical Coherence Tomography Devices Industry Volume (K Unit) Forecast, by Application 2019 & 2032
Frequently Asked Questions
1. What is the projected Compound Annual Growth Rate (CAGR) of the Optical Coherence Tomography Devices Industry?
The projected CAGR is approximately 10.20%.
2. Which companies are prominent players in the Optical Coherence Tomography Devices Industry?
Key companies in the market include Heidelberg Engineering Inc, Optovue Inc, Agfa Healthcare, Thorlabs, Carl Zeiss AG, Terumo Medical Corporation, Topcon Corporation, OPTOPOL Technology, Leica Microsystems (Danaher), Novacam Technologies.
3. What are the main segments of the Optical Coherence Tomography Devices Industry?
The market segments include Type, Application.
4. Can you provide details about the market size?
The market size is estimated to be USD XX Million as of 2022.
5. What are some drivers contributing to market growth?
Increasing Demand in Biomedical Application; Recent Technological Developments in Diagnostics.
6. What are the notable trends driving market growth?
Opthalmology by Application in Optical Coherence Tomography Market is Expected to Witness a Healthy Growth in Future..
7. Are there any restraints impacting market growth?
Reimbursement Policies.
8. Can you provide examples of recent developments in the market?
In April 2022, Alcon reinforced its training and education with the Alcon Fidelis Virtual Reality (VR) Ophthalmic Surgical Simulator, a portable VR tool for cataract surgeons in training.
9. What pricing options are available for accessing the report?
Pricing options include single-user, multi-user, and enterprise licenses priced at USD 4750, USD 5250, and USD 8750 respectively.
10. Is the market size provided in terms of value or volume?
The market size is provided in terms of value, measured in Million and volume, measured in K Unit.
11. Are there any specific market keywords associated with the report?
Yes, the market keyword associated with the report is "Optical Coherence Tomography Devices Industry," which aids in identifying and referencing the specific market segment covered.
12. How do I determine which pricing option suits my needs best?
The pricing options vary based on user requirements and access needs. Individual users may opt for single-user licenses, while businesses requiring broader access may choose multi-user or enterprise licenses for cost-effective access to the report.
13. Are there any additional resources or data provided in the Optical Coherence Tomography Devices Industry report?
While the report offers comprehensive insights, it's advisable to review the specific contents or supplementary materials provided to ascertain if additional resources or data are available.
14. How can I stay updated on further developments or reports in the Optical Coherence Tomography Devices Industry?
To stay informed about further developments, trends, and reports in the Optical Coherence Tomography Devices Industry, consider subscribing to industry newsletters, following relevant companies and organizations, or regularly checking reputable industry news sources and publications.
Methodology
Step 1 - Identification of Relevant Samples Size from Population Database


Step 2 - Approaches for Defining Global Market Size (Value, Volume* & Price*)

Note*: In applicable scenarios
Step 3 - Data Sources
Primary Research
- Web Analytics
- Survey Reports
- Research Institute
- Latest Research Reports
- Opinion Leaders
Secondary Research
- Annual Reports
- White Paper
- Latest Press Release
- Industry Association
- Paid Database
- Investor Presentations

Step 4 - Data Triangulation
Involves using different sources of information in order to increase the validity of a study
These sources are likely to be stakeholders in a program - participants, other researchers, program staff, other community members, and so on.
Then we put all data in single framework & apply various statistical tools to find out the dynamic on the market.
During the analysis stage, feedback from the stakeholder groups would be compared to determine areas of agreement as well as areas of divergence
