

Key Insights
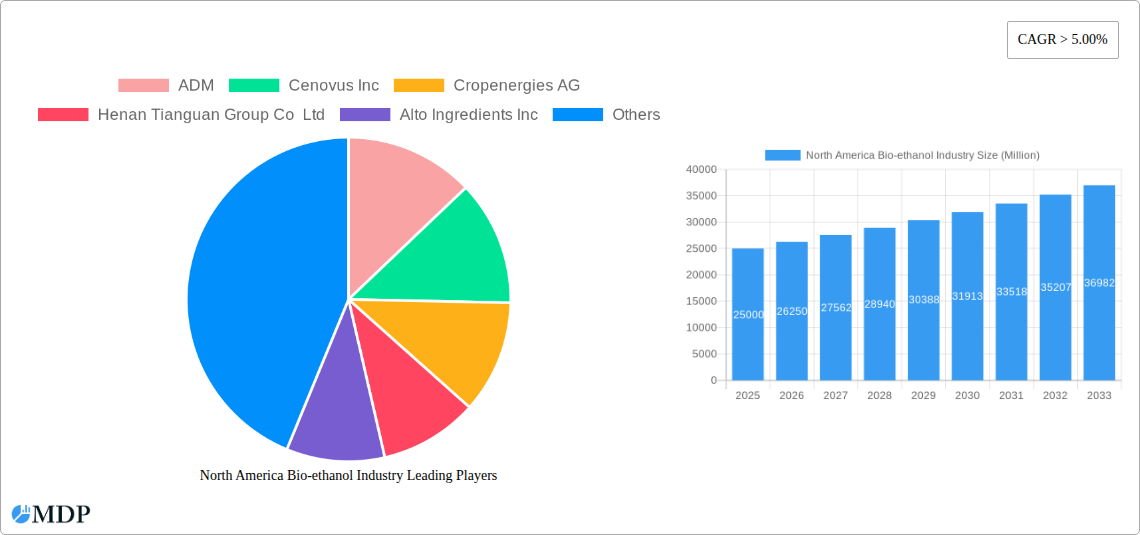
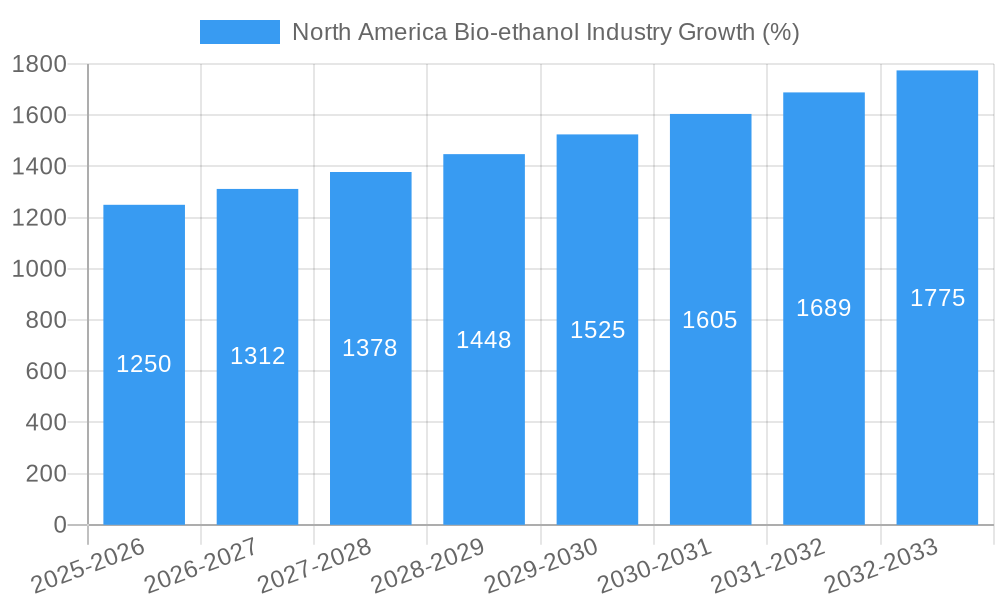
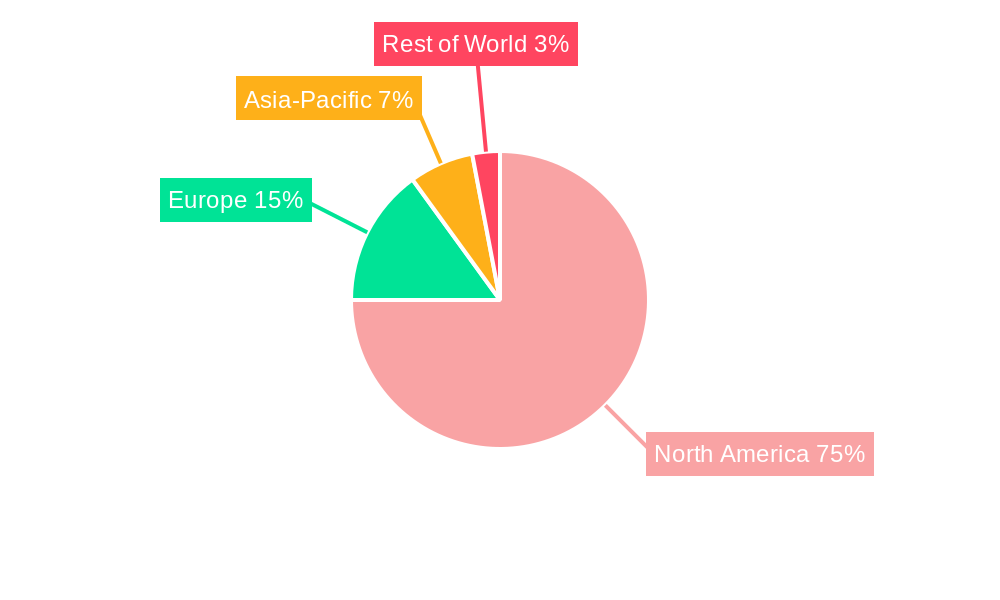
The North American bioethanol industry, currently valued at an estimated $25 billion in 2025, is experiencing robust growth, projected to maintain a Compound Annual Growth Rate (CAGR) exceeding 5% through 2033. This expansion is driven primarily by increasing demand from the automotive and transportation sectors, fueled by stringent emission regulations and the growing adoption of flex-fuel vehicles. The food and beverage industry also contributes significantly to bioethanol consumption, leveraging its use as a sweetener and food additive. Furthermore, emerging applications in pharmaceuticals and cosmetics are steadily expanding the market's scope. Sugarcane, corn, and wheat remain the dominant feedstocks, though research into alternative feedstocks, like agricultural residues, is gaining momentum, promising a more sustainable future. While the industry faces challenges such as fluctuating feedstock prices and competition from other renewable fuels, the overall outlook remains positive, bolstered by government incentives promoting renewable energy sources and a growing consumer preference for environmentally friendly products. The United States dominates the North American market, leveraging its vast agricultural resources and established infrastructure. However, Canada and Mexico are also experiencing growth, driven by increasing investments in biofuel production facilities and supportive government policies.
The competitive landscape is characterized by a mix of large multinational corporations like ADM and smaller regional players. This dynamic environment fosters innovation and competition, ultimately benefiting consumers through increased availability and potentially lower prices. The industry's success hinges on continued research and development, focusing on improving efficiency, reducing costs, and exploring more sustainable feedstock options. Technological advancements, such as improved fermentation processes and the development of cellulosic ethanol, will play a crucial role in shaping the future of the North American bioethanol market. The forecast period reveals a continuous expansion, with projected market sizes reflecting a positive growth trajectory across all major segments and applications, driven by sustained demand and technological innovations.
North America Bio-ethanol Industry: A Comprehensive Market Report (2019-2033)
This comprehensive report provides an in-depth analysis of the North America bio-ethanol industry, covering market dynamics, trends, leading players, and future opportunities. With a study period spanning 2019-2033, a base year of 2025, and a forecast period of 2025-2033, this report is an essential resource for industry stakeholders, investors, and researchers seeking actionable insights into this dynamic sector. The report leverages extensive data and analysis to provide a clear picture of current market conditions and future growth prospects. Expect detailed breakdowns of market segments, competitor landscapes, and crucial industry developments.
North America Bio-ethanol Industry Market Dynamics & Concentration
The North America bio-ethanol market exhibits a moderately concentrated structure, with several major players commanding significant market share. The industry's dynamics are shaped by several key factors. Innovation, driven by advancements in feedstock utilization and production efficiency, plays a critical role. Regulatory frameworks, including government incentives and emission standards, significantly influence market growth and investment decisions. Product substitutes, such as gasoline and other biofuels, present competitive pressures. Furthermore, end-user trends, particularly the growing demand for sustainable transportation fuels, are a crucial driver. Mergers and acquisitions (M&A) activity has been significant, with xx major deals recorded between 2019 and 2024, leading to market consolidation and reshaping the competitive landscape. Market share analysis reveals that the top 5 players collectively hold approximately xx% of the market, while the remaining share is distributed among numerous smaller players.
North America Bio-ethanol Industry Industry Trends & Analysis
The North America bio-ethanol market demonstrates robust growth, with a projected Compound Annual Growth Rate (CAGR) of xx% during the forecast period (2025-2033). Market penetration is increasing steadily, driven by factors such as stringent environmental regulations, increasing consumer awareness of sustainable alternatives, and government support for biofuel mandates. Technological disruptions, including advancements in enzyme technology and fermentation processes, are improving efficiency and reducing production costs. Shifting consumer preferences towards environmentally friendly products and the growing adoption of flexible fuel vehicles are also contributing to market expansion. Competitive dynamics are characterized by intense competition among established players and emerging companies, particularly in areas such as cellulosic ethanol production.
Leading Markets & Segments in North America Bio-ethanol Industry
- Dominant Feedstock: Corn remains the dominant feedstock, accounting for approximately xx% of total production, due to its widespread availability and established infrastructure.
- Leading Application: The automotive and transportation sector is the primary end-use segment, consuming approximately xx% of the total bio-ethanol production, driven by government mandates and growing demand for renewable fuels.
Key Drivers:
- Economic Policies: Government subsidies and tax credits for biofuel production stimulate growth.
- Infrastructure: Existing ethanol infrastructure in the US supports production and distribution.
- Regional Dominance: The United States remains the leading market, benefiting from large-scale corn production and established biorefineries.
Corn's dominance stems from its abundant supply and established infrastructure within North America, making it a cost-effective option. While sugarcane and wheat contribute to the industry, their production and processing costs are higher relative to corn-based ethanol, limiting their overall market share. The automotive and transportation segment's leadership is propelled by government mandates and the increasing preference for biofuels as a sustainable alternative to gasoline.
North America Bio-ethanol Industry Product Developments
Recent product innovations focus on improving efficiency, reducing costs, and expanding applications. Advancements in cellulosic ethanol technology are enabling the production of bioethanol from non-food sources like agricultural residues. The development of bio-based chemicals derived from ethanol is also gaining traction, opening up opportunities in diverse sectors such as pharmaceuticals and cosmetics. These innovations are enhancing the competitive advantage of bio-ethanol producers by offering cost-effective and sustainable solutions.
Key Drivers of North America Bio-ethanol Industry Growth
Several factors propel the growth of the North America bio-ethanol industry. Government regulations mandating higher biofuel blends in gasoline are a primary driver. Technological advancements, such as improved fermentation techniques and enzyme efficiency, are reducing production costs. Finally, increasing consumer awareness of environmental sustainability and the demand for cleaner transportation fuels further fuel market expansion.
Challenges in the North America Bio-ethanol Industry Market
The industry faces challenges such as fluctuating feedstock prices, impacting profitability. Competition from other renewable fuels and gasoline remains a factor, alongside concerns regarding land use and water consumption in feedstock production. Furthermore, the intermittent nature of corn production and adverse weather conditions may also negatively affect production. These challenges collectively restrain the industry's growth to some extent.
Emerging Opportunities in North America Bio-ethanol Industry
The industry is poised for significant growth fueled by advancements in cellulosic ethanol technology, expanding the range of available feedstocks. Strategic partnerships between bio-ethanol producers and other industries, like chemical manufacturers, are creating new market opportunities. The expansion of bio-ethanol applications beyond transportation fuel, into chemicals and materials, further strengthens long-term growth potential.
Leading Players in the North America Bio-ethanol Industry Sector
- ADM
- Cenovus Inc
- Cropenergies AG
- Henan Tianguan Group Co Ltd
- Alto Ingredients Inc
- Green Plains Inc
- Suncor Energy Inc
- Valero
- Ethanol Technologies
- Verbio Vereinigte Bioenergie AG
- Abengoa
- Granbio Investimentos SA
- Sekab
- Blue Bio Fuels Inc
- Lantmannen
- Cristalco
- Poet LLC
- Jilin Fuel Ethanol Co Ltd
- Raizen
- KWST
Key Milestones in North America Bio-ethanol Industry Industry
- May 2022: VERBIO AG launched the first cellulosic RNG plant in the US, producing 7 Million EGE of RNG annually by mid-summer, and projected to produce 60 Million gallons of corn-based ethanol annually by 2023. This significantly expands the industry's capacity and demonstrates technological advancements.
- October 2021: ADM's sale of its Peoria ethanol plant to BioUrja Group signals industry consolidation and strategic shifts towards optimizing asset portfolios.
Strategic Outlook for North America Bio-ethanol Industry Market
The North America bio-ethanol market is poised for sustained growth driven by government support, technological advancements, and growing environmental concerns. Strategic opportunities lie in expanding into cellulosic ethanol, diversifying applications beyond transportation fuels, and developing sustainable feedstock sourcing practices. The market's future hinges on addressing challenges related to feedstock cost volatility and improving the overall sustainability of bio-ethanol production.
North America Bio-ethanol Industry Segmentation
-
1. Feedstock Type
- 1.1. Sugarcane
- 1.2. Corn
- 1.3. Wheat
- 1.4. Other Feedstocks
-
2. Application
- 2.1. Automotive and Transportation
- 2.2. Food and Beverage
- 2.3. Pharmaceutical
- 2.4. Cosmetics and Personal Care
- 2.5. Other Applications
-
3. Geography
- 3.1. United States
- 3.2. Canada
- 3.3. Mexico
North America Bio-ethanol Industry Segmentation By Geography
- 1. United States
- 2. Canada
- 3. Mexico
North America Bio-ethanol Industry REPORT HIGHLIGHTS
| Aspects | Details |
|---|---|
| Study Period | 2019-2033 |
| Base Year | 2024 |
| Estimated Year | 2025 |
| Forecast Period | 2025-2033 |
| Historical Period | 2019-2024 |
| Growth Rate | CAGR of > 5.00% from 2019-2033 |
| Segmentation |
|
Table of Contents
- 1. Introduction
- 1.1. Research Scope
- 1.2. Market Segmentation
- 1.3. Research Methodology
- 1.4. Definitions and Assumptions
- 2. Executive Summary
- 2.1. Introduction
- 3. Market Dynamics
- 3.1. Introduction
- 3.2. Market Drivers
- 3.2.1. Increasing Favorable Initiatives and Blending Mandates by Regulatory Bodies; Rising Environmental Concerns by the Use of Fossil Fuels and Need for the Bio-fuels
- 3.3. Market Restrains
- 3.3.1. Phasing out of Fuel-based Vehicles Due to Rising Demand for Electric Vehicles; Shifting Focus to Bio-butanol
- 3.4. Market Trends
- 3.4.1. Automotive and Transportation Segment to Dominate the Market
- 4. Market Factor Analysis
- 4.1. Porters Five Forces
- 4.2. Supply/Value Chain
- 4.3. PESTEL analysis
- 4.4. Market Entropy
- 4.5. Patent/Trademark Analysis
- 5. North America Bio-ethanol Industry Analysis, Insights and Forecast, 2019-2031
- 5.1. Market Analysis, Insights and Forecast - by Feedstock Type
- 5.1.1. Sugarcane
- 5.1.2. Corn
- 5.1.3. Wheat
- 5.1.4. Other Feedstocks
- 5.2. Market Analysis, Insights and Forecast - by Application
- 5.2.1. Automotive and Transportation
- 5.2.2. Food and Beverage
- 5.2.3. Pharmaceutical
- 5.2.4. Cosmetics and Personal Care
- 5.2.5. Other Applications
- 5.3. Market Analysis, Insights and Forecast - by Geography
- 5.3.1. United States
- 5.3.2. Canada
- 5.3.3. Mexico
- 5.4. Market Analysis, Insights and Forecast - by Region
- 5.4.1. United States
- 5.4.2. Canada
- 5.4.3. Mexico
- 5.1. Market Analysis, Insights and Forecast - by Feedstock Type
- 6. United States North America Bio-ethanol Industry Analysis, Insights and Forecast, 2019-2031
- 6.1. Market Analysis, Insights and Forecast - by Feedstock Type
- 6.1.1. Sugarcane
- 6.1.2. Corn
- 6.1.3. Wheat
- 6.1.4. Other Feedstocks
- 6.2. Market Analysis, Insights and Forecast - by Application
- 6.2.1. Automotive and Transportation
- 6.2.2. Food and Beverage
- 6.2.3. Pharmaceutical
- 6.2.4. Cosmetics and Personal Care
- 6.2.5. Other Applications
- 6.3. Market Analysis, Insights and Forecast - by Geography
- 6.3.1. United States
- 6.3.2. Canada
- 6.3.3. Mexico
- 6.1. Market Analysis, Insights and Forecast - by Feedstock Type
- 7. Canada North America Bio-ethanol Industry Analysis, Insights and Forecast, 2019-2031
- 7.1. Market Analysis, Insights and Forecast - by Feedstock Type
- 7.1.1. Sugarcane
- 7.1.2. Corn
- 7.1.3. Wheat
- 7.1.4. Other Feedstocks
- 7.2. Market Analysis, Insights and Forecast - by Application
- 7.2.1. Automotive and Transportation
- 7.2.2. Food and Beverage
- 7.2.3. Pharmaceutical
- 7.2.4. Cosmetics and Personal Care
- 7.2.5. Other Applications
- 7.3. Market Analysis, Insights and Forecast - by Geography
- 7.3.1. United States
- 7.3.2. Canada
- 7.3.3. Mexico
- 7.1. Market Analysis, Insights and Forecast - by Feedstock Type
- 8. Mexico North America Bio-ethanol Industry Analysis, Insights and Forecast, 2019-2031
- 8.1. Market Analysis, Insights and Forecast - by Feedstock Type
- 8.1.1. Sugarcane
- 8.1.2. Corn
- 8.1.3. Wheat
- 8.1.4. Other Feedstocks
- 8.2. Market Analysis, Insights and Forecast - by Application
- 8.2.1. Automotive and Transportation
- 8.2.2. Food and Beverage
- 8.2.3. Pharmaceutical
- 8.2.4. Cosmetics and Personal Care
- 8.2.5. Other Applications
- 8.3. Market Analysis, Insights and Forecast - by Geography
- 8.3.1. United States
- 8.3.2. Canada
- 8.3.3. Mexico
- 8.1. Market Analysis, Insights and Forecast - by Feedstock Type
- 9. United States North America Bio-ethanol Industry Analysis, Insights and Forecast, 2019-2031
- 10. Canada North America Bio-ethanol Industry Analysis, Insights and Forecast, 2019-2031
- 11. Mexico North America Bio-ethanol Industry Analysis, Insights and Forecast, 2019-2031
- 12. Rest of North America North America Bio-ethanol Industry Analysis, Insights and Forecast, 2019-2031
- 13. Competitive Analysis
- 13.1. Market Share Analysis 2024
- 13.2. Company Profiles
- 13.2.1 ADM
- 13.2.1.1. Overview
- 13.2.1.2. Products
- 13.2.1.3. SWOT Analysis
- 13.2.1.4. Recent Developments
- 13.2.1.5. Financials (Based on Availability)
- 13.2.2 Cenovus Inc
- 13.2.2.1. Overview
- 13.2.2.2. Products
- 13.2.2.3. SWOT Analysis
- 13.2.2.4. Recent Developments
- 13.2.2.5. Financials (Based on Availability)
- 13.2.3 Cropenergies AG
- 13.2.3.1. Overview
- 13.2.3.2. Products
- 13.2.3.3. SWOT Analysis
- 13.2.3.4. Recent Developments
- 13.2.3.5. Financials (Based on Availability)
- 13.2.4 Henan Tianguan Group Co Ltd
- 13.2.4.1. Overview
- 13.2.4.2. Products
- 13.2.4.3. SWOT Analysis
- 13.2.4.4. Recent Developments
- 13.2.4.5. Financials (Based on Availability)
- 13.2.5 Alto Ingredients Inc
- 13.2.5.1. Overview
- 13.2.5.2. Products
- 13.2.5.3. SWOT Analysis
- 13.2.5.4. Recent Developments
- 13.2.5.5. Financials (Based on Availability)
- 13.2.6 Green Plains Inc
- 13.2.6.1. Overview
- 13.2.6.2. Products
- 13.2.6.3. SWOT Analysis
- 13.2.6.4. Recent Developments
- 13.2.6.5. Financials (Based on Availability)
- 13.2.7 Suncor Energy Inc
- 13.2.7.1. Overview
- 13.2.7.2. Products
- 13.2.7.3. SWOT Analysis
- 13.2.7.4. Recent Developments
- 13.2.7.5. Financials (Based on Availability)
- 13.2.8 Valero
- 13.2.8.1. Overview
- 13.2.8.2. Products
- 13.2.8.3. SWOT Analysis
- 13.2.8.4. Recent Developments
- 13.2.8.5. Financials (Based on Availability)
- 13.2.9 Ethanol Technologies
- 13.2.9.1. Overview
- 13.2.9.2. Products
- 13.2.9.3. SWOT Analysis
- 13.2.9.4. Recent Developments
- 13.2.9.5. Financials (Based on Availability)
- 13.2.10 Verbio Vereinigte Bioenergie AG*List Not Exhaustive
- 13.2.10.1. Overview
- 13.2.10.2. Products
- 13.2.10.3. SWOT Analysis
- 13.2.10.4. Recent Developments
- 13.2.10.5. Financials (Based on Availability)
- 13.2.11 Abengoa
- 13.2.11.1. Overview
- 13.2.11.2. Products
- 13.2.11.3. SWOT Analysis
- 13.2.11.4. Recent Developments
- 13.2.11.5. Financials (Based on Availability)
- 13.2.12 Granbio Investimentos SA
- 13.2.12.1. Overview
- 13.2.12.2. Products
- 13.2.12.3. SWOT Analysis
- 13.2.12.4. Recent Developments
- 13.2.12.5. Financials (Based on Availability)
- 13.2.13 Sekab
- 13.2.13.1. Overview
- 13.2.13.2. Products
- 13.2.13.3. SWOT Analysis
- 13.2.13.4. Recent Developments
- 13.2.13.5. Financials (Based on Availability)
- 13.2.14 Blue Bio Fuels Inc
- 13.2.14.1. Overview
- 13.2.14.2. Products
- 13.2.14.3. SWOT Analysis
- 13.2.14.4. Recent Developments
- 13.2.14.5. Financials (Based on Availability)
- 13.2.15 Lantmannen
- 13.2.15.1. Overview
- 13.2.15.2. Products
- 13.2.15.3. SWOT Analysis
- 13.2.15.4. Recent Developments
- 13.2.15.5. Financials (Based on Availability)
- 13.2.16 Cristalco
- 13.2.16.1. Overview
- 13.2.16.2. Products
- 13.2.16.3. SWOT Analysis
- 13.2.16.4. Recent Developments
- 13.2.16.5. Financials (Based on Availability)
- 13.2.17 Poet LLC
- 13.2.17.1. Overview
- 13.2.17.2. Products
- 13.2.17.3. SWOT Analysis
- 13.2.17.4. Recent Developments
- 13.2.17.5. Financials (Based on Availability)
- 13.2.18 Jilin Fuel Ethanol Co Ltd
- 13.2.18.1. Overview
- 13.2.18.2. Products
- 13.2.18.3. SWOT Analysis
- 13.2.18.4. Recent Developments
- 13.2.18.5. Financials (Based on Availability)
- 13.2.19 Raizen
- 13.2.19.1. Overview
- 13.2.19.2. Products
- 13.2.19.3. SWOT Analysis
- 13.2.19.4. Recent Developments
- 13.2.19.5. Financials (Based on Availability)
- 13.2.20 KWST
- 13.2.20.1. Overview
- 13.2.20.2. Products
- 13.2.20.3. SWOT Analysis
- 13.2.20.4. Recent Developments
- 13.2.20.5. Financials (Based on Availability)
- 13.2.1 ADM
List of Figures
- Figure 1: North America Bio-ethanol Industry Revenue Breakdown (Million, %) by Product 2024 & 2032
- Figure 2: North America Bio-ethanol Industry Share (%) by Company 2024
List of Tables
- Table 1: North America Bio-ethanol Industry Revenue Million Forecast, by Region 2019 & 2032
- Table 2: North America Bio-ethanol Industry Revenue Million Forecast, by Feedstock Type 2019 & 2032
- Table 3: North America Bio-ethanol Industry Revenue Million Forecast, by Application 2019 & 2032
- Table 4: North America Bio-ethanol Industry Revenue Million Forecast, by Geography 2019 & 2032
- Table 5: North America Bio-ethanol Industry Revenue Million Forecast, by Region 2019 & 2032
- Table 6: North America Bio-ethanol Industry Revenue Million Forecast, by Country 2019 & 2032
- Table 7: United States North America Bio-ethanol Industry Revenue (Million) Forecast, by Application 2019 & 2032
- Table 8: Canada North America Bio-ethanol Industry Revenue (Million) Forecast, by Application 2019 & 2032
- Table 9: Mexico North America Bio-ethanol Industry Revenue (Million) Forecast, by Application 2019 & 2032
- Table 10: Rest of North America North America Bio-ethanol Industry Revenue (Million) Forecast, by Application 2019 & 2032
- Table 11: North America Bio-ethanol Industry Revenue Million Forecast, by Feedstock Type 2019 & 2032
- Table 12: North America Bio-ethanol Industry Revenue Million Forecast, by Application 2019 & 2032
- Table 13: North America Bio-ethanol Industry Revenue Million Forecast, by Geography 2019 & 2032
- Table 14: North America Bio-ethanol Industry Revenue Million Forecast, by Country 2019 & 2032
- Table 15: North America Bio-ethanol Industry Revenue Million Forecast, by Feedstock Type 2019 & 2032
- Table 16: North America Bio-ethanol Industry Revenue Million Forecast, by Application 2019 & 2032
- Table 17: North America Bio-ethanol Industry Revenue Million Forecast, by Geography 2019 & 2032
- Table 18: North America Bio-ethanol Industry Revenue Million Forecast, by Country 2019 & 2032
- Table 19: North America Bio-ethanol Industry Revenue Million Forecast, by Feedstock Type 2019 & 2032
- Table 20: North America Bio-ethanol Industry Revenue Million Forecast, by Application 2019 & 2032
- Table 21: North America Bio-ethanol Industry Revenue Million Forecast, by Geography 2019 & 2032
- Table 22: North America Bio-ethanol Industry Revenue Million Forecast, by Country 2019 & 2032
Frequently Asked Questions
1. What is the projected Compound Annual Growth Rate (CAGR) of the North America Bio-ethanol Industry?
The projected CAGR is approximately > 5.00%.
2. Which companies are prominent players in the North America Bio-ethanol Industry?
Key companies in the market include ADM, Cenovus Inc, Cropenergies AG, Henan Tianguan Group Co Ltd, Alto Ingredients Inc, Green Plains Inc, Suncor Energy Inc, Valero, Ethanol Technologies, Verbio Vereinigte Bioenergie AG*List Not Exhaustive, Abengoa, Granbio Investimentos SA, Sekab, Blue Bio Fuels Inc, Lantmannen, Cristalco, Poet LLC, Jilin Fuel Ethanol Co Ltd, Raizen, KWST.
3. What are the main segments of the North America Bio-ethanol Industry?
The market segments include Feedstock Type, Application, Geography.
4. Can you provide details about the market size?
The market size is estimated to be USD XX Million as of 2022.
5. What are some drivers contributing to market growth?
Increasing Favorable Initiatives and Blending Mandates by Regulatory Bodies; Rising Environmental Concerns by the Use of Fossil Fuels and Need for the Bio-fuels.
6. What are the notable trends driving market growth?
Automotive and Transportation Segment to Dominate the Market.
7. Are there any restraints impacting market growth?
Phasing out of Fuel-based Vehicles Due to Rising Demand for Electric Vehicles; Shifting Focus to Bio-butanol.
8. Can you provide examples of recent developments in the market?
May 2022: VERBIO AG opened the first cellulosic RNG plant in the United States, achieving full-scale production of 7 million ethanol gallons equivalent (EGE) of RNG annually by mid-summer 2022. In 2023, this project is expected to start functioning as a biorefinery, producing 60 million gallons of corn-based ethanol annually.
9. What pricing options are available for accessing the report?
Pricing options include single-user, multi-user, and enterprise licenses priced at USD 4750, USD 5250, and USD 8750 respectively.
10. Is the market size provided in terms of value or volume?
The market size is provided in terms of value, measured in Million.
11. Are there any specific market keywords associated with the report?
Yes, the market keyword associated with the report is "North America Bio-ethanol Industry," which aids in identifying and referencing the specific market segment covered.
12. How do I determine which pricing option suits my needs best?
The pricing options vary based on user requirements and access needs. Individual users may opt for single-user licenses, while businesses requiring broader access may choose multi-user or enterprise licenses for cost-effective access to the report.
13. Are there any additional resources or data provided in the North America Bio-ethanol Industry report?
While the report offers comprehensive insights, it's advisable to review the specific contents or supplementary materials provided to ascertain if additional resources or data are available.
14. How can I stay updated on further developments or reports in the North America Bio-ethanol Industry?
To stay informed about further developments, trends, and reports in the North America Bio-ethanol Industry, consider subscribing to industry newsletters, following relevant companies and organizations, or regularly checking reputable industry news sources and publications.
Methodology
Step 1 - Identification of Relevant Samples Size from Population Database


Step 2 - Approaches for Defining Global Market Size (Value, Volume* & Price*)

Note*: In applicable scenarios
Step 3 - Data Sources
Primary Research
- Web Analytics
- Survey Reports
- Research Institute
- Latest Research Reports
- Opinion Leaders
Secondary Research
- Annual Reports
- White Paper
- Latest Press Release
- Industry Association
- Paid Database
- Investor Presentations

Step 4 - Data Triangulation
Involves using different sources of information in order to increase the validity of a study
These sources are likely to be stakeholders in a program - participants, other researchers, program staff, other community members, and so on.
Then we put all data in single framework & apply various statistical tools to find out the dynamic on the market.
During the analysis stage, feedback from the stakeholder groups would be compared to determine areas of agreement as well as areas of divergence
