

Key Insights
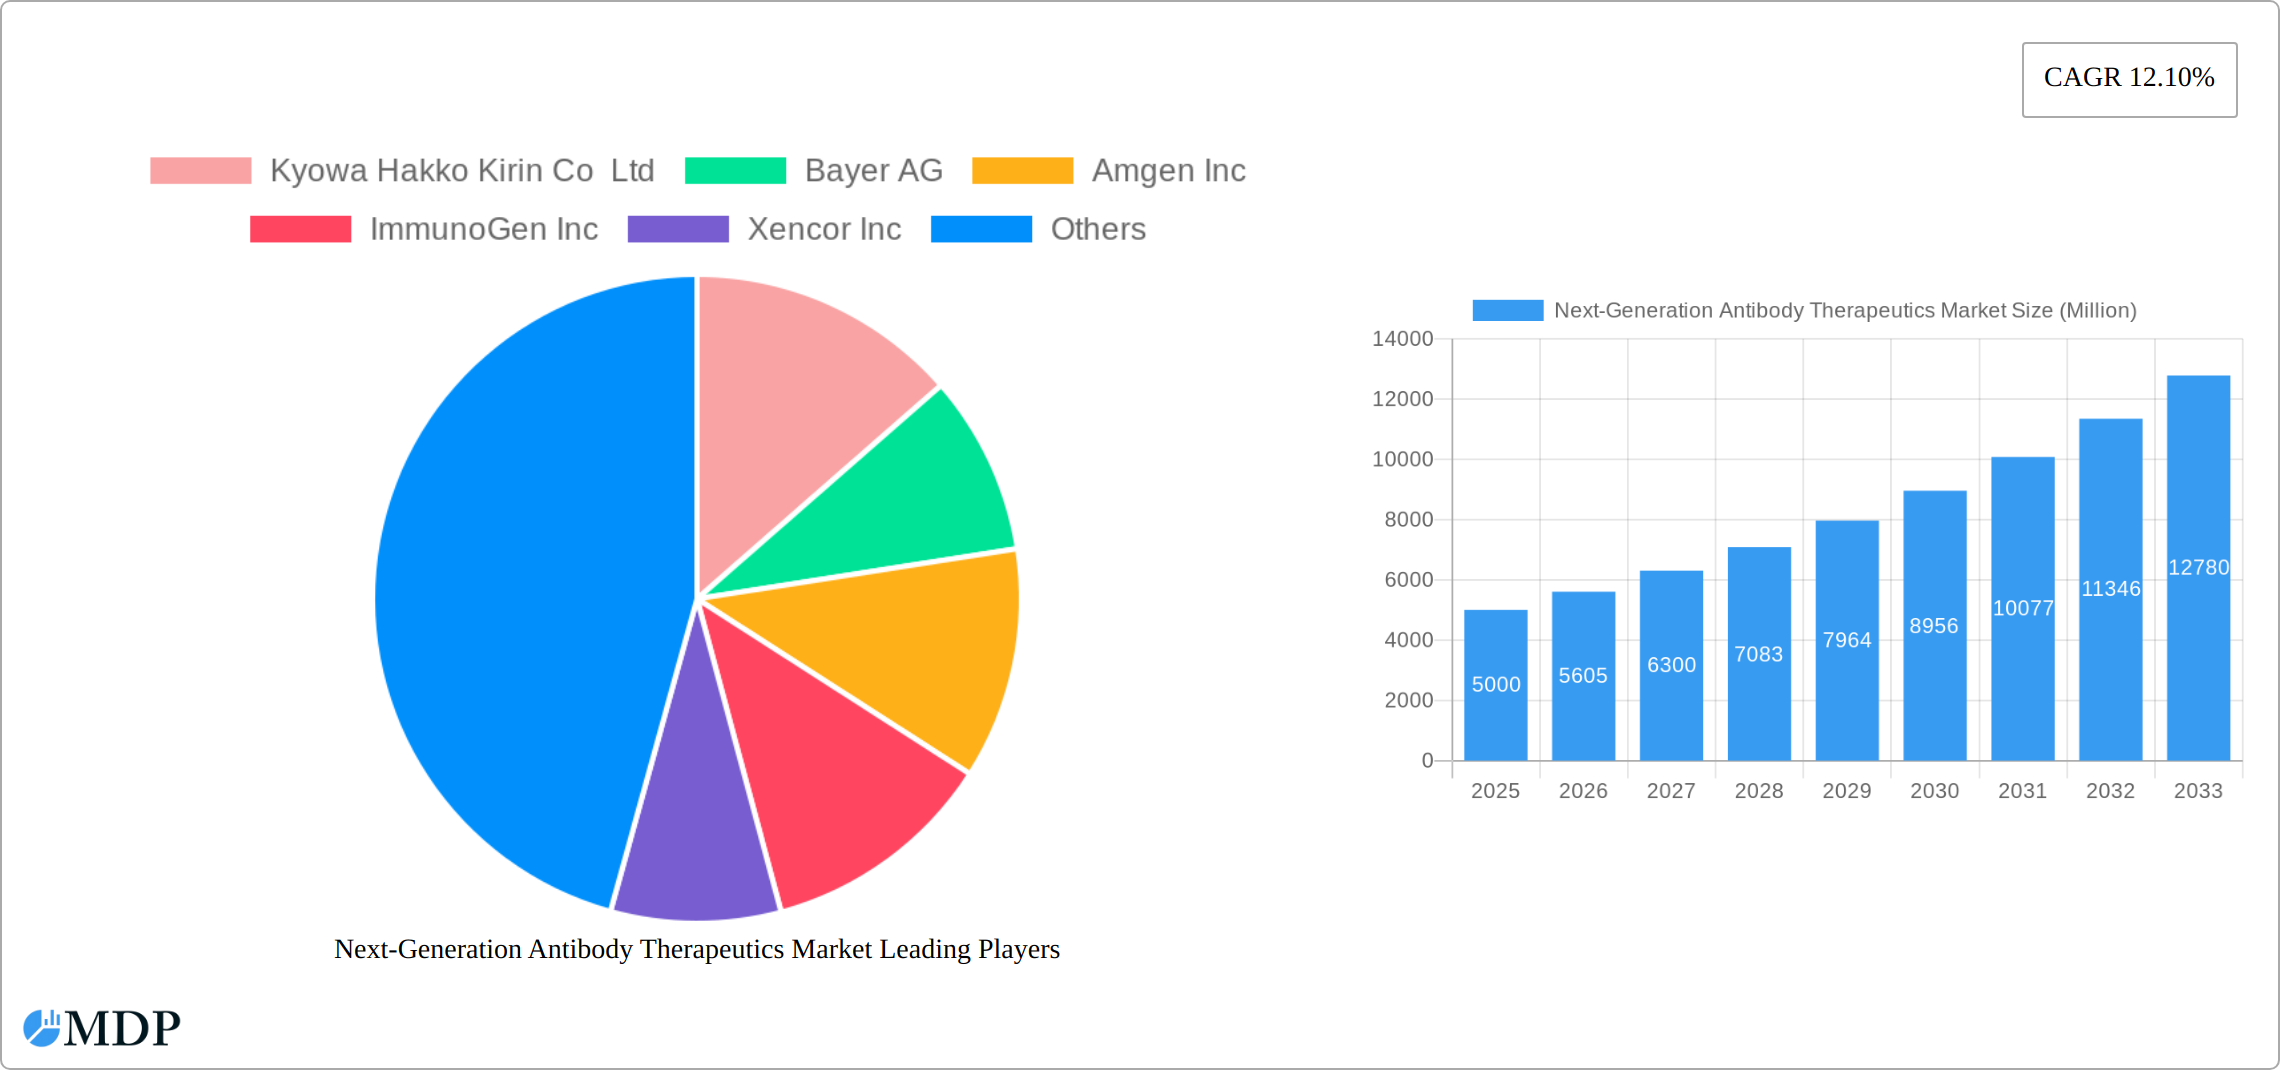
The Next-Generation Antibody Therapeutics market is experiencing robust growth, projected to reach a substantial size by 2033, driven by a 12.10% CAGR from 2025. This expansion is fueled by several key factors. Firstly, the increasing prevalence of chronic diseases like cancer and autoimmune disorders is creating a significant demand for more effective and targeted therapies. Next-generation antibody therapeutics, including Antibody-Drug Conjugates (ADCs), Bispecific Antibodies (BsAbs), and Fc-Engineered Antibodies, offer superior efficacy and reduced side effects compared to traditional antibody treatments, thus driving market adoption. Technological advancements leading to improved drug delivery systems and enhanced antibody engineering techniques further contribute to this growth. The Oncology therapeutic area is currently dominating the market, followed by Autoimmune/Inflammatory diseases, reflecting the high unmet medical need in these areas. Competition among major pharmaceutical companies like Amgen, Roche, and Bristol Myers Squibb is intensifying, with significant investments in R&D and strategic collaborations accelerating the market's trajectory. North America and Europe currently hold the largest market share, owing to advanced healthcare infrastructure and higher adoption rates of novel therapies. However, the Asia-Pacific region is expected to witness significant growth in the coming years, driven by increasing healthcare expenditure and rising prevalence of target diseases.
The market segmentation reveals a diverse landscape. While ADCs are currently leading the technology segment, BsAbs and Fc-engineered antibodies are rapidly gaining traction due to their enhanced therapeutic potential. The market is also characterized by a strong focus on biosimilar antibody products, offering cost-effective alternatives and widening access to these advanced therapies. Regulatory approvals and reimbursement policies play a crucial role in shaping market dynamics. Furthermore, ongoing clinical trials exploring novel antibody formats and applications are expected to further fuel market expansion in the forecast period. The identified restraints mainly include high development costs associated with these complex therapies and potential challenges related to manufacturing and scalability. Nevertheless, the overall market outlook remains highly positive, with promising prospects for continuous innovation and growth in the next-generation antibody therapeutics market.
Next-Generation Antibody Therapeutics Market: A Comprehensive Report (2019-2033)
This comprehensive report provides a detailed analysis of the Next-Generation Antibody Therapeutics market, offering invaluable insights for industry stakeholders, investors, and researchers. With a study period spanning 2019-2033, a base year of 2025, and a forecast period of 2025-2033, this report leverages extensive data analysis to project market growth and identify key trends. The market is segmented by therapeutic area (Oncology, Autoimmune/Inflammatory) and technology (Antibody-Drug Conjugates (ADCs), Bispecific Antibodies (BsAbs), Fc-Engineered Antibodies, Antibody Fragments and Antibody-Like Proteins (AF & ALPs), Biosimilar Antibody Products), providing a granular understanding of market dynamics. Key players such as Kyowa Hakko Kirin Co Ltd, Bayer AG, Amgen Inc, ImmunoGen Inc, Xencor Inc, F Hoffmann-La Roche Ltd, GlaxoSmithKline Plc, Biogen, AstraZeneca Plc, Seagen Inc, Bristol-Myers Squibb Company, and Pfizer Inc. are analyzed for their market share, strategic initiatives and competitive positioning. The report also covers significant industry milestones and future growth opportunities.
Next-Generation Antibody Therapeutics Market Market Dynamics & Concentration
The Next-Generation Antibody Therapeutics market is characterized by high concentration among leading pharmaceutical and biotechnology companies. Market share is largely determined by successful R&D, regulatory approvals, and effective commercialization strategies. Innovation is a key driver, with companies continuously developing novel antibody formats and therapeutic approaches. Stringent regulatory frameworks, particularly for biologics, pose significant challenges, influencing the speed of product development and market entry. The market witnesses considerable M&A activity, reflecting the industry's focus on expanding portfolios and acquiring cutting-edge technologies. Several factors contribute to this intense competitive landscape:
- High R&D Costs: The development of next-generation antibody therapeutics involves significant investment in research, clinical trials, and manufacturing, creating a barrier to entry for smaller players.
- Regulatory Hurdles: The stringent regulatory landscape and complex approval processes for biologics add to the challenges in bringing new products to the market.
- Patent Expiry: The expiration of patents on existing antibody drugs creates opportunities for biosimilar development and market competition.
- Technological Advancements: Continuous breakthroughs in antibody engineering, drug delivery systems, and target identification are driving market innovation and expansion.
The market concentration is expected to remain relatively high, with the top 10 players holding approximately xx% of the market share in 2025. M&A deal counts averaged xx per year during the historical period (2019-2024), reflecting the dynamic nature of the industry. This trend is projected to continue, driven by the need for companies to consolidate their market position and acquire promising technologies. Furthermore, end-user trends increasingly favor targeted therapies with reduced side effects, fueling demand for next-generation antibody therapeutics.
Next-Generation Antibody Therapeutics Market Industry Trends & Analysis
The Next-Generation Antibody Therapeutics market exhibits robust growth, projected to reach xx Million by 2033, with a CAGR of xx% during the forecast period (2025-2033). This growth is fueled by several key factors:
- Rising Prevalence of Chronic Diseases: The increasing incidence of cancer, autoimmune disorders, and infectious diseases drives the demand for effective and targeted therapies.
- Technological Advancements: Continuous innovations in antibody engineering, such as the development of ADCs, BsAbs, and Fc-engineered antibodies, expand treatment options and improve therapeutic efficacy.
- Increased Investment in R&D: Pharmaceutical and biotechnology companies are investing heavily in R&D to develop novel antibody therapeutics, fostering market growth.
- Favorable Regulatory Environment: The supportive regulatory environment in key markets facilitates the approval and commercialization of new antibody therapies.
Market penetration of next-generation antibody therapeutics is increasing, particularly in oncology, where these therapies are becoming the standard of care for several cancer types. Consumer preferences are shifting toward targeted therapies with improved safety profiles and higher efficacy. Competitive dynamics are characterized by intense rivalry among leading pharmaceutical and biotechnology companies, spurring innovation and price competition. However, challenges remain, including high development costs and the complexity of manufacturing antibody-based drugs.

Leading Markets & Segments in Next-Generation Antibody Therapeutics Market
The Oncology segment dominates the Next-Generation Antibody Therapeutics market, accounting for the largest share of revenue, followed by the Autoimmune/Inflammatory segment. Within the technology segments, ADCs and BsAbs hold significant market shares, driven by their efficacy in targeting specific cancer cells and improving treatment outcomes.
Key Drivers for Oncology Segment:
- High prevalence of various cancers globally
- Increased demand for targeted therapies with improved efficacy and reduced side effects
- Technological advancements in ADC and BsAb development
Key Drivers for Autoimmune/Inflammatory Segment:
- Rising prevalence of autoimmune and inflammatory diseases
- Growing awareness and diagnosis rates among patients
- Development of novel antibody therapies with enhanced efficacy and safety
Key Drivers for ADC Technology:
- Improved drug delivery and enhanced efficacy compared to traditional chemotherapy
- Growing number of approvals for ADC-based cancer treatments
- Technological advancements leading to improved linker-payload technology.
Key Drivers for BsAb Technology:
- Ability to target multiple pathways and mechanisms simultaneously
- Potential for improved efficacy and reduced treatment resistance
- Increased number of BsAbs in clinical development.
The North American market holds the largest share of the global Next-Generation Antibody Therapeutics market, driven by robust healthcare infrastructure, significant R&D investment, and early adoption of novel therapeutics. Europe and Asia Pacific are expected to experience significant growth in the forecast period, driven by increasing healthcare expenditure and growing awareness of advanced therapeutic options.
Next-Generation Antibody Therapeutics Market Product Developments
The market is witnessing continuous product innovations, with a strong focus on enhancing efficacy, improving safety profiles, and expanding therapeutic applications. New antibody formats, such as bispecific antibodies and antibody-drug conjugates (ADCs), are being developed to target specific cancer cells and deliver potent therapeutic agents with reduced side effects. Technological advancements in linker-payload technology, antibody engineering, and targeted drug delivery systems are further driving product innovation. This trend is shaping competitive advantages by providing improved therapeutic outcomes, and better market fit for unmet medical needs.
Key Drivers of Next-Generation Antibody Therapeutics Market Growth
Several factors are driving the growth of the Next-Generation Antibody Therapeutics market. Technological advancements, particularly in antibody engineering and drug delivery systems, are significantly expanding the therapeutic potential of antibodies. The increasing prevalence of chronic diseases such as cancer and autoimmune disorders fuels the demand for effective and targeted therapies. Favorable regulatory environments in many countries are accelerating the approval and commercialization of new antibody-based drugs, further contributing to market growth. Finally, increased investment in research and development from both pharmaceutical companies and government agencies is propelling the development of novel antibody therapeutics.
Challenges in the Next-Generation Antibody Therapeutics Market
The Next-Generation Antibody Therapeutics market faces significant challenges, including high development costs, stringent regulatory hurdles, and complex manufacturing processes. These factors increase the time and resources required to bring new products to market, limiting the market entry of smaller players. Supply chain disruptions can also impact the availability and cost of raw materials and manufacturing capacity. Furthermore, intense competition among established pharmaceutical companies creates pressure on pricing and profitability. Regulatory changes and reimbursement policies can also impact market access and adoption. The cost to develop a novel antibody therapy can exceed $2 Billion.
Emerging Opportunities in Next-Generation Antibody Therapeutics Market
The Next-Generation Antibody Therapeutics market presents numerous opportunities for growth. Technological breakthroughs in antibody engineering and drug delivery systems are continuously expanding the therapeutic potential of antibodies, opening up new avenues for treatment. Strategic partnerships and collaborations between pharmaceutical companies and biotechnology firms can accelerate the development and commercialization of new therapies. Market expansion strategies, such as focusing on emerging markets and unmet medical needs, can drive significant growth in the coming years. The development of personalized therapies based on genetic and molecular profiles is another promising area.
Leading Players in the Next-Generation Antibody Therapeutics Market Sector
- Kyowa Hakko Kirin Co Ltd
- Bayer AG
- Amgen Inc
- ImmunoGen Inc
- Xencor Inc
- F Hoffmann-La Roche Ltd
- GlaxoSmithKline Plc
- Biogen
- AstraZeneca Plc
- Seagen Inc
- Bristol-Myers Squibb Company
- Pfizer Inc
Key Milestones in Next-Generation Antibody Therapeutics Market Industry
- July 2022: Byondis received biologics license application acceptance from the U.S. FDA for Vic-Trastuzumab Duocarmazine (SYD985), an antibody-drug conjugate, as a treatment for patients with HER2-positive advanced breast cancer. This approval highlights the growing importance of ADCs in cancer treatment.
- December 2022: Sorrento Therapeutics, Inc. received clearance from the U.S. FDA to initiate clinical trials with its next-generation mRNA (STI-1557) vaccine against SARS-CoV-2 Omicron variants. This signifies the ongoing efforts to develop innovative vaccines against emerging viral variants.
Strategic Outlook for Next-Generation Antibody Therapeutics Market
The Next-Generation Antibody Therapeutics market is poised for significant growth in the coming years, driven by technological advancements, increasing prevalence of chronic diseases, and favorable regulatory environments. Strategic opportunities exist for companies that can effectively leverage technological innovations, build strategic partnerships, and expand their market presence in both established and emerging markets. A focus on developing personalized therapies and addressing unmet medical needs will be crucial for success. The continued development of novel antibody formats and targeted drug delivery systems will drive further market expansion and improved patient outcomes.
Next-Generation Antibody Therapeutics Market Segmentation
-
1. Therapeutic Area
- 1.1. Oncology
- 1.2. Autoimmune/Inflammatory
-
2. Technology
- 2.1. Antibody-Drug Conjugates (ADCs)
- 2.2. Bispecific Antibodies (BsAbs)
- 2.3. Fc-Engineered Antibodies
- 2.4. Antibody
- 2.5. Biosimilar Antibody Products
Next-Generation Antibody Therapeutics Market Segmentation By Geography
-
1. North America
- 1.1. United States
- 1.2. Canada
- 1.3. Mexico
-
2. Europe
- 2.1. Germany
- 2.2. United Kingdom
- 2.3. France
- 2.4. Italy
- 2.5. Spain
- 2.6. Rest of Europe
-
3. Asia Pacific
- 3.1. China
- 3.2. Japan
- 3.3. India
- 3.4. Australia
- 3.5. South Korea
- 3.6. Rest of Asia Pacific
-
4. Middle East and Africa
- 4.1. GCC
- 4.2. South Africa
- 4.3. Rest of Middle East and Africa
-
5. South America
- 5.1. Brazil
- 5.2. Argentina
- 5.3. Rest of South America

Next-Generation Antibody Therapeutics Market REPORT HIGHLIGHTS
| Aspects | Details |
|---|---|
| Study Period | 2019-2033 |
| Base Year | 2024 |
| Estimated Year | 2025 |
| Forecast Period | 2025-2033 |
| Historical Period | 2019-2024 |
| Growth Rate | CAGR of 12.10% from 2019-2033 |
| Segmentation |
|
Table of Contents
- 1. Introduction
- 1.1. Research Scope
- 1.2. Market Segmentation
- 1.3. Research Methodology
- 1.4. Definitions and Assumptions
- 2. Executive Summary
- 2.1. Introduction
- 3. Market Dynamics
- 3.1. Introduction
- 3.2. Market Drivers
- 3.2.1. Increasing Incidence of Cancer; Rising Prevalence of Autoimmune Diseases; Technological Progressions in Antibody Therapeutics
- 3.3. Market Restrains
- 3.3.1. Stringent Regulatory Framework; High costs of Next-Generation Antibody Therapeutics
- 3.4. Market Trends
- 3.4.1. Antibody-Drug Conjugates Segment is Expected to Hold the Largest Market Share in the Next-Generation Antibody Therapeutics Market
- 4. Market Factor Analysis
- 4.1. Porters Five Forces
- 4.2. Supply/Value Chain
- 4.3. PESTEL analysis
- 4.4. Market Entropy
- 4.5. Patent/Trademark Analysis
- 5. Global Next-Generation Antibody Therapeutics Market Analysis, Insights and Forecast, 2019-2031
- 5.1. Market Analysis, Insights and Forecast - by Therapeutic Area
- 5.1.1. Oncology
- 5.1.2. Autoimmune/Inflammatory
- 5.2. Market Analysis, Insights and Forecast - by Technology
- 5.2.1. Antibody-Drug Conjugates (ADCs)
- 5.2.2. Bispecific Antibodies (BsAbs)
- 5.2.3. Fc-Engineered Antibodies
- 5.2.4. Antibody
- 5.2.5. Biosimilar Antibody Products
- 5.3. Market Analysis, Insights and Forecast - by Region
- 5.3.1. North America
- 5.3.2. Europe
- 5.3.3. Asia Pacific
- 5.3.4. Middle East and Africa
- 5.3.5. South America
- 5.1. Market Analysis, Insights and Forecast - by Therapeutic Area
- 6. North America Next-Generation Antibody Therapeutics Market Analysis, Insights and Forecast, 2019-2031
- 6.1. Market Analysis, Insights and Forecast - by Therapeutic Area
- 6.1.1. Oncology
- 6.1.2. Autoimmune/Inflammatory
- 6.2. Market Analysis, Insights and Forecast - by Technology
- 6.2.1. Antibody-Drug Conjugates (ADCs)
- 6.2.2. Bispecific Antibodies (BsAbs)
- 6.2.3. Fc-Engineered Antibodies
- 6.2.4. Antibody
- 6.2.5. Biosimilar Antibody Products
- 6.1. Market Analysis, Insights and Forecast - by Therapeutic Area
- 7. Europe Next-Generation Antibody Therapeutics Market Analysis, Insights and Forecast, 2019-2031
- 7.1. Market Analysis, Insights and Forecast - by Therapeutic Area
- 7.1.1. Oncology
- 7.1.2. Autoimmune/Inflammatory
- 7.2. Market Analysis, Insights and Forecast - by Technology
- 7.2.1. Antibody-Drug Conjugates (ADCs)
- 7.2.2. Bispecific Antibodies (BsAbs)
- 7.2.3. Fc-Engineered Antibodies
- 7.2.4. Antibody
- 7.2.5. Biosimilar Antibody Products
- 7.1. Market Analysis, Insights and Forecast - by Therapeutic Area
- 8. Asia Pacific Next-Generation Antibody Therapeutics Market Analysis, Insights and Forecast, 2019-2031
- 8.1. Market Analysis, Insights and Forecast - by Therapeutic Area
- 8.1.1. Oncology
- 8.1.2. Autoimmune/Inflammatory
- 8.2. Market Analysis, Insights and Forecast - by Technology
- 8.2.1. Antibody-Drug Conjugates (ADCs)
- 8.2.2. Bispecific Antibodies (BsAbs)
- 8.2.3. Fc-Engineered Antibodies
- 8.2.4. Antibody
- 8.2.5. Biosimilar Antibody Products
- 8.1. Market Analysis, Insights and Forecast - by Therapeutic Area
- 9. Middle East and Africa Next-Generation Antibody Therapeutics Market Analysis, Insights and Forecast, 2019-2031
- 9.1. Market Analysis, Insights and Forecast - by Therapeutic Area
- 9.1.1. Oncology
- 9.1.2. Autoimmune/Inflammatory
- 9.2. Market Analysis, Insights and Forecast - by Technology
- 9.2.1. Antibody-Drug Conjugates (ADCs)
- 9.2.2. Bispecific Antibodies (BsAbs)
- 9.2.3. Fc-Engineered Antibodies
- 9.2.4. Antibody
- 9.2.5. Biosimilar Antibody Products
- 9.1. Market Analysis, Insights and Forecast - by Therapeutic Area
- 10. South America Next-Generation Antibody Therapeutics Market Analysis, Insights and Forecast, 2019-2031
- 10.1. Market Analysis, Insights and Forecast - by Therapeutic Area
- 10.1.1. Oncology
- 10.1.2. Autoimmune/Inflammatory
- 10.2. Market Analysis, Insights and Forecast - by Technology
- 10.2.1. Antibody-Drug Conjugates (ADCs)
- 10.2.2. Bispecific Antibodies (BsAbs)
- 10.2.3. Fc-Engineered Antibodies
- 10.2.4. Antibody
- 10.2.5. Biosimilar Antibody Products
- 10.1. Market Analysis, Insights and Forecast - by Therapeutic Area
- 11. North America Next-Generation Antibody Therapeutics Market Analysis, Insights and Forecast, 2019-2031
- 11.1. Market Analysis, Insights and Forecast - By Country/Sub-region
- 11.1.1 United States
- 11.1.2 Canada
- 11.1.3 Mexico
- 12. Europe Next-Generation Antibody Therapeutics Market Analysis, Insights and Forecast, 2019-2031
- 12.1. Market Analysis, Insights and Forecast - By Country/Sub-region
- 12.1.1 Germany
- 12.1.2 United Kingdom
- 12.1.3 France
- 12.1.4 Italy
- 12.1.5 Spain
- 12.1.6 Rest of Europe
- 13. Asia Pacific Next-Generation Antibody Therapeutics Market Analysis, Insights and Forecast, 2019-2031
- 13.1. Market Analysis, Insights and Forecast - By Country/Sub-region
- 13.1.1 China
- 13.1.2 Japan
- 13.1.3 India
- 13.1.4 Australia
- 13.1.5 South Korea
- 13.1.6 Rest of Asia Pacific
- 14. Middle East and Africa Next-Generation Antibody Therapeutics Market Analysis, Insights and Forecast, 2019-2031
- 14.1. Market Analysis, Insights and Forecast - By Country/Sub-region
- 14.1.1 GCC
- 14.1.2 South Africa
- 14.1.3 Rest of Middle East and Africa
- 15. South America Next-Generation Antibody Therapeutics Market Analysis, Insights and Forecast, 2019-2031
- 15.1. Market Analysis, Insights and Forecast - By Country/Sub-region
- 15.1.1 Brazil
- 15.1.2 Argentina
- 15.1.3 Rest of South America
- 16. Competitive Analysis
- 16.1. Global Market Share Analysis 2024
- 16.2. Company Profiles
- 16.2.1 Kyowa Hakko Kirin Co Ltd
- 16.2.1.1. Overview
- 16.2.1.2. Products
- 16.2.1.3. SWOT Analysis
- 16.2.1.4. Recent Developments
- 16.2.1.5. Financials (Based on Availability)
- 16.2.2 Bayer AG
- 16.2.2.1. Overview
- 16.2.2.2. Products
- 16.2.2.3. SWOT Analysis
- 16.2.2.4. Recent Developments
- 16.2.2.5. Financials (Based on Availability)
- 16.2.3 Amgen Inc
- 16.2.3.1. Overview
- 16.2.3.2. Products
- 16.2.3.3. SWOT Analysis
- 16.2.3.4. Recent Developments
- 16.2.3.5. Financials (Based on Availability)
- 16.2.4 ImmunoGen Inc
- 16.2.4.1. Overview
- 16.2.4.2. Products
- 16.2.4.3. SWOT Analysis
- 16.2.4.4. Recent Developments
- 16.2.4.5. Financials (Based on Availability)
- 16.2.5 Xencor Inc
- 16.2.5.1. Overview
- 16.2.5.2. Products
- 16.2.5.3. SWOT Analysis
- 16.2.5.4. Recent Developments
- 16.2.5.5. Financials (Based on Availability)
- 16.2.6 F Hoffmann-La Roche Ltd
- 16.2.6.1. Overview
- 16.2.6.2. Products
- 16.2.6.3. SWOT Analysis
- 16.2.6.4. Recent Developments
- 16.2.6.5. Financials (Based on Availability)
- 16.2.7 GlaxoSmithKline Plc
- 16.2.7.1. Overview
- 16.2.7.2. Products
- 16.2.7.3. SWOT Analysis
- 16.2.7.4. Recent Developments
- 16.2.7.5. Financials (Based on Availability)
- 16.2.8 Biogen
- 16.2.8.1. Overview
- 16.2.8.2. Products
- 16.2.8.3. SWOT Analysis
- 16.2.8.4. Recent Developments
- 16.2.8.5. Financials (Based on Availability)
- 16.2.9 AstraZeneca Plc
- 16.2.9.1. Overview
- 16.2.9.2. Products
- 16.2.9.3. SWOT Analysis
- 16.2.9.4. Recent Developments
- 16.2.9.5. Financials (Based on Availability)
- 16.2.10 Seagen Inc
- 16.2.10.1. Overview
- 16.2.10.2. Products
- 16.2.10.3. SWOT Analysis
- 16.2.10.4. Recent Developments
- 16.2.10.5. Financials (Based on Availability)
- 16.2.11 Bristol-Myers Squibb Company
- 16.2.11.1. Overview
- 16.2.11.2. Products
- 16.2.11.3. SWOT Analysis
- 16.2.11.4. Recent Developments
- 16.2.11.5. Financials (Based on Availability)
- 16.2.12 Pfizer Inc
- 16.2.12.1. Overview
- 16.2.12.2. Products
- 16.2.12.3. SWOT Analysis
- 16.2.12.4. Recent Developments
- 16.2.12.5. Financials (Based on Availability)
- 16.2.1 Kyowa Hakko Kirin Co Ltd
List of Figures
- Figure 1: Global Next-Generation Antibody Therapeutics Market Revenue Breakdown (Million, %) by Region 2024 & 2032
- Figure 2: Global Next-Generation Antibody Therapeutics Market Volume Breakdown (K Unit, %) by Region 2024 & 2032
- Figure 3: North America Next-Generation Antibody Therapeutics Market Revenue (Million), by Country 2024 & 2032
- Figure 4: North America Next-Generation Antibody Therapeutics Market Volume (K Unit), by Country 2024 & 2032
- Figure 5: North America Next-Generation Antibody Therapeutics Market Revenue Share (%), by Country 2024 & 2032
- Figure 6: North America Next-Generation Antibody Therapeutics Market Volume Share (%), by Country 2024 & 2032
- Figure 7: Europe Next-Generation Antibody Therapeutics Market Revenue (Million), by Country 2024 & 2032
- Figure 8: Europe Next-Generation Antibody Therapeutics Market Volume (K Unit), by Country 2024 & 2032
- Figure 9: Europe Next-Generation Antibody Therapeutics Market Revenue Share (%), by Country 2024 & 2032
- Figure 10: Europe Next-Generation Antibody Therapeutics Market Volume Share (%), by Country 2024 & 2032
- Figure 11: Asia Pacific Next-Generation Antibody Therapeutics Market Revenue (Million), by Country 2024 & 2032
- Figure 12: Asia Pacific Next-Generation Antibody Therapeutics Market Volume (K Unit), by Country 2024 & 2032
- Figure 13: Asia Pacific Next-Generation Antibody Therapeutics Market Revenue Share (%), by Country 2024 & 2032
- Figure 14: Asia Pacific Next-Generation Antibody Therapeutics Market Volume Share (%), by Country 2024 & 2032
- Figure 15: Middle East and Africa Next-Generation Antibody Therapeutics Market Revenue (Million), by Country 2024 & 2032
- Figure 16: Middle East and Africa Next-Generation Antibody Therapeutics Market Volume (K Unit), by Country 2024 & 2032
- Figure 17: Middle East and Africa Next-Generation Antibody Therapeutics Market Revenue Share (%), by Country 2024 & 2032
- Figure 18: Middle East and Africa Next-Generation Antibody Therapeutics Market Volume Share (%), by Country 2024 & 2032
- Figure 19: South America Next-Generation Antibody Therapeutics Market Revenue (Million), by Country 2024 & 2032
- Figure 20: South America Next-Generation Antibody Therapeutics Market Volume (K Unit), by Country 2024 & 2032
- Figure 21: South America Next-Generation Antibody Therapeutics Market Revenue Share (%), by Country 2024 & 2032
- Figure 22: South America Next-Generation Antibody Therapeutics Market Volume Share (%), by Country 2024 & 2032
- Figure 23: North America Next-Generation Antibody Therapeutics Market Revenue (Million), by Therapeutic Area 2024 & 2032
- Figure 24: North America Next-Generation Antibody Therapeutics Market Volume (K Unit), by Therapeutic Area 2024 & 2032
- Figure 25: North America Next-Generation Antibody Therapeutics Market Revenue Share (%), by Therapeutic Area 2024 & 2032
- Figure 26: North America Next-Generation Antibody Therapeutics Market Volume Share (%), by Therapeutic Area 2024 & 2032
- Figure 27: North America Next-Generation Antibody Therapeutics Market Revenue (Million), by Technology 2024 & 2032
- Figure 28: North America Next-Generation Antibody Therapeutics Market Volume (K Unit), by Technology 2024 & 2032
- Figure 29: North America Next-Generation Antibody Therapeutics Market Revenue Share (%), by Technology 2024 & 2032
- Figure 30: North America Next-Generation Antibody Therapeutics Market Volume Share (%), by Technology 2024 & 2032
- Figure 31: North America Next-Generation Antibody Therapeutics Market Revenue (Million), by Country 2024 & 2032
- Figure 32: North America Next-Generation Antibody Therapeutics Market Volume (K Unit), by Country 2024 & 2032
- Figure 33: North America Next-Generation Antibody Therapeutics Market Revenue Share (%), by Country 2024 & 2032
- Figure 34: North America Next-Generation Antibody Therapeutics Market Volume Share (%), by Country 2024 & 2032
- Figure 35: Europe Next-Generation Antibody Therapeutics Market Revenue (Million), by Therapeutic Area 2024 & 2032
- Figure 36: Europe Next-Generation Antibody Therapeutics Market Volume (K Unit), by Therapeutic Area 2024 & 2032
- Figure 37: Europe Next-Generation Antibody Therapeutics Market Revenue Share (%), by Therapeutic Area 2024 & 2032
- Figure 38: Europe Next-Generation Antibody Therapeutics Market Volume Share (%), by Therapeutic Area 2024 & 2032
- Figure 39: Europe Next-Generation Antibody Therapeutics Market Revenue (Million), by Technology 2024 & 2032
- Figure 40: Europe Next-Generation Antibody Therapeutics Market Volume (K Unit), by Technology 2024 & 2032
- Figure 41: Europe Next-Generation Antibody Therapeutics Market Revenue Share (%), by Technology 2024 & 2032
- Figure 42: Europe Next-Generation Antibody Therapeutics Market Volume Share (%), by Technology 2024 & 2032
- Figure 43: Europe Next-Generation Antibody Therapeutics Market Revenue (Million), by Country 2024 & 2032
- Figure 44: Europe Next-Generation Antibody Therapeutics Market Volume (K Unit), by Country 2024 & 2032
- Figure 45: Europe Next-Generation Antibody Therapeutics Market Revenue Share (%), by Country 2024 & 2032
- Figure 46: Europe Next-Generation Antibody Therapeutics Market Volume Share (%), by Country 2024 & 2032
- Figure 47: Asia Pacific Next-Generation Antibody Therapeutics Market Revenue (Million), by Therapeutic Area 2024 & 2032
- Figure 48: Asia Pacific Next-Generation Antibody Therapeutics Market Volume (K Unit), by Therapeutic Area 2024 & 2032
- Figure 49: Asia Pacific Next-Generation Antibody Therapeutics Market Revenue Share (%), by Therapeutic Area 2024 & 2032
- Figure 50: Asia Pacific Next-Generation Antibody Therapeutics Market Volume Share (%), by Therapeutic Area 2024 & 2032
- Figure 51: Asia Pacific Next-Generation Antibody Therapeutics Market Revenue (Million), by Technology 2024 & 2032
- Figure 52: Asia Pacific Next-Generation Antibody Therapeutics Market Volume (K Unit), by Technology 2024 & 2032
- Figure 53: Asia Pacific Next-Generation Antibody Therapeutics Market Revenue Share (%), by Technology 2024 & 2032
- Figure 54: Asia Pacific Next-Generation Antibody Therapeutics Market Volume Share (%), by Technology 2024 & 2032
- Figure 55: Asia Pacific Next-Generation Antibody Therapeutics Market Revenue (Million), by Country 2024 & 2032
- Figure 56: Asia Pacific Next-Generation Antibody Therapeutics Market Volume (K Unit), by Country 2024 & 2032
- Figure 57: Asia Pacific Next-Generation Antibody Therapeutics Market Revenue Share (%), by Country 2024 & 2032
- Figure 58: Asia Pacific Next-Generation Antibody Therapeutics Market Volume Share (%), by Country 2024 & 2032
- Figure 59: Middle East and Africa Next-Generation Antibody Therapeutics Market Revenue (Million), by Therapeutic Area 2024 & 2032
- Figure 60: Middle East and Africa Next-Generation Antibody Therapeutics Market Volume (K Unit), by Therapeutic Area 2024 & 2032
- Figure 61: Middle East and Africa Next-Generation Antibody Therapeutics Market Revenue Share (%), by Therapeutic Area 2024 & 2032
- Figure 62: Middle East and Africa Next-Generation Antibody Therapeutics Market Volume Share (%), by Therapeutic Area 2024 & 2032
- Figure 63: Middle East and Africa Next-Generation Antibody Therapeutics Market Revenue (Million), by Technology 2024 & 2032
- Figure 64: Middle East and Africa Next-Generation Antibody Therapeutics Market Volume (K Unit), by Technology 2024 & 2032
- Figure 65: Middle East and Africa Next-Generation Antibody Therapeutics Market Revenue Share (%), by Technology 2024 & 2032
- Figure 66: Middle East and Africa Next-Generation Antibody Therapeutics Market Volume Share (%), by Technology 2024 & 2032
- Figure 67: Middle East and Africa Next-Generation Antibody Therapeutics Market Revenue (Million), by Country 2024 & 2032
- Figure 68: Middle East and Africa Next-Generation Antibody Therapeutics Market Volume (K Unit), by Country 2024 & 2032
- Figure 69: Middle East and Africa Next-Generation Antibody Therapeutics Market Revenue Share (%), by Country 2024 & 2032
- Figure 70: Middle East and Africa Next-Generation Antibody Therapeutics Market Volume Share (%), by Country 2024 & 2032
- Figure 71: South America Next-Generation Antibody Therapeutics Market Revenue (Million), by Therapeutic Area 2024 & 2032
- Figure 72: South America Next-Generation Antibody Therapeutics Market Volume (K Unit), by Therapeutic Area 2024 & 2032
- Figure 73: South America Next-Generation Antibody Therapeutics Market Revenue Share (%), by Therapeutic Area 2024 & 2032
- Figure 74: South America Next-Generation Antibody Therapeutics Market Volume Share (%), by Therapeutic Area 2024 & 2032
- Figure 75: South America Next-Generation Antibody Therapeutics Market Revenue (Million), by Technology 2024 & 2032
- Figure 76: South America Next-Generation Antibody Therapeutics Market Volume (K Unit), by Technology 2024 & 2032
- Figure 77: South America Next-Generation Antibody Therapeutics Market Revenue Share (%), by Technology 2024 & 2032
- Figure 78: South America Next-Generation Antibody Therapeutics Market Volume Share (%), by Technology 2024 & 2032
- Figure 79: South America Next-Generation Antibody Therapeutics Market Revenue (Million), by Country 2024 & 2032
- Figure 80: South America Next-Generation Antibody Therapeutics Market Volume (K Unit), by Country 2024 & 2032
- Figure 81: South America Next-Generation Antibody Therapeutics Market Revenue Share (%), by Country 2024 & 2032
- Figure 82: South America Next-Generation Antibody Therapeutics Market Volume Share (%), by Country 2024 & 2032
List of Tables
- Table 1: Global Next-Generation Antibody Therapeutics Market Revenue Million Forecast, by Region 2019 & 2032
- Table 2: Global Next-Generation Antibody Therapeutics Market Volume K Unit Forecast, by Region 2019 & 2032
- Table 3: Global Next-Generation Antibody Therapeutics Market Revenue Million Forecast, by Therapeutic Area 2019 & 2032
- Table 4: Global Next-Generation Antibody Therapeutics Market Volume K Unit Forecast, by Therapeutic Area 2019 & 2032
- Table 5: Global Next-Generation Antibody Therapeutics Market Revenue Million Forecast, by Technology 2019 & 2032
- Table 6: Global Next-Generation Antibody Therapeutics Market Volume K Unit Forecast, by Technology 2019 & 2032
- Table 7: Global Next-Generation Antibody Therapeutics Market Revenue Million Forecast, by Region 2019 & 2032
- Table 8: Global Next-Generation Antibody Therapeutics Market Volume K Unit Forecast, by Region 2019 & 2032
- Table 9: Global Next-Generation Antibody Therapeutics Market Revenue Million Forecast, by Country 2019 & 2032
- Table 10: Global Next-Generation Antibody Therapeutics Market Volume K Unit Forecast, by Country 2019 & 2032
- Table 11: United States Next-Generation Antibody Therapeutics Market Revenue (Million) Forecast, by Application 2019 & 2032
- Table 12: United States Next-Generation Antibody Therapeutics Market Volume (K Unit) Forecast, by Application 2019 & 2032
- Table 13: Canada Next-Generation Antibody Therapeutics Market Revenue (Million) Forecast, by Application 2019 & 2032
- Table 14: Canada Next-Generation Antibody Therapeutics Market Volume (K Unit) Forecast, by Application 2019 & 2032
- Table 15: Mexico Next-Generation Antibody Therapeutics Market Revenue (Million) Forecast, by Application 2019 & 2032
- Table 16: Mexico Next-Generation Antibody Therapeutics Market Volume (K Unit) Forecast, by Application 2019 & 2032
- Table 17: Global Next-Generation Antibody Therapeutics Market Revenue Million Forecast, by Country 2019 & 2032
- Table 18: Global Next-Generation Antibody Therapeutics Market Volume K Unit Forecast, by Country 2019 & 2032
- Table 19: Germany Next-Generation Antibody Therapeutics Market Revenue (Million) Forecast, by Application 2019 & 2032
- Table 20: Germany Next-Generation Antibody Therapeutics Market Volume (K Unit) Forecast, by Application 2019 & 2032
- Table 21: United Kingdom Next-Generation Antibody Therapeutics Market Revenue (Million) Forecast, by Application 2019 & 2032
- Table 22: United Kingdom Next-Generation Antibody Therapeutics Market Volume (K Unit) Forecast, by Application 2019 & 2032
- Table 23: France Next-Generation Antibody Therapeutics Market Revenue (Million) Forecast, by Application 2019 & 2032
- Table 24: France Next-Generation Antibody Therapeutics Market Volume (K Unit) Forecast, by Application 2019 & 2032
- Table 25: Italy Next-Generation Antibody Therapeutics Market Revenue (Million) Forecast, by Application 2019 & 2032
- Table 26: Italy Next-Generation Antibody Therapeutics Market Volume (K Unit) Forecast, by Application 2019 & 2032
- Table 27: Spain Next-Generation Antibody Therapeutics Market Revenue (Million) Forecast, by Application 2019 & 2032
- Table 28: Spain Next-Generation Antibody Therapeutics Market Volume (K Unit) Forecast, by Application 2019 & 2032
- Table 29: Rest of Europe Next-Generation Antibody Therapeutics Market Revenue (Million) Forecast, by Application 2019 & 2032
- Table 30: Rest of Europe Next-Generation Antibody Therapeutics Market Volume (K Unit) Forecast, by Application 2019 & 2032
- Table 31: Global Next-Generation Antibody Therapeutics Market Revenue Million Forecast, by Country 2019 & 2032
- Table 32: Global Next-Generation Antibody Therapeutics Market Volume K Unit Forecast, by Country 2019 & 2032
- Table 33: China Next-Generation Antibody Therapeutics Market Revenue (Million) Forecast, by Application 2019 & 2032
- Table 34: China Next-Generation Antibody Therapeutics Market Volume (K Unit) Forecast, by Application 2019 & 2032
- Table 35: Japan Next-Generation Antibody Therapeutics Market Revenue (Million) Forecast, by Application 2019 & 2032
- Table 36: Japan Next-Generation Antibody Therapeutics Market Volume (K Unit) Forecast, by Application 2019 & 2032
- Table 37: India Next-Generation Antibody Therapeutics Market Revenue (Million) Forecast, by Application 2019 & 2032
- Table 38: India Next-Generation Antibody Therapeutics Market Volume (K Unit) Forecast, by Application 2019 & 2032
- Table 39: Australia Next-Generation Antibody Therapeutics Market Revenue (Million) Forecast, by Application 2019 & 2032
- Table 40: Australia Next-Generation Antibody Therapeutics Market Volume (K Unit) Forecast, by Application 2019 & 2032
- Table 41: South Korea Next-Generation Antibody Therapeutics Market Revenue (Million) Forecast, by Application 2019 & 2032
- Table 42: South Korea Next-Generation Antibody Therapeutics Market Volume (K Unit) Forecast, by Application 2019 & 2032
- Table 43: Rest of Asia Pacific Next-Generation Antibody Therapeutics Market Revenue (Million) Forecast, by Application 2019 & 2032
- Table 44: Rest of Asia Pacific Next-Generation Antibody Therapeutics Market Volume (K Unit) Forecast, by Application 2019 & 2032
- Table 45: Global Next-Generation Antibody Therapeutics Market Revenue Million Forecast, by Country 2019 & 2032
- Table 46: Global Next-Generation Antibody Therapeutics Market Volume K Unit Forecast, by Country 2019 & 2032
- Table 47: GCC Next-Generation Antibody Therapeutics Market Revenue (Million) Forecast, by Application 2019 & 2032
- Table 48: GCC Next-Generation Antibody Therapeutics Market Volume (K Unit) Forecast, by Application 2019 & 2032
- Table 49: South Africa Next-Generation Antibody Therapeutics Market Revenue (Million) Forecast, by Application 2019 & 2032
- Table 50: South Africa Next-Generation Antibody Therapeutics Market Volume (K Unit) Forecast, by Application 2019 & 2032
- Table 51: Rest of Middle East and Africa Next-Generation Antibody Therapeutics Market Revenue (Million) Forecast, by Application 2019 & 2032
- Table 52: Rest of Middle East and Africa Next-Generation Antibody Therapeutics Market Volume (K Unit) Forecast, by Application 2019 & 2032
- Table 53: Global Next-Generation Antibody Therapeutics Market Revenue Million Forecast, by Country 2019 & 2032
- Table 54: Global Next-Generation Antibody Therapeutics Market Volume K Unit Forecast, by Country 2019 & 2032
- Table 55: Brazil Next-Generation Antibody Therapeutics Market Revenue (Million) Forecast, by Application 2019 & 2032
- Table 56: Brazil Next-Generation Antibody Therapeutics Market Volume (K Unit) Forecast, by Application 2019 & 2032
- Table 57: Argentina Next-Generation Antibody Therapeutics Market Revenue (Million) Forecast, by Application 2019 & 2032
- Table 58: Argentina Next-Generation Antibody Therapeutics Market Volume (K Unit) Forecast, by Application 2019 & 2032
- Table 59: Rest of South America Next-Generation Antibody Therapeutics Market Revenue (Million) Forecast, by Application 2019 & 2032
- Table 60: Rest of South America Next-Generation Antibody Therapeutics Market Volume (K Unit) Forecast, by Application 2019 & 2032
- Table 61: Global Next-Generation Antibody Therapeutics Market Revenue Million Forecast, by Therapeutic Area 2019 & 2032
- Table 62: Global Next-Generation Antibody Therapeutics Market Volume K Unit Forecast, by Therapeutic Area 2019 & 2032
- Table 63: Global Next-Generation Antibody Therapeutics Market Revenue Million Forecast, by Technology 2019 & 2032
- Table 64: Global Next-Generation Antibody Therapeutics Market Volume K Unit Forecast, by Technology 2019 & 2032
- Table 65: Global Next-Generation Antibody Therapeutics Market Revenue Million Forecast, by Country 2019 & 2032
- Table 66: Global Next-Generation Antibody Therapeutics Market Volume K Unit Forecast, by Country 2019 & 2032
- Table 67: United States Next-Generation Antibody Therapeutics Market Revenue (Million) Forecast, by Application 2019 & 2032
- Table 68: United States Next-Generation Antibody Therapeutics Market Volume (K Unit) Forecast, by Application 2019 & 2032
- Table 69: Canada Next-Generation Antibody Therapeutics Market Revenue (Million) Forecast, by Application 2019 & 2032
- Table 70: Canada Next-Generation Antibody Therapeutics Market Volume (K Unit) Forecast, by Application 2019 & 2032
- Table 71: Mexico Next-Generation Antibody Therapeutics Market Revenue (Million) Forecast, by Application 2019 & 2032
- Table 72: Mexico Next-Generation Antibody Therapeutics Market Volume (K Unit) Forecast, by Application 2019 & 2032
- Table 73: Global Next-Generation Antibody Therapeutics Market Revenue Million Forecast, by Therapeutic Area 2019 & 2032
- Table 74: Global Next-Generation Antibody Therapeutics Market Volume K Unit Forecast, by Therapeutic Area 2019 & 2032
- Table 75: Global Next-Generation Antibody Therapeutics Market Revenue Million Forecast, by Technology 2019 & 2032
- Table 76: Global Next-Generation Antibody Therapeutics Market Volume K Unit Forecast, by Technology 2019 & 2032
- Table 77: Global Next-Generation Antibody Therapeutics Market Revenue Million Forecast, by Country 2019 & 2032
- Table 78: Global Next-Generation Antibody Therapeutics Market Volume K Unit Forecast, by Country 2019 & 2032
- Table 79: Germany Next-Generation Antibody Therapeutics Market Revenue (Million) Forecast, by Application 2019 & 2032
- Table 80: Germany Next-Generation Antibody Therapeutics Market Volume (K Unit) Forecast, by Application 2019 & 2032
- Table 81: United Kingdom Next-Generation Antibody Therapeutics Market Revenue (Million) Forecast, by Application 2019 & 2032
- Table 82: United Kingdom Next-Generation Antibody Therapeutics Market Volume (K Unit) Forecast, by Application 2019 & 2032
- Table 83: France Next-Generation Antibody Therapeutics Market Revenue (Million) Forecast, by Application 2019 & 2032
- Table 84: France Next-Generation Antibody Therapeutics Market Volume (K Unit) Forecast, by Application 2019 & 2032
- Table 85: Italy Next-Generation Antibody Therapeutics Market Revenue (Million) Forecast, by Application 2019 & 2032
- Table 86: Italy Next-Generation Antibody Therapeutics Market Volume (K Unit) Forecast, by Application 2019 & 2032
- Table 87: Spain Next-Generation Antibody Therapeutics Market Revenue (Million) Forecast, by Application 2019 & 2032
- Table 88: Spain Next-Generation Antibody Therapeutics Market Volume (K Unit) Forecast, by Application 2019 & 2032
- Table 89: Rest of Europe Next-Generation Antibody Therapeutics Market Revenue (Million) Forecast, by Application 2019 & 2032
- Table 90: Rest of Europe Next-Generation Antibody Therapeutics Market Volume (K Unit) Forecast, by Application 2019 & 2032
- Table 91: Global Next-Generation Antibody Therapeutics Market Revenue Million Forecast, by Therapeutic Area 2019 & 2032
- Table 92: Global Next-Generation Antibody Therapeutics Market Volume K Unit Forecast, by Therapeutic Area 2019 & 2032
- Table 93: Global Next-Generation Antibody Therapeutics Market Revenue Million Forecast, by Technology 2019 & 2032
- Table 94: Global Next-Generation Antibody Therapeutics Market Volume K Unit Forecast, by Technology 2019 & 2032
- Table 95: Global Next-Generation Antibody Therapeutics Market Revenue Million Forecast, by Country 2019 & 2032
- Table 96: Global Next-Generation Antibody Therapeutics Market Volume K Unit Forecast, by Country 2019 & 2032
- Table 97: China Next-Generation Antibody Therapeutics Market Revenue (Million) Forecast, by Application 2019 & 2032
- Table 98: China Next-Generation Antibody Therapeutics Market Volume (K Unit) Forecast, by Application 2019 & 2032
- Table 99: Japan Next-Generation Antibody Therapeutics Market Revenue (Million) Forecast, by Application 2019 & 2032
- Table 100: Japan Next-Generation Antibody Therapeutics Market Volume (K Unit) Forecast, by Application 2019 & 2032
- Table 101: India Next-Generation Antibody Therapeutics Market Revenue (Million) Forecast, by Application 2019 & 2032
- Table 102: India Next-Generation Antibody Therapeutics Market Volume (K Unit) Forecast, by Application 2019 & 2032
- Table 103: Australia Next-Generation Antibody Therapeutics Market Revenue (Million) Forecast, by Application 2019 & 2032
- Table 104: Australia Next-Generation Antibody Therapeutics Market Volume (K Unit) Forecast, by Application 2019 & 2032
- Table 105: South Korea Next-Generation Antibody Therapeutics Market Revenue (Million) Forecast, by Application 2019 & 2032
- Table 106: South Korea Next-Generation Antibody Therapeutics Market Volume (K Unit) Forecast, by Application 2019 & 2032
- Table 107: Rest of Asia Pacific Next-Generation Antibody Therapeutics Market Revenue (Million) Forecast, by Application 2019 & 2032
- Table 108: Rest of Asia Pacific Next-Generation Antibody Therapeutics Market Volume (K Unit) Forecast, by Application 2019 & 2032
- Table 109: Global Next-Generation Antibody Therapeutics Market Revenue Million Forecast, by Therapeutic Area 2019 & 2032
- Table 110: Global Next-Generation Antibody Therapeutics Market Volume K Unit Forecast, by Therapeutic Area 2019 & 2032
- Table 111: Global Next-Generation Antibody Therapeutics Market Revenue Million Forecast, by Technology 2019 & 2032
- Table 112: Global Next-Generation Antibody Therapeutics Market Volume K Unit Forecast, by Technology 2019 & 2032
- Table 113: Global Next-Generation Antibody Therapeutics Market Revenue Million Forecast, by Country 2019 & 2032
- Table 114: Global Next-Generation Antibody Therapeutics Market Volume K Unit Forecast, by Country 2019 & 2032
- Table 115: GCC Next-Generation Antibody Therapeutics Market Revenue (Million) Forecast, by Application 2019 & 2032
- Table 116: GCC Next-Generation Antibody Therapeutics Market Volume (K Unit) Forecast, by Application 2019 & 2032
- Table 117: South Africa Next-Generation Antibody Therapeutics Market Revenue (Million) Forecast, by Application 2019 & 2032
- Table 118: South Africa Next-Generation Antibody Therapeutics Market Volume (K Unit) Forecast, by Application 2019 & 2032
- Table 119: Rest of Middle East and Africa Next-Generation Antibody Therapeutics Market Revenue (Million) Forecast, by Application 2019 & 2032
- Table 120: Rest of Middle East and Africa Next-Generation Antibody Therapeutics Market Volume (K Unit) Forecast, by Application 2019 & 2032
- Table 121: Global Next-Generation Antibody Therapeutics Market Revenue Million Forecast, by Therapeutic Area 2019 & 2032
- Table 122: Global Next-Generation Antibody Therapeutics Market Volume K Unit Forecast, by Therapeutic Area 2019 & 2032
- Table 123: Global Next-Generation Antibody Therapeutics Market Revenue Million Forecast, by Technology 2019 & 2032
- Table 124: Global Next-Generation Antibody Therapeutics Market Volume K Unit Forecast, by Technology 2019 & 2032
- Table 125: Global Next-Generation Antibody Therapeutics Market Revenue Million Forecast, by Country 2019 & 2032
- Table 126: Global Next-Generation Antibody Therapeutics Market Volume K Unit Forecast, by Country 2019 & 2032
- Table 127: Brazil Next-Generation Antibody Therapeutics Market Revenue (Million) Forecast, by Application 2019 & 2032
- Table 128: Brazil Next-Generation Antibody Therapeutics Market Volume (K Unit) Forecast, by Application 2019 & 2032
- Table 129: Argentina Next-Generation Antibody Therapeutics Market Revenue (Million) Forecast, by Application 2019 & 2032
- Table 130: Argentina Next-Generation Antibody Therapeutics Market Volume (K Unit) Forecast, by Application 2019 & 2032
- Table 131: Rest of South America Next-Generation Antibody Therapeutics Market Revenue (Million) Forecast, by Application 2019 & 2032
- Table 132: Rest of South America Next-Generation Antibody Therapeutics Market Volume (K Unit) Forecast, by Application 2019 & 2032
Frequently Asked Questions
1. What is the projected Compound Annual Growth Rate (CAGR) of the Next-Generation Antibody Therapeutics Market?
The projected CAGR is approximately 12.10%.
2. Which companies are prominent players in the Next-Generation Antibody Therapeutics Market?
Key companies in the market include Kyowa Hakko Kirin Co Ltd, Bayer AG, Amgen Inc, ImmunoGen Inc, Xencor Inc, F Hoffmann-La Roche Ltd, GlaxoSmithKline Plc, Biogen, AstraZeneca Plc, Seagen Inc, Bristol-Myers Squibb Company, Pfizer Inc.
3. What are the main segments of the Next-Generation Antibody Therapeutics Market?
The market segments include Therapeutic Area, Technology.
4. Can you provide details about the market size?
The market size is estimated to be USD XX Million as of 2022.
5. What are some drivers contributing to market growth?
Increasing Incidence of Cancer; Rising Prevalence of Autoimmune Diseases; Technological Progressions in Antibody Therapeutics.
6. What are the notable trends driving market growth?
Antibody-Drug Conjugates Segment is Expected to Hold the Largest Market Share in the Next-Generation Antibody Therapeutics Market.
7. Are there any restraints impacting market growth?
Stringent Regulatory Framework; High costs of Next-Generation Antibody Therapeutics.
8. Can you provide examples of recent developments in the market?
December 2022: Sorrento Therapeutics, Inc. received clearance from the U.S. FDA to initiate clinical trials with its next-generation mRNA (STI-1557) vaccine against SARS-CoV-2 Omicron variants.
9. What pricing options are available for accessing the report?
Pricing options include single-user, multi-user, and enterprise licenses priced at USD 4750, USD 5250, and USD 8750 respectively.
10. Is the market size provided in terms of value or volume?
The market size is provided in terms of value, measured in Million and volume, measured in K Unit.
11. Are there any specific market keywords associated with the report?
Yes, the market keyword associated with the report is "Next-Generation Antibody Therapeutics Market," which aids in identifying and referencing the specific market segment covered.
12. How do I determine which pricing option suits my needs best?
The pricing options vary based on user requirements and access needs. Individual users may opt for single-user licenses, while businesses requiring broader access may choose multi-user or enterprise licenses for cost-effective access to the report.
13. Are there any additional resources or data provided in the Next-Generation Antibody Therapeutics Market report?
While the report offers comprehensive insights, it's advisable to review the specific contents or supplementary materials provided to ascertain if additional resources or data are available.
14. How can I stay updated on further developments or reports in the Next-Generation Antibody Therapeutics Market?
To stay informed about further developments, trends, and reports in the Next-Generation Antibody Therapeutics Market, consider subscribing to industry newsletters, following relevant companies and organizations, or regularly checking reputable industry news sources and publications.
Methodology
Step 1 - Identification of Relevant Samples Size from Population Database


Step 2 - Approaches for Defining Global Market Size (Value, Volume* & Price*)

Note*: In applicable scenarios
Step 3 - Data Sources
Primary Research
- Web Analytics
- Survey Reports
- Research Institute
- Latest Research Reports
- Opinion Leaders
Secondary Research
- Annual Reports
- White Paper
- Latest Press Release
- Industry Association
- Paid Database
- Investor Presentations

Step 4 - Data Triangulation
Involves using different sources of information in order to increase the validity of a study
These sources are likely to be stakeholders in a program - participants, other researchers, program staff, other community members, and so on.
Then we put all data in single framework & apply various statistical tools to find out the dynamic on the market.
During the analysis stage, feedback from the stakeholder groups would be compared to determine areas of agreement as well as areas of divergence
