

Key Insights
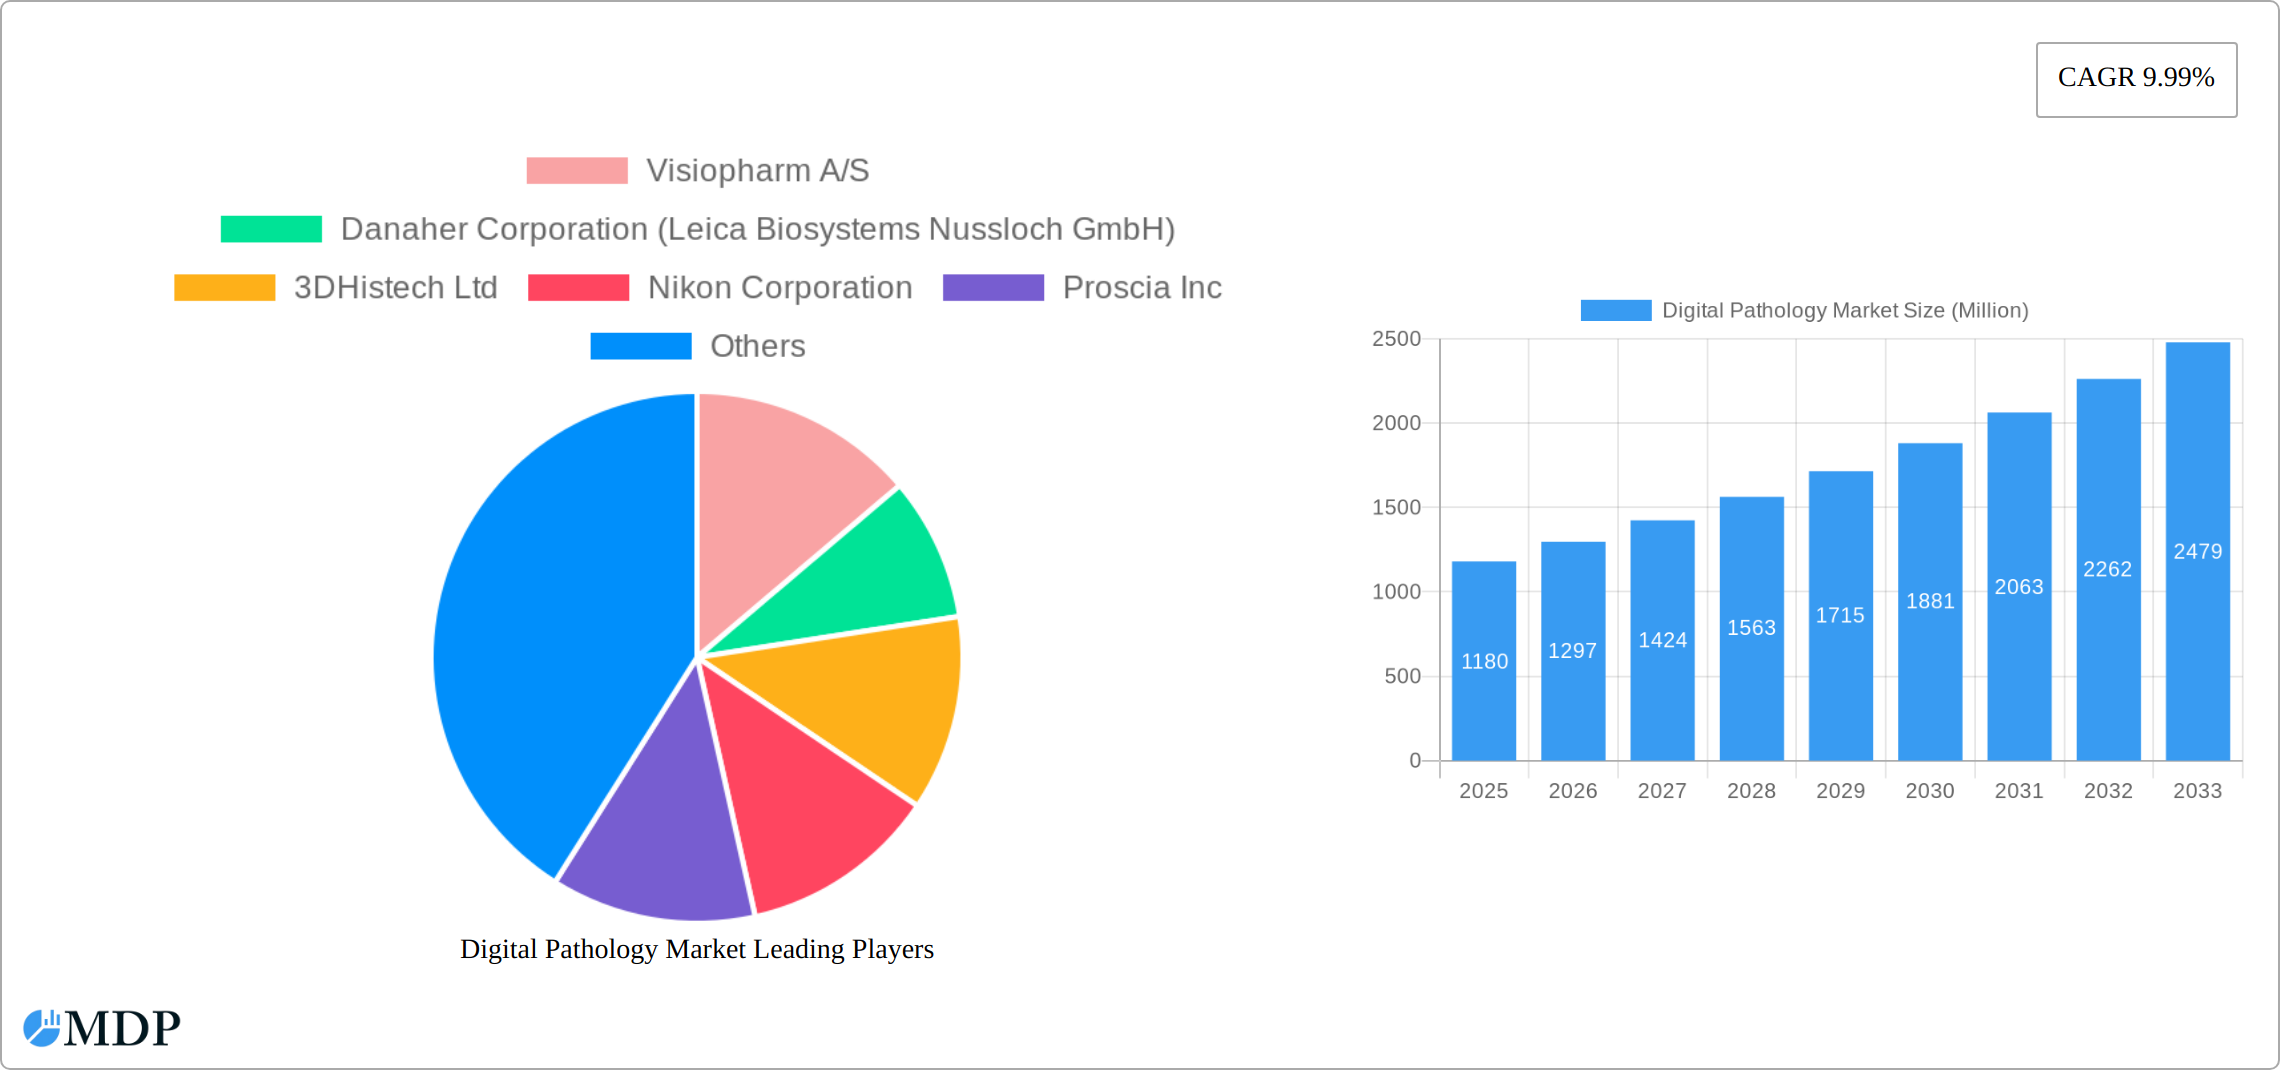
The digital pathology market is experiencing robust growth, driven by the increasing adoption of digital technologies in healthcare and the significant advantages offered by digital pathology over traditional microscopy. The market, valued at $1.18 billion in 2025, is projected to expand at a compound annual growth rate (CAGR) of 9.99% from 2025 to 2033. This growth is fueled by several key factors. Firstly, the rising prevalence of chronic diseases globally necessitates faster and more accurate diagnostic tools, which digital pathology effectively provides. Secondly, advancements in image analysis software and artificial intelligence (AI) are enhancing the diagnostic capabilities and efficiency of digital pathology systems, leading to improved diagnostic accuracy and reduced turnaround times. Furthermore, the increasing demand for telepathology and remote diagnostics is driving the adoption of digital pathology solutions, enabling better access to specialist expertise in underserved areas. The pharmaceutical and biotechnology sectors are major drivers of market growth, utilizing digital pathology for drug discovery and development. The integration of digital pathology into hospital and reference laboratories is also a key growth factor, improving workflow efficiency and diagnostic accuracy.
Significant market segmentation exists within the digital pathology market, categorized by end-users (pharmaceutical companies, biotechnology firms, CROs, hospitals, and reference labs), products (scanners, software, storage systems), and applications (disease diagnosis, drug discovery, education and training). North America currently holds a significant market share due to advanced healthcare infrastructure and high adoption rates of new technologies. However, the Asia-Pacific region is expected to witness substantial growth in the coming years driven by increasing healthcare expenditure and rising awareness of the benefits of digital pathology. While the high initial investment cost of digital pathology systems may pose a restraint, the long-term cost savings associated with improved efficiency and reduced operational expenses are likely to overcome this barrier. The competitive landscape is populated by a mix of established players and emerging companies, all vying for market share through innovation and strategic partnerships. The market's future growth trajectory is promising, driven by technological advancements, increasing demand, and expanding applications across various healthcare settings.
Digital Pathology Market: A Comprehensive Report (2019-2033)
This comprehensive report provides a detailed analysis of the Digital Pathology Market, covering market dynamics, industry trends, leading segments, key players, and future growth opportunities. The study period spans from 2019 to 2033, with 2025 as the base and estimated year, and a forecast period of 2025-2033. The historical period analyzed is 2019-2024. The report projects a market value exceeding xx Million by 2033, driven by technological advancements and increasing adoption across various healthcare sectors. This in-depth analysis is crucial for stakeholders, investors, and industry professionals seeking to understand the current landscape and future trajectory of this rapidly evolving market.
Digital Pathology Market Market Dynamics & Concentration
The Digital Pathology market is experiencing significant growth, driven by technological advancements, increasing demand for efficient diagnostic solutions, and a rising prevalence of chronic diseases. Market concentration is moderate, with several key players holding substantial market share but with room for smaller players to establish niches. Innovation in areas like AI-powered image analysis and cloud-based solutions is a primary driver, while regulatory frameworks concerning data privacy and diagnostic accuracy influence market adoption. Product substitutes are limited, primarily traditional microscopy techniques, but their usage is diminishing due to the advantages of digital pathology. End-user trends show a preference for integrated solutions offering seamless workflows and improved diagnostic capabilities.
- Market Share: The top 5 players account for approximately xx% of the global market share in 2025.
- M&A Activity: A total of xx M&A deals were recorded in the Digital Pathology market between 2019 and 2024, indicating consolidation trends within the industry. These deals are primarily focused on acquiring technological competencies and expanding market reach.
Digital Pathology Market Industry Trends & Analysis
The Digital Pathology market exhibits a robust Compound Annual Growth Rate (CAGR) of xx% during the forecast period (2025-2033). This growth is fueled by several key factors, including the rising adoption of digital pathology in clinical settings due to its increased efficiency and accuracy compared to conventional microscopy. Technological advancements, including the integration of artificial intelligence (AI) and machine learning (ML) algorithms for automated image analysis and diagnostics, are accelerating market expansion. The shift toward value-based care models, coupled with increasing demand for remote diagnostics, further strengthens the market. The market penetration of digital pathology is currently at xx% in developed countries and is projected to increase to xx% by 2033, driven by increasing healthcare expenditure and government initiatives supporting digital health technologies. The competitive dynamics are characterized by both established players expanding their product portfolios and new entrants introducing innovative solutions.

Leading Markets & Segments in Digital Pathology Market
The North American region currently holds the largest market share in the Digital Pathology market, driven by factors such as strong technological advancements, substantial healthcare spending, and early adoption of digital health technologies. Within end-user segments, Hospitals and Reference Laboratories constitute the largest segment, followed by Pharmaceutical and Biotechnology companies. The software segment dominates the product category due to its versatility and integration capabilities. Disease diagnosis is the leading application, driven by the need for improved diagnostic accuracy and speed.
- Key Drivers in North America:
- Strong regulatory support for digital health technologies
- High healthcare expenditure and insurance coverage
- Advanced infrastructure and technological capabilities.
- Dominance Analysis: The dominance of North America is expected to continue throughout the forecast period, although other regions, particularly in Asia-Pacific, are witnessing rapid growth.
Digital Pathology Market Product Developments
Recent product developments are focused on integrating advanced AI algorithms into digital pathology platforms to improve diagnostic accuracy and efficiency. This includes features such as automated cell identification, tissue classification, and the quantification of biomarkers. Cloud-based solutions are also gaining prominence, allowing for remote access to digital slides and collaborative diagnostics. These innovations address the growing needs for improved workflow efficiency, cost reduction, and enhanced diagnostic capabilities in the healthcare sector. The development of more user-friendly interfaces and improved data security features are also key aspects of current technological trends.
Key Drivers of Digital Pathology Market Growth
The Digital Pathology market is experiencing significant growth propelled by several key factors. Technological advancements, such as AI-powered image analysis and high-resolution scanners, are significantly improving diagnostic accuracy and efficiency. Increasing government initiatives promoting digital health and telemedicine are further boosting market adoption. Furthermore, the rising prevalence of chronic diseases requiring accurate and timely diagnosis is a major growth catalyst. The growing need for remote diagnostics, particularly in underserved areas, is also driving market demand.
Challenges in the Digital Pathology Market
Despite its significant growth potential, the Digital Pathology market faces several challenges. High initial investment costs for equipment and software can pose a barrier to entry for smaller healthcare providers. Regulatory hurdles related to data privacy and compliance with diagnostic standards can slow market adoption. Furthermore, integration with existing laboratory information management systems (LIMS) can be complex and time-consuming. The market also faces competitive pressures from established players and the emergence of new technologies. These factors collectively affect market expansion by reducing overall profitability and increasing barriers to entry.
Emerging Opportunities in Digital Pathology Market
Significant opportunities exist for long-term growth in the Digital Pathology market. The integration of advanced analytics and AI capabilities into digital pathology platforms will open doors for personalized medicine and predictive diagnostics. Strategic partnerships between technology providers and healthcare institutions can accelerate market penetration and foster innovation. Expansion into emerging markets with unmet healthcare needs offers substantial growth potential. Furthermore, the development of novel applications in drug discovery and research will create new revenue streams for market players.
Leading Players in the Digital Pathology Market Sector
- Visiopharm A/S
- Danaher Corporation (Leica Biosystems Nussloch GmbH)
- 3DHistech Ltd
- Nikon Corporation
- Proscia Inc
- F Hoffmann-La Roche Ltd (Ventana Medical Systems Inc)
- XIFIN Inc
- Leica Biosystems
- Koninklijke Philips NV
- Hamamatsu Photonics K K
- Mikroscan Technologies Inc
- Olympus Corporation
- Sectra AG
Key Milestones in Digital Pathology Market Industry
- June 2022: SpIntellx, Inc. and Inspirata collaborated to integrate SpIntellx HistoMapr-Breast and Inspirata's Dynamyx software, enhancing breast cancer diagnosis. This collaboration significantly improved workflow efficiency and diagnostic accuracy.
- June 2022: Roche launched the next-generation Ventana DP 600 slide scanner with CE-IVD marking. This product launch strengthened Roche's position in the market by offering advanced scanning capabilities.
Strategic Outlook for Digital Pathology Market Market
The future of the Digital Pathology market is promising, driven by continued technological advancements, increasing healthcare expenditure, and a growing demand for efficient and accurate diagnostic solutions. Strategic partnerships and collaborations will play a crucial role in shaping the market landscape. Expansion into emerging markets and development of new applications in areas like personalized medicine will unlock significant growth opportunities. Companies focused on innovation, data security, and seamless integration with existing healthcare workflows will be well-positioned to capitalize on the market's vast potential.
Digital Pathology Market Segmentation
-
1. Product
- 1.1. Scanner
- 1.2. Software
- 1.3. Storage Systems
- 1.4. Other Products
-
2. Application
- 2.1. Disease Diagnosis
- 2.2. Drug Discovery
- 2.3. Education and Training
-
3. End User
- 3.1. Pharmaceutical, Biotechnology, Companies and CROs
- 3.2. Hospital and Reference Laboratories
- 3.3. Other End Users
Digital Pathology Market Segmentation By Geography
-
1. North America
- 1.1. United States
- 1.2. Canada
- 1.3. Mexico
-
2. Europe
- 2.1. Germany
- 2.2. United Kingdom
- 2.3. France
- 2.4. Italy
- 2.5. Spain
- 2.6. Rest of Europe
-
3. Asia Pacific
- 3.1. China
- 3.2. Japan
- 3.3. India
- 3.4. Australia
- 3.5. South Korea
- 3.6. Rest of Asia Pacific
-
4. Middle East and Africa
- 4.1. GCC
- 4.2. South Africa
- 4.3. Rest of Middle East and Africa
-
5. South America
- 5.1. Brazil
- 5.2. Argentina
- 5.3. Rest of South America

Digital Pathology Market REPORT HIGHLIGHTS
| Aspects | Details |
|---|---|
| Study Period | 2019-2033 |
| Base Year | 2024 |
| Estimated Year | 2025 |
| Forecast Period | 2025-2033 |
| Historical Period | 2019-2024 |
| Growth Rate | CAGR of 9.99% from 2019-2033 |
| Segmentation |
|
Table of Contents
- 1. Introduction
- 1.1. Research Scope
- 1.2. Market Segmentation
- 1.3. Research Methodology
- 1.4. Definitions and Assumptions
- 2. Executive Summary
- 2.1. Introduction
- 3. Market Dynamics
- 3.1. Introduction
- 3.2. Market Drivers
- 3.2.1. Growing Number of Tele-consultations; Rising Adoption of Digital Pathology to Enhance Lab Efficiency; Increasing Application in Drug Discovery and Companion Diagnostics
- 3.3. Market Restrains
- 3.3.1. Stringent Regulatory Concerns for Primary Diagnosis; Lack of Standard Guidelines for Digital Pathology
- 3.4. Market Trends
- 3.4.1. Disease Diagnosis Segment is Expected to Hold Significant Share Over the Forecast Period
- 4. Market Factor Analysis
- 4.1. Porters Five Forces
- 4.2. Supply/Value Chain
- 4.3. PESTEL analysis
- 4.4. Market Entropy
- 4.5. Patent/Trademark Analysis
- 5. Global Digital Pathology Market Analysis, Insights and Forecast, 2019-2031
- 5.1. Market Analysis, Insights and Forecast - by Product
- 5.1.1. Scanner
- 5.1.2. Software
- 5.1.3. Storage Systems
- 5.1.4. Other Products
- 5.2. Market Analysis, Insights and Forecast - by Application
- 5.2.1. Disease Diagnosis
- 5.2.2. Drug Discovery
- 5.2.3. Education and Training
- 5.3. Market Analysis, Insights and Forecast - by End User
- 5.3.1. Pharmaceutical, Biotechnology, Companies and CROs
- 5.3.2. Hospital and Reference Laboratories
- 5.3.3. Other End Users
- 5.4. Market Analysis, Insights and Forecast - by Region
- 5.4.1. North America
- 5.4.2. Europe
- 5.4.3. Asia Pacific
- 5.4.4. Middle East and Africa
- 5.4.5. South America
- 5.1. Market Analysis, Insights and Forecast - by Product
- 6. North America Digital Pathology Market Analysis, Insights and Forecast, 2019-2031
- 6.1. Market Analysis, Insights and Forecast - by Product
- 6.1.1. Scanner
- 6.1.2. Software
- 6.1.3. Storage Systems
- 6.1.4. Other Products
- 6.2. Market Analysis, Insights and Forecast - by Application
- 6.2.1. Disease Diagnosis
- 6.2.2. Drug Discovery
- 6.2.3. Education and Training
- 6.3. Market Analysis, Insights and Forecast - by End User
- 6.3.1. Pharmaceutical, Biotechnology, Companies and CROs
- 6.3.2. Hospital and Reference Laboratories
- 6.3.3. Other End Users
- 6.1. Market Analysis, Insights and Forecast - by Product
- 7. Europe Digital Pathology Market Analysis, Insights and Forecast, 2019-2031
- 7.1. Market Analysis, Insights and Forecast - by Product
- 7.1.1. Scanner
- 7.1.2. Software
- 7.1.3. Storage Systems
- 7.1.4. Other Products
- 7.2. Market Analysis, Insights and Forecast - by Application
- 7.2.1. Disease Diagnosis
- 7.2.2. Drug Discovery
- 7.2.3. Education and Training
- 7.3. Market Analysis, Insights and Forecast - by End User
- 7.3.1. Pharmaceutical, Biotechnology, Companies and CROs
- 7.3.2. Hospital and Reference Laboratories
- 7.3.3. Other End Users
- 7.1. Market Analysis, Insights and Forecast - by Product
- 8. Asia Pacific Digital Pathology Market Analysis, Insights and Forecast, 2019-2031
- 8.1. Market Analysis, Insights and Forecast - by Product
- 8.1.1. Scanner
- 8.1.2. Software
- 8.1.3. Storage Systems
- 8.1.4. Other Products
- 8.2. Market Analysis, Insights and Forecast - by Application
- 8.2.1. Disease Diagnosis
- 8.2.2. Drug Discovery
- 8.2.3. Education and Training
- 8.3. Market Analysis, Insights and Forecast - by End User
- 8.3.1. Pharmaceutical, Biotechnology, Companies and CROs
- 8.3.2. Hospital and Reference Laboratories
- 8.3.3. Other End Users
- 8.1. Market Analysis, Insights and Forecast - by Product
- 9. Middle East and Africa Digital Pathology Market Analysis, Insights and Forecast, 2019-2031
- 9.1. Market Analysis, Insights and Forecast - by Product
- 9.1.1. Scanner
- 9.1.2. Software
- 9.1.3. Storage Systems
- 9.1.4. Other Products
- 9.2. Market Analysis, Insights and Forecast - by Application
- 9.2.1. Disease Diagnosis
- 9.2.2. Drug Discovery
- 9.2.3. Education and Training
- 9.3. Market Analysis, Insights and Forecast - by End User
- 9.3.1. Pharmaceutical, Biotechnology, Companies and CROs
- 9.3.2. Hospital and Reference Laboratories
- 9.3.3. Other End Users
- 9.1. Market Analysis, Insights and Forecast - by Product
- 10. South America Digital Pathology Market Analysis, Insights and Forecast, 2019-2031
- 10.1. Market Analysis, Insights and Forecast - by Product
- 10.1.1. Scanner
- 10.1.2. Software
- 10.1.3. Storage Systems
- 10.1.4. Other Products
- 10.2. Market Analysis, Insights and Forecast - by Application
- 10.2.1. Disease Diagnosis
- 10.2.2. Drug Discovery
- 10.2.3. Education and Training
- 10.3. Market Analysis, Insights and Forecast - by End User
- 10.3.1. Pharmaceutical, Biotechnology, Companies and CROs
- 10.3.2. Hospital and Reference Laboratories
- 10.3.3. Other End Users
- 10.1. Market Analysis, Insights and Forecast - by Product
- 11. North Americ Digital Pathology Market Analysis, Insights and Forecast, 2019-2031
- 11.1. Market Analysis, Insights and Forecast - By Country/Sub-region
- 11.1.1 United States
- 11.1.2 Canada
- 11.1.3 Mexico
- 12. South America Digital Pathology Market Analysis, Insights and Forecast, 2019-2031
- 12.1. Market Analysis, Insights and Forecast - By Country/Sub-region
- 12.1.1 Brazil
- 12.1.2 Mexico
- 12.1.3 Rest of South America
- 13. Europe Digital Pathology Market Analysis, Insights and Forecast, 2019-2031
- 13.1. Market Analysis, Insights and Forecast - By Country/Sub-region
- 13.1.1 Germany
- 13.1.2 United Kingdom
- 13.1.3 France
- 13.1.4 Italy
- 13.1.5 Spain
- 13.1.6 Rest of Europe
- 14. Asia Pacific Digital Pathology Market Analysis, Insights and Forecast, 2019-2031
- 14.1. Market Analysis, Insights and Forecast - By Country/Sub-region
- 14.1.1 China
- 14.1.2 Japan
- 14.1.3 India
- 14.1.4 South Korea
- 14.1.5 Taiwan
- 14.1.6 Australia
- 14.1.7 Rest of Asia-Pacific
- 15. MEA Digital Pathology Market Analysis, Insights and Forecast, 2019-2031
- 15.1. Market Analysis, Insights and Forecast - By Country/Sub-region
- 15.1.1 Middle East
- 15.1.2 Africa
- 16. Competitive Analysis
- 16.1. Global Market Share Analysis 2024
- 16.2. Company Profiles
- 16.2.1 Visiopharm A/S
- 16.2.1.1. Overview
- 16.2.1.2. Products
- 16.2.1.3. SWOT Analysis
- 16.2.1.4. Recent Developments
- 16.2.1.5. Financials (Based on Availability)
- 16.2.2 Danaher Corporation (Leica Biosystems Nussloch GmbH)
- 16.2.2.1. Overview
- 16.2.2.2. Products
- 16.2.2.3. SWOT Analysis
- 16.2.2.4. Recent Developments
- 16.2.2.5. Financials (Based on Availability)
- 16.2.3 3DHistech Ltd
- 16.2.3.1. Overview
- 16.2.3.2. Products
- 16.2.3.3. SWOT Analysis
- 16.2.3.4. Recent Developments
- 16.2.3.5. Financials (Based on Availability)
- 16.2.4 Nikon Corporation
- 16.2.4.1. Overview
- 16.2.4.2. Products
- 16.2.4.3. SWOT Analysis
- 16.2.4.4. Recent Developments
- 16.2.4.5. Financials (Based on Availability)
- 16.2.5 Proscia Inc
- 16.2.5.1. Overview
- 16.2.5.2. Products
- 16.2.5.3. SWOT Analysis
- 16.2.5.4. Recent Developments
- 16.2.5.5. Financials (Based on Availability)
- 16.2.6 F Hoffmann-La Roche Ltd (Ventana Medical Systems Inc )
- 16.2.6.1. Overview
- 16.2.6.2. Products
- 16.2.6.3. SWOT Analysis
- 16.2.6.4. Recent Developments
- 16.2.6.5. Financials (Based on Availability)
- 16.2.7 XIFIN Inc
- 16.2.7.1. Overview
- 16.2.7.2. Products
- 16.2.7.3. SWOT Analysis
- 16.2.7.4. Recent Developments
- 16.2.7.5. Financials (Based on Availability)
- 16.2.8 Leica Biosystems
- 16.2.8.1. Overview
- 16.2.8.2. Products
- 16.2.8.3. SWOT Analysis
- 16.2.8.4. Recent Developments
- 16.2.8.5. Financials (Based on Availability)
- 16.2.9 Koninklijke Philips NV
- 16.2.9.1. Overview
- 16.2.9.2. Products
- 16.2.9.3. SWOT Analysis
- 16.2.9.4. Recent Developments
- 16.2.9.5. Financials (Based on Availability)
- 16.2.10 Hamamatsu Photonics K K
- 16.2.10.1. Overview
- 16.2.10.2. Products
- 16.2.10.3. SWOT Analysis
- 16.2.10.4. Recent Developments
- 16.2.10.5. Financials (Based on Availability)
- 16.2.11 Mikroscan Technologies Inc
- 16.2.11.1. Overview
- 16.2.11.2. Products
- 16.2.11.3. SWOT Analysis
- 16.2.11.4. Recent Developments
- 16.2.11.5. Financials (Based on Availability)
- 16.2.12 Olympus Corporation
- 16.2.12.1. Overview
- 16.2.12.2. Products
- 16.2.12.3. SWOT Analysis
- 16.2.12.4. Recent Developments
- 16.2.12.5. Financials (Based on Availability)
- 16.2.13 Sectra AG
- 16.2.13.1. Overview
- 16.2.13.2. Products
- 16.2.13.3. SWOT Analysis
- 16.2.13.4. Recent Developments
- 16.2.13.5. Financials (Based on Availability)
- 16.2.1 Visiopharm A/S
List of Figures
- Figure 1: Global Digital Pathology Market Revenue Breakdown (Million, %) by Region 2024 & 2032
- Figure 2: North Americ Digital Pathology Market Revenue (Million), by Country 2024 & 2032
- Figure 3: North Americ Digital Pathology Market Revenue Share (%), by Country 2024 & 2032
- Figure 4: South America Digital Pathology Market Revenue (Million), by Country 2024 & 2032
- Figure 5: South America Digital Pathology Market Revenue Share (%), by Country 2024 & 2032
- Figure 6: Europe Digital Pathology Market Revenue (Million), by Country 2024 & 2032
- Figure 7: Europe Digital Pathology Market Revenue Share (%), by Country 2024 & 2032
- Figure 8: Asia Pacific Digital Pathology Market Revenue (Million), by Country 2024 & 2032
- Figure 9: Asia Pacific Digital Pathology Market Revenue Share (%), by Country 2024 & 2032
- Figure 10: MEA Digital Pathology Market Revenue (Million), by Country 2024 & 2032
- Figure 11: MEA Digital Pathology Market Revenue Share (%), by Country 2024 & 2032
- Figure 12: North America Digital Pathology Market Revenue (Million), by Product 2024 & 2032
- Figure 13: North America Digital Pathology Market Revenue Share (%), by Product 2024 & 2032
- Figure 14: North America Digital Pathology Market Revenue (Million), by Application 2024 & 2032
- Figure 15: North America Digital Pathology Market Revenue Share (%), by Application 2024 & 2032
- Figure 16: North America Digital Pathology Market Revenue (Million), by End User 2024 & 2032
- Figure 17: North America Digital Pathology Market Revenue Share (%), by End User 2024 & 2032
- Figure 18: North America Digital Pathology Market Revenue (Million), by Country 2024 & 2032
- Figure 19: North America Digital Pathology Market Revenue Share (%), by Country 2024 & 2032
- Figure 20: Europe Digital Pathology Market Revenue (Million), by Product 2024 & 2032
- Figure 21: Europe Digital Pathology Market Revenue Share (%), by Product 2024 & 2032
- Figure 22: Europe Digital Pathology Market Revenue (Million), by Application 2024 & 2032
- Figure 23: Europe Digital Pathology Market Revenue Share (%), by Application 2024 & 2032
- Figure 24: Europe Digital Pathology Market Revenue (Million), by End User 2024 & 2032
- Figure 25: Europe Digital Pathology Market Revenue Share (%), by End User 2024 & 2032
- Figure 26: Europe Digital Pathology Market Revenue (Million), by Country 2024 & 2032
- Figure 27: Europe Digital Pathology Market Revenue Share (%), by Country 2024 & 2032
- Figure 28: Asia Pacific Digital Pathology Market Revenue (Million), by Product 2024 & 2032
- Figure 29: Asia Pacific Digital Pathology Market Revenue Share (%), by Product 2024 & 2032
- Figure 30: Asia Pacific Digital Pathology Market Revenue (Million), by Application 2024 & 2032
- Figure 31: Asia Pacific Digital Pathology Market Revenue Share (%), by Application 2024 & 2032
- Figure 32: Asia Pacific Digital Pathology Market Revenue (Million), by End User 2024 & 2032
- Figure 33: Asia Pacific Digital Pathology Market Revenue Share (%), by End User 2024 & 2032
- Figure 34: Asia Pacific Digital Pathology Market Revenue (Million), by Country 2024 & 2032
- Figure 35: Asia Pacific Digital Pathology Market Revenue Share (%), by Country 2024 & 2032
- Figure 36: Middle East and Africa Digital Pathology Market Revenue (Million), by Product 2024 & 2032
- Figure 37: Middle East and Africa Digital Pathology Market Revenue Share (%), by Product 2024 & 2032
- Figure 38: Middle East and Africa Digital Pathology Market Revenue (Million), by Application 2024 & 2032
- Figure 39: Middle East and Africa Digital Pathology Market Revenue Share (%), by Application 2024 & 2032
- Figure 40: Middle East and Africa Digital Pathology Market Revenue (Million), by End User 2024 & 2032
- Figure 41: Middle East and Africa Digital Pathology Market Revenue Share (%), by End User 2024 & 2032
- Figure 42: Middle East and Africa Digital Pathology Market Revenue (Million), by Country 2024 & 2032
- Figure 43: Middle East and Africa Digital Pathology Market Revenue Share (%), by Country 2024 & 2032
- Figure 44: South America Digital Pathology Market Revenue (Million), by Product 2024 & 2032
- Figure 45: South America Digital Pathology Market Revenue Share (%), by Product 2024 & 2032
- Figure 46: South America Digital Pathology Market Revenue (Million), by Application 2024 & 2032
- Figure 47: South America Digital Pathology Market Revenue Share (%), by Application 2024 & 2032
- Figure 48: South America Digital Pathology Market Revenue (Million), by End User 2024 & 2032
- Figure 49: South America Digital Pathology Market Revenue Share (%), by End User 2024 & 2032
- Figure 50: South America Digital Pathology Market Revenue (Million), by Country 2024 & 2032
- Figure 51: South America Digital Pathology Market Revenue Share (%), by Country 2024 & 2032
List of Tables
- Table 1: Global Digital Pathology Market Revenue Million Forecast, by Region 2019 & 2032
- Table 2: Global Digital Pathology Market Revenue Million Forecast, by Product 2019 & 2032
- Table 3: Global Digital Pathology Market Revenue Million Forecast, by Application 2019 & 2032
- Table 4: Global Digital Pathology Market Revenue Million Forecast, by End User 2019 & 2032
- Table 5: Global Digital Pathology Market Revenue Million Forecast, by Region 2019 & 2032
- Table 6: Global Digital Pathology Market Revenue Million Forecast, by Country 2019 & 2032
- Table 7: United States Digital Pathology Market Revenue (Million) Forecast, by Application 2019 & 2032
- Table 8: Canada Digital Pathology Market Revenue (Million) Forecast, by Application 2019 & 2032
- Table 9: Mexico Digital Pathology Market Revenue (Million) Forecast, by Application 2019 & 2032
- Table 10: Global Digital Pathology Market Revenue Million Forecast, by Country 2019 & 2032
- Table 11: Brazil Digital Pathology Market Revenue (Million) Forecast, by Application 2019 & 2032
- Table 12: Mexico Digital Pathology Market Revenue (Million) Forecast, by Application 2019 & 2032
- Table 13: Rest of South America Digital Pathology Market Revenue (Million) Forecast, by Application 2019 & 2032
- Table 14: Global Digital Pathology Market Revenue Million Forecast, by Country 2019 & 2032
- Table 15: Germany Digital Pathology Market Revenue (Million) Forecast, by Application 2019 & 2032
- Table 16: United Kingdom Digital Pathology Market Revenue (Million) Forecast, by Application 2019 & 2032
- Table 17: France Digital Pathology Market Revenue (Million) Forecast, by Application 2019 & 2032
- Table 18: Italy Digital Pathology Market Revenue (Million) Forecast, by Application 2019 & 2032
- Table 19: Spain Digital Pathology Market Revenue (Million) Forecast, by Application 2019 & 2032
- Table 20: Rest of Europe Digital Pathology Market Revenue (Million) Forecast, by Application 2019 & 2032
- Table 21: Global Digital Pathology Market Revenue Million Forecast, by Country 2019 & 2032
- Table 22: China Digital Pathology Market Revenue (Million) Forecast, by Application 2019 & 2032
- Table 23: Japan Digital Pathology Market Revenue (Million) Forecast, by Application 2019 & 2032
- Table 24: India Digital Pathology Market Revenue (Million) Forecast, by Application 2019 & 2032
- Table 25: South Korea Digital Pathology Market Revenue (Million) Forecast, by Application 2019 & 2032
- Table 26: Taiwan Digital Pathology Market Revenue (Million) Forecast, by Application 2019 & 2032
- Table 27: Australia Digital Pathology Market Revenue (Million) Forecast, by Application 2019 & 2032
- Table 28: Rest of Asia-Pacific Digital Pathology Market Revenue (Million) Forecast, by Application 2019 & 2032
- Table 29: Global Digital Pathology Market Revenue Million Forecast, by Country 2019 & 2032
- Table 30: Middle East Digital Pathology Market Revenue (Million) Forecast, by Application 2019 & 2032
- Table 31: Africa Digital Pathology Market Revenue (Million) Forecast, by Application 2019 & 2032
- Table 32: Global Digital Pathology Market Revenue Million Forecast, by Product 2019 & 2032
- Table 33: Global Digital Pathology Market Revenue Million Forecast, by Application 2019 & 2032
- Table 34: Global Digital Pathology Market Revenue Million Forecast, by End User 2019 & 2032
- Table 35: Global Digital Pathology Market Revenue Million Forecast, by Country 2019 & 2032
- Table 36: United States Digital Pathology Market Revenue (Million) Forecast, by Application 2019 & 2032
- Table 37: Canada Digital Pathology Market Revenue (Million) Forecast, by Application 2019 & 2032
- Table 38: Mexico Digital Pathology Market Revenue (Million) Forecast, by Application 2019 & 2032
- Table 39: Global Digital Pathology Market Revenue Million Forecast, by Product 2019 & 2032
- Table 40: Global Digital Pathology Market Revenue Million Forecast, by Application 2019 & 2032
- Table 41: Global Digital Pathology Market Revenue Million Forecast, by End User 2019 & 2032
- Table 42: Global Digital Pathology Market Revenue Million Forecast, by Country 2019 & 2032
- Table 43: Germany Digital Pathology Market Revenue (Million) Forecast, by Application 2019 & 2032
- Table 44: United Kingdom Digital Pathology Market Revenue (Million) Forecast, by Application 2019 & 2032
- Table 45: France Digital Pathology Market Revenue (Million) Forecast, by Application 2019 & 2032
- Table 46: Italy Digital Pathology Market Revenue (Million) Forecast, by Application 2019 & 2032
- Table 47: Spain Digital Pathology Market Revenue (Million) Forecast, by Application 2019 & 2032
- Table 48: Rest of Europe Digital Pathology Market Revenue (Million) Forecast, by Application 2019 & 2032
- Table 49: Global Digital Pathology Market Revenue Million Forecast, by Product 2019 & 2032
- Table 50: Global Digital Pathology Market Revenue Million Forecast, by Application 2019 & 2032
- Table 51: Global Digital Pathology Market Revenue Million Forecast, by End User 2019 & 2032
- Table 52: Global Digital Pathology Market Revenue Million Forecast, by Country 2019 & 2032
- Table 53: China Digital Pathology Market Revenue (Million) Forecast, by Application 2019 & 2032
- Table 54: Japan Digital Pathology Market Revenue (Million) Forecast, by Application 2019 & 2032
- Table 55: India Digital Pathology Market Revenue (Million) Forecast, by Application 2019 & 2032
- Table 56: Australia Digital Pathology Market Revenue (Million) Forecast, by Application 2019 & 2032
- Table 57: South Korea Digital Pathology Market Revenue (Million) Forecast, by Application 2019 & 2032
- Table 58: Rest of Asia Pacific Digital Pathology Market Revenue (Million) Forecast, by Application 2019 & 2032
- Table 59: Global Digital Pathology Market Revenue Million Forecast, by Product 2019 & 2032
- Table 60: Global Digital Pathology Market Revenue Million Forecast, by Application 2019 & 2032
- Table 61: Global Digital Pathology Market Revenue Million Forecast, by End User 2019 & 2032
- Table 62: Global Digital Pathology Market Revenue Million Forecast, by Country 2019 & 2032
- Table 63: GCC Digital Pathology Market Revenue (Million) Forecast, by Application 2019 & 2032
- Table 64: South Africa Digital Pathology Market Revenue (Million) Forecast, by Application 2019 & 2032
- Table 65: Rest of Middle East and Africa Digital Pathology Market Revenue (Million) Forecast, by Application 2019 & 2032
- Table 66: Global Digital Pathology Market Revenue Million Forecast, by Product 2019 & 2032
- Table 67: Global Digital Pathology Market Revenue Million Forecast, by Application 2019 & 2032
- Table 68: Global Digital Pathology Market Revenue Million Forecast, by End User 2019 & 2032
- Table 69: Global Digital Pathology Market Revenue Million Forecast, by Country 2019 & 2032
- Table 70: Brazil Digital Pathology Market Revenue (Million) Forecast, by Application 2019 & 2032
- Table 71: Argentina Digital Pathology Market Revenue (Million) Forecast, by Application 2019 & 2032
- Table 72: Rest of South America Digital Pathology Market Revenue (Million) Forecast, by Application 2019 & 2032
Frequently Asked Questions
1. What is the projected Compound Annual Growth Rate (CAGR) of the Digital Pathology Market?
The projected CAGR is approximately 9.99%.
2. Which companies are prominent players in the Digital Pathology Market?
Key companies in the market include Visiopharm A/S, Danaher Corporation (Leica Biosystems Nussloch GmbH), 3DHistech Ltd, Nikon Corporation, Proscia Inc, F Hoffmann-La Roche Ltd (Ventana Medical Systems Inc ), XIFIN Inc, Leica Biosystems, Koninklijke Philips NV, Hamamatsu Photonics K K, Mikroscan Technologies Inc, Olympus Corporation, Sectra AG.
3. What are the main segments of the Digital Pathology Market?
The market segments include Product, Application, End User.
4. Can you provide details about the market size?
The market size is estimated to be USD 1.18 Million as of 2022.
5. What are some drivers contributing to market growth?
Growing Number of Tele-consultations; Rising Adoption of Digital Pathology to Enhance Lab Efficiency; Increasing Application in Drug Discovery and Companion Diagnostics.
6. What are the notable trends driving market growth?
Disease Diagnosis Segment is Expected to Hold Significant Share Over the Forecast Period.
7. Are there any restraints impacting market growth?
Stringent Regulatory Concerns for Primary Diagnosis; Lack of Standard Guidelines for Digital Pathology.
8. Can you provide examples of recent developments in the market?
June 2022: SpIntellx, Inc. and Inspirata have collaborated to integrate the SpIntellx HistoMapr-Breast platform and Inspirata's Dynamyx software into one seamless solution. HistoMapr-Breast is the one and only computational pathology software that taps the power of explainable artificial intelligence (xAI) for healthcare providers to diagnose, prognosticate and treat breast cancer more efficiently and accurately.
9. What pricing options are available for accessing the report?
Pricing options include single-user, multi-user, and enterprise licenses priced at USD 4750, USD 5250, and USD 8750 respectively.
10. Is the market size provided in terms of value or volume?
The market size is provided in terms of value, measured in Million.
11. Are there any specific market keywords associated with the report?
Yes, the market keyword associated with the report is "Digital Pathology Market," which aids in identifying and referencing the specific market segment covered.
12. How do I determine which pricing option suits my needs best?
The pricing options vary based on user requirements and access needs. Individual users may opt for single-user licenses, while businesses requiring broader access may choose multi-user or enterprise licenses for cost-effective access to the report.
13. Are there any additional resources or data provided in the Digital Pathology Market report?
While the report offers comprehensive insights, it's advisable to review the specific contents or supplementary materials provided to ascertain if additional resources or data are available.
14. How can I stay updated on further developments or reports in the Digital Pathology Market?
To stay informed about further developments, trends, and reports in the Digital Pathology Market, consider subscribing to industry newsletters, following relevant companies and organizations, or regularly checking reputable industry news sources and publications.
Methodology
Step 1 - Identification of Relevant Samples Size from Population Database


Step 2 - Approaches for Defining Global Market Size (Value, Volume* & Price*)

Note*: In applicable scenarios
Step 3 - Data Sources
Primary Research
- Web Analytics
- Survey Reports
- Research Institute
- Latest Research Reports
- Opinion Leaders
Secondary Research
- Annual Reports
- White Paper
- Latest Press Release
- Industry Association
- Paid Database
- Investor Presentations

Step 4 - Data Triangulation
Involves using different sources of information in order to increase the validity of a study
These sources are likely to be stakeholders in a program - participants, other researchers, program staff, other community members, and so on.
Then we put all data in single framework & apply various statistical tools to find out the dynamic on the market.
During the analysis stage, feedback from the stakeholder groups would be compared to determine areas of agreement as well as areas of divergence
