

Key Insights
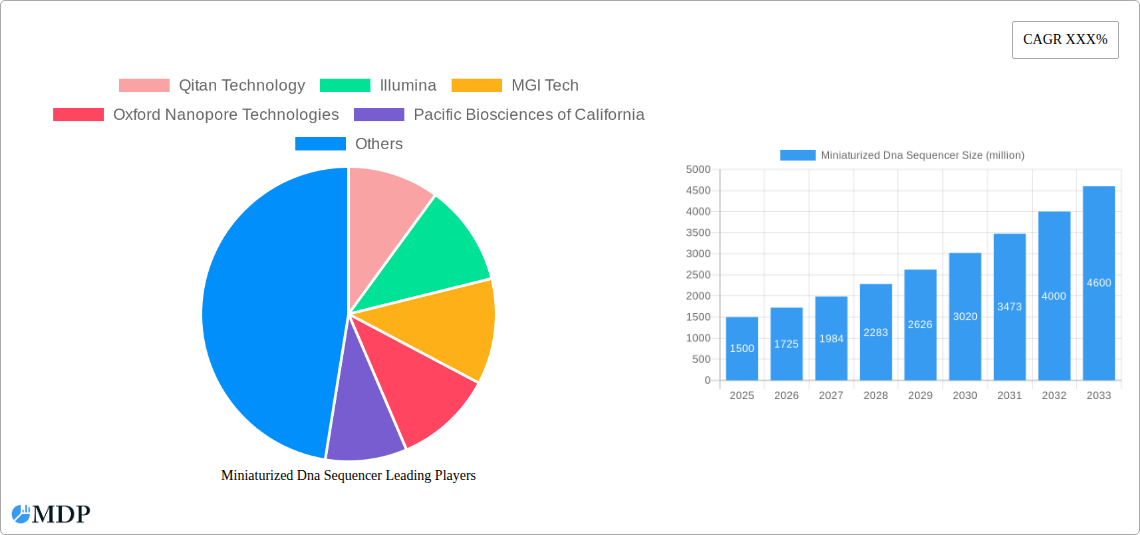
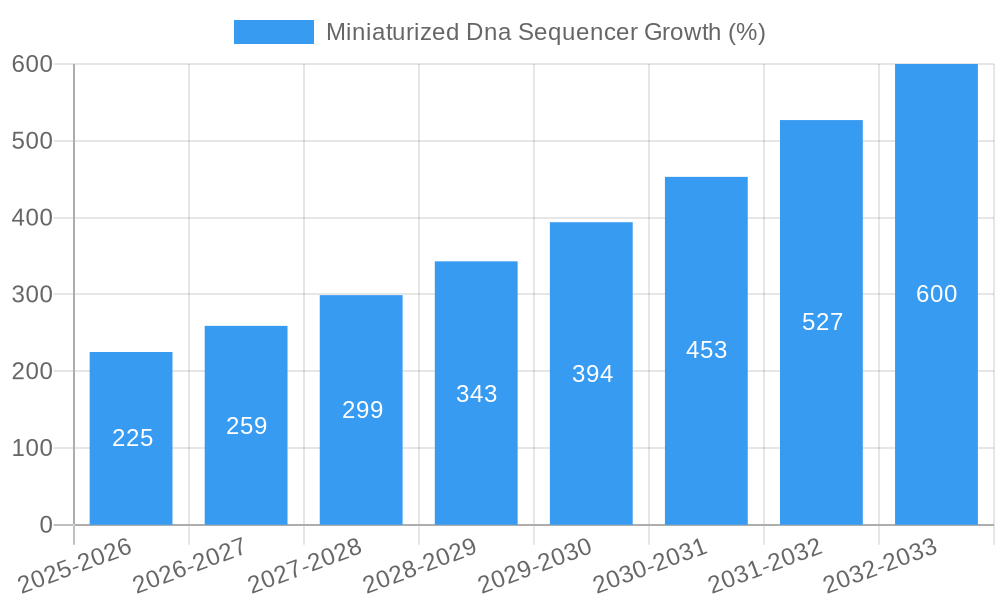
The miniaturized DNA sequencer market is experiencing robust growth, driven by the increasing demand for rapid, portable, and cost-effective DNA sequencing solutions. The market's expansion is fueled by several key factors: the rising prevalence of infectious diseases requiring rapid diagnostics, the growth of personalized medicine initiatives demanding quick genomic analysis, and advancements in microfluidics and nanotechnology enabling miniaturization. This trend towards smaller, more accessible sequencers is particularly impactful in point-of-care settings, remote areas, and resource-limited environments, where rapid diagnostics are crucial. Major players like Illumina, Oxford Nanopore Technologies, and Pacific Biosciences are actively investing in research and development, leading to continuous technological improvements and a wider range of applications. We estimate the market size in 2025 to be $1.5 billion, based on current market trends and the growth trajectory of related technologies. A conservative Compound Annual Growth Rate (CAGR) of 15% is projected from 2025 to 2033, suggesting significant market expansion in the coming years. This growth, however, faces some challenges, including the need for further technological advancements to reduce sequencing errors and improve data accuracy in miniaturized devices, alongside addressing regulatory hurdles for widespread adoption.
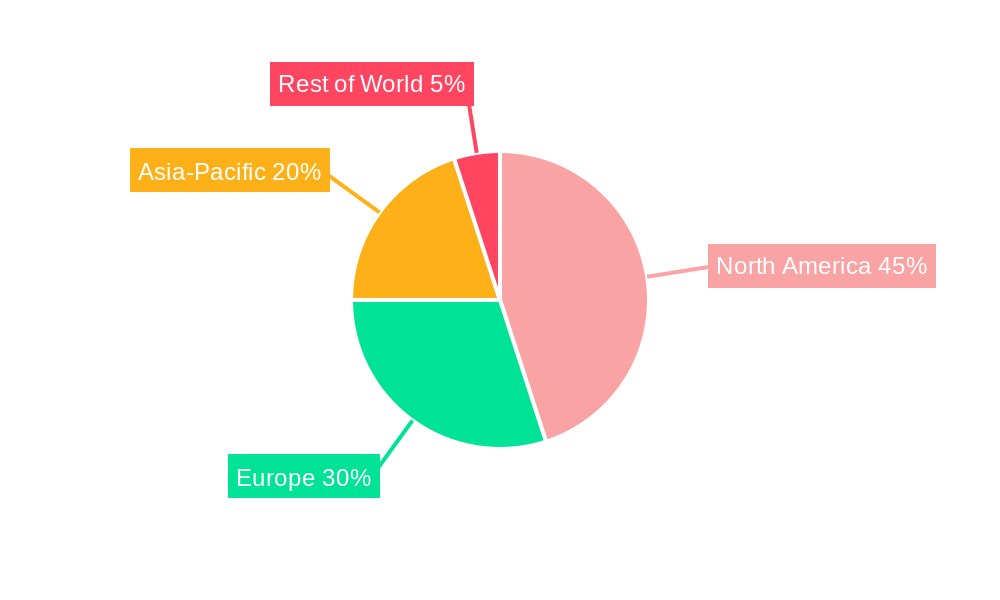
The competitive landscape is characterized by both established players and emerging companies vying for market share. The market is segmented by technology (e.g., nanopore sequencing, semiconductor sequencing), application (e.g., clinical diagnostics, research, environmental monitoring), and end-user (e.g., hospitals, research institutions, pharmaceutical companies). The North American market currently holds a significant share due to the robust healthcare infrastructure and strong research funding. However, Asia-Pacific is expected to witness rapid growth in the coming years due to increasing healthcare investments and expanding genomic research initiatives. The continued development of more affordable and user-friendly miniaturized DNA sequencers will be pivotal in driving widespread adoption and further market expansion across all segments and geographic regions.
Miniaturized DNA Sequencer Market Report: 2019-2033
This comprehensive report provides an in-depth analysis of the global miniaturized DNA sequencer market, offering invaluable insights for industry stakeholders, investors, and researchers. The report covers the period 2019-2033, with a focus on the estimated year 2025 and a forecast period of 2025-2033. The market is projected to reach a value of xx million by 2033, exhibiting a CAGR of xx% during the forecast period. This report analyzes market dynamics, leading players like Illumina, MGI Tech, Oxford Nanopore Technologies, Pacific Biosciences of California, and Qitan Technology, and explores emerging opportunities shaping this rapidly evolving landscape.
Miniaturized DNA Sequencer Market Dynamics & Concentration
The miniaturized DNA sequencer market is characterized by a dynamic interplay of factors influencing its concentration and growth. The market is moderately concentrated, with a few major players holding significant market share. Illumina currently holds approximately xx% market share, followed by MGI Tech at xx%, Oxford Nanopore Technologies at xx%, and Pacific Biosciences of California at xx%. Qitan Technology holds a smaller, but growing, share of the market at xx%. Innovation is a key driver, with companies continuously investing in R&D to improve sequencing speed, accuracy, and affordability. Regulatory frameworks, particularly those concerning data privacy and ethical considerations surrounding genomic information, significantly impact market growth. The emergence of alternative technologies and the increasing availability of data storage solutions provide competitive pressure and substitution possibilities. End-user trends, primarily driven by the growing need for faster and more cost-effective sequencing in various applications, such as personalized medicine, infectious disease diagnostics, and environmental monitoring, are boosting market expansion. Furthermore, M&A activities, including xx deals between 2019 and 2024, have consolidated market power and accelerated innovation.
Miniaturized DNA Sequencer Industry Trends & Analysis
The miniaturized DNA sequencer market is experiencing robust growth, driven by several key factors. The declining cost of sequencing is making the technology accessible to a wider range of users, leading to increased market penetration. Technological advancements, such as the development of more portable and user-friendly devices, are further accelerating market expansion. Consumer preference is shifting towards faster, more accurate, and easier-to-use sequencing technologies. The competitive landscape is dynamic, with companies constantly striving to improve their offerings and expand their market share through innovation and strategic partnerships. The market's CAGR during the historical period (2019-2024) was xx%, and is projected to reach xx% during the forecast period (2025-2033). This growth is fueled by increasing adoption across diverse applications, including research, clinical diagnostics, and forensic science.
Leading Markets & Segments in Miniaturized DNA Sequencer
The North American market currently dominates the global miniaturized DNA sequencer landscape, accounting for approximately xx million in revenue in 2025. This dominance is driven by several factors:
- Strong R&D investment: Significant funding from both public and private sources fuels innovation and market growth.
- Advanced healthcare infrastructure: Well-established healthcare systems facilitate rapid adoption of new technologies.
- Favorable regulatory environment: Supportive regulatory frameworks expedite the market entry of new products.
Europe and Asia-Pacific also represent significant markets, with growth projected to be particularly strong in Asia-Pacific due to increasing investments in healthcare infrastructure and rising prevalence of diseases. The clinical diagnostics segment holds the largest market share, followed by the research segment. The personalized medicine segment is expected to experience significant growth in the coming years.
Miniaturized DNA Sequencer Product Developments
Recent product developments have focused on enhancing sequencing speed, accuracy, and portability. Several companies are developing miniaturized devices capable of performing sequencing in the field, expanding the applications of this technology. Integration of advanced data analysis tools within sequencing platforms is also a prominent trend. The increased focus on user-friendly interfaces and simplified workflows is making the technology more accessible to researchers and clinicians with limited expertise in genomics.
Key Drivers of Miniaturized Dna Sequencer Growth
Several factors are driving the growth of the miniaturized DNA sequencer market. These include:
- Technological advancements: Continuous innovations in sequencing technologies are reducing costs and improving accuracy and speed.
- Falling costs: The decreasing cost of sequencing makes the technology more accessible to a wider range of users.
- Increasing applications: The use of miniaturized DNA sequencers is expanding across various fields including personalized medicine, infectious disease diagnostics, and environmental monitoring.
- Favorable regulatory landscape: Supportive government regulations and policies are promoting the adoption of this technology.
Challenges in the Miniaturized Dna Sequencer Market
Despite significant growth potential, the miniaturized DNA sequencer market faces several challenges. Regulatory hurdles related to data privacy and ethical considerations can impede market penetration. Supply chain disruptions, especially regarding critical components, can affect production and availability. Intense competition among established players and new entrants exerts significant pressure on pricing and profitability. These factors can collectively reduce market growth by an estimated xx% annually.
Emerging Opportunities in Miniaturized Dna Sequencer
The long-term outlook for the miniaturized DNA sequencer market is positive. Emerging technologies such as nanopore sequencing and single-molecule sequencing offer exciting possibilities for further miniaturization, increased accuracy, and cost reduction. Strategic partnerships between technology providers and healthcare institutions can expand market access and drive adoption. The continued expansion into new applications, particularly in point-of-care diagnostics and environmental monitoring, offers significant growth potential.
Leading Players in the Miniaturized Dna Sequencer Sector
- Illumina
- MGI Tech
- Oxford Nanopore Technologies
- Pacific Biosciences of California
- Qitan Technology
Key Milestones in Miniaturized Dna Sequencer Industry
- 2020: Illumina launched a new miniaturized sequencer with improved speed and accuracy.
- 2021: Oxford Nanopore Technologies released a portable sequencer designed for field applications.
- 2022: MGI Tech announced a strategic partnership to expand its market reach in North America.
- 2023: Pacific Biosciences of California introduced a new sequencing platform with enhanced data analysis capabilities.
- 2024: Qitan Technology secured significant funding to accelerate its product development.
Strategic Outlook for Miniaturized Dna Sequencer Market
The miniaturized DNA sequencer market is poised for significant growth in the coming years. Continued technological advancements, declining costs, and expanding applications will drive market expansion. Strategic partnerships and collaborations between technology providers, healthcare institutions, and research organizations will be critical for successful market penetration. Focus on developing user-friendly and portable devices, along with robust data analysis tools, will be key to capturing market share. The market's future is bright, with considerable potential for innovation and growth across a wide spectrum of applications.
Miniaturized Dna Sequencer Segmentation
-
1. Application
- 1.1. Criminal Investigation
- 1.2. Hospitals & Clinics
- 1.3. Scientific Research
-
2. Type
- 2.1. Nanopore sequencing
- 2.2. Single-Molecule Real-Time Sequencing
Miniaturized Dna Sequencer Segmentation By Geography
-
1. North America
- 1.1. United States
- 1.2. Canada
- 1.3. Mexico
-
2. South America
- 2.1. Brazil
- 2.2. Argentina
- 2.3. Rest of South America
-
3. Europe
- 3.1. United Kingdom
- 3.2. Germany
- 3.3. France
- 3.4. Italy
- 3.5. Spain
- 3.6. Russia
- 3.7. Benelux
- 3.8. Nordics
- 3.9. Rest of Europe
-
4. Middle East & Africa
- 4.1. Turkey
- 4.2. Israel
- 4.3. GCC
- 4.4. North Africa
- 4.5. South Africa
- 4.6. Rest of Middle East & Africa
-
5. Asia Pacific
- 5.1. China
- 5.2. India
- 5.3. Japan
- 5.4. South Korea
- 5.5. ASEAN
- 5.6. Oceania
- 5.7. Rest of Asia Pacific
Miniaturized Dna Sequencer REPORT HIGHLIGHTS
| Aspects | Details |
|---|---|
| Study Period | 2019-2033 |
| Base Year | 2024 |
| Estimated Year | 2025 |
| Forecast Period | 2025-2033 |
| Historical Period | 2019-2024 |
| Growth Rate | CAGR of XXX% from 2019-2033 |
| Segmentation |
|
Table of Contents
- 1. Introduction
- 1.1. Research Scope
- 1.2. Market Segmentation
- 1.3. Research Methodology
- 1.4. Definitions and Assumptions
- 2. Executive Summary
- 2.1. Introduction
- 3. Market Dynamics
- 3.1. Introduction
- 3.2. Market Drivers
- 3.3. Market Restrains
- 3.4. Market Trends
- 4. Market Factor Analysis
- 4.1. Porters Five Forces
- 4.2. Supply/Value Chain
- 4.3. PESTEL analysis
- 4.4. Market Entropy
- 4.5. Patent/Trademark Analysis
- 5. Global Miniaturized Dna Sequencer Analysis, Insights and Forecast, 2019-2031
- 5.1. Market Analysis, Insights and Forecast - by Application
- 5.1.1. Criminal Investigation
- 5.1.2. Hospitals & Clinics
- 5.1.3. Scientific Research
- 5.2. Market Analysis, Insights and Forecast - by Type
- 5.2.1. Nanopore sequencing
- 5.2.2. Single-Molecule Real-Time Sequencing
- 5.3. Market Analysis, Insights and Forecast - by Region
- 5.3.1. North America
- 5.3.2. South America
- 5.3.3. Europe
- 5.3.4. Middle East & Africa
- 5.3.5. Asia Pacific
- 5.1. Market Analysis, Insights and Forecast - by Application
- 6. North America Miniaturized Dna Sequencer Analysis, Insights and Forecast, 2019-2031
- 6.1. Market Analysis, Insights and Forecast - by Application
- 6.1.1. Criminal Investigation
- 6.1.2. Hospitals & Clinics
- 6.1.3. Scientific Research
- 6.2. Market Analysis, Insights and Forecast - by Type
- 6.2.1. Nanopore sequencing
- 6.2.2. Single-Molecule Real-Time Sequencing
- 6.1. Market Analysis, Insights and Forecast - by Application
- 7. South America Miniaturized Dna Sequencer Analysis, Insights and Forecast, 2019-2031
- 7.1. Market Analysis, Insights and Forecast - by Application
- 7.1.1. Criminal Investigation
- 7.1.2. Hospitals & Clinics
- 7.1.3. Scientific Research
- 7.2. Market Analysis, Insights and Forecast - by Type
- 7.2.1. Nanopore sequencing
- 7.2.2. Single-Molecule Real-Time Sequencing
- 7.1. Market Analysis, Insights and Forecast - by Application
- 8. Europe Miniaturized Dna Sequencer Analysis, Insights and Forecast, 2019-2031
- 8.1. Market Analysis, Insights and Forecast - by Application
- 8.1.1. Criminal Investigation
- 8.1.2. Hospitals & Clinics
- 8.1.3. Scientific Research
- 8.2. Market Analysis, Insights and Forecast - by Type
- 8.2.1. Nanopore sequencing
- 8.2.2. Single-Molecule Real-Time Sequencing
- 8.1. Market Analysis, Insights and Forecast - by Application
- 9. Middle East & Africa Miniaturized Dna Sequencer Analysis, Insights and Forecast, 2019-2031
- 9.1. Market Analysis, Insights and Forecast - by Application
- 9.1.1. Criminal Investigation
- 9.1.2. Hospitals & Clinics
- 9.1.3. Scientific Research
- 9.2. Market Analysis, Insights and Forecast - by Type
- 9.2.1. Nanopore sequencing
- 9.2.2. Single-Molecule Real-Time Sequencing
- 9.1. Market Analysis, Insights and Forecast - by Application
- 10. Asia Pacific Miniaturized Dna Sequencer Analysis, Insights and Forecast, 2019-2031
- 10.1. Market Analysis, Insights and Forecast - by Application
- 10.1.1. Criminal Investigation
- 10.1.2. Hospitals & Clinics
- 10.1.3. Scientific Research
- 10.2. Market Analysis, Insights and Forecast - by Type
- 10.2.1. Nanopore sequencing
- 10.2.2. Single-Molecule Real-Time Sequencing
- 10.1. Market Analysis, Insights and Forecast - by Application
- 11. Competitive Analysis
- 11.1. Global Market Share Analysis 2024
- 11.2. Company Profiles
- 11.2.1 Qitan Technology
- 11.2.1.1. Overview
- 11.2.1.2. Products
- 11.2.1.3. SWOT Analysis
- 11.2.1.4. Recent Developments
- 11.2.1.5. Financials (Based on Availability)
- 11.2.2 Illumina
- 11.2.2.1. Overview
- 11.2.2.2. Products
- 11.2.2.3. SWOT Analysis
- 11.2.2.4. Recent Developments
- 11.2.2.5. Financials (Based on Availability)
- 11.2.3 MGI Tech
- 11.2.3.1. Overview
- 11.2.3.2. Products
- 11.2.3.3. SWOT Analysis
- 11.2.3.4. Recent Developments
- 11.2.3.5. Financials (Based on Availability)
- 11.2.4 Oxford Nanopore Technologies
- 11.2.4.1. Overview
- 11.2.4.2. Products
- 11.2.4.3. SWOT Analysis
- 11.2.4.4. Recent Developments
- 11.2.4.5. Financials (Based on Availability)
- 11.2.5 Pacific Biosciences of California
- 11.2.5.1. Overview
- 11.2.5.2. Products
- 11.2.5.3. SWOT Analysis
- 11.2.5.4. Recent Developments
- 11.2.5.5. Financials (Based on Availability)
- 11.2.1 Qitan Technology
List of Figures
- Figure 1: Global Miniaturized Dna Sequencer Revenue Breakdown (million, %) by Region 2024 & 2032
- Figure 2: Global Miniaturized Dna Sequencer Volume Breakdown (K, %) by Region 2024 & 2032
- Figure 3: North America Miniaturized Dna Sequencer Revenue (million), by Application 2024 & 2032
- Figure 4: North America Miniaturized Dna Sequencer Volume (K), by Application 2024 & 2032
- Figure 5: North America Miniaturized Dna Sequencer Revenue Share (%), by Application 2024 & 2032
- Figure 6: North America Miniaturized Dna Sequencer Volume Share (%), by Application 2024 & 2032
- Figure 7: North America Miniaturized Dna Sequencer Revenue (million), by Type 2024 & 2032
- Figure 8: North America Miniaturized Dna Sequencer Volume (K), by Type 2024 & 2032
- Figure 9: North America Miniaturized Dna Sequencer Revenue Share (%), by Type 2024 & 2032
- Figure 10: North America Miniaturized Dna Sequencer Volume Share (%), by Type 2024 & 2032
- Figure 11: North America Miniaturized Dna Sequencer Revenue (million), by Country 2024 & 2032
- Figure 12: North America Miniaturized Dna Sequencer Volume (K), by Country 2024 & 2032
- Figure 13: North America Miniaturized Dna Sequencer Revenue Share (%), by Country 2024 & 2032
- Figure 14: North America Miniaturized Dna Sequencer Volume Share (%), by Country 2024 & 2032
- Figure 15: South America Miniaturized Dna Sequencer Revenue (million), by Application 2024 & 2032
- Figure 16: South America Miniaturized Dna Sequencer Volume (K), by Application 2024 & 2032
- Figure 17: South America Miniaturized Dna Sequencer Revenue Share (%), by Application 2024 & 2032
- Figure 18: South America Miniaturized Dna Sequencer Volume Share (%), by Application 2024 & 2032
- Figure 19: South America Miniaturized Dna Sequencer Revenue (million), by Type 2024 & 2032
- Figure 20: South America Miniaturized Dna Sequencer Volume (K), by Type 2024 & 2032
- Figure 21: South America Miniaturized Dna Sequencer Revenue Share (%), by Type 2024 & 2032
- Figure 22: South America Miniaturized Dna Sequencer Volume Share (%), by Type 2024 & 2032
- Figure 23: South America Miniaturized Dna Sequencer Revenue (million), by Country 2024 & 2032
- Figure 24: South America Miniaturized Dna Sequencer Volume (K), by Country 2024 & 2032
- Figure 25: South America Miniaturized Dna Sequencer Revenue Share (%), by Country 2024 & 2032
- Figure 26: South America Miniaturized Dna Sequencer Volume Share (%), by Country 2024 & 2032
- Figure 27: Europe Miniaturized Dna Sequencer Revenue (million), by Application 2024 & 2032
- Figure 28: Europe Miniaturized Dna Sequencer Volume (K), by Application 2024 & 2032
- Figure 29: Europe Miniaturized Dna Sequencer Revenue Share (%), by Application 2024 & 2032
- Figure 30: Europe Miniaturized Dna Sequencer Volume Share (%), by Application 2024 & 2032
- Figure 31: Europe Miniaturized Dna Sequencer Revenue (million), by Type 2024 & 2032
- Figure 32: Europe Miniaturized Dna Sequencer Volume (K), by Type 2024 & 2032
- Figure 33: Europe Miniaturized Dna Sequencer Revenue Share (%), by Type 2024 & 2032
- Figure 34: Europe Miniaturized Dna Sequencer Volume Share (%), by Type 2024 & 2032
- Figure 35: Europe Miniaturized Dna Sequencer Revenue (million), by Country 2024 & 2032
- Figure 36: Europe Miniaturized Dna Sequencer Volume (K), by Country 2024 & 2032
- Figure 37: Europe Miniaturized Dna Sequencer Revenue Share (%), by Country 2024 & 2032
- Figure 38: Europe Miniaturized Dna Sequencer Volume Share (%), by Country 2024 & 2032
- Figure 39: Middle East & Africa Miniaturized Dna Sequencer Revenue (million), by Application 2024 & 2032
- Figure 40: Middle East & Africa Miniaturized Dna Sequencer Volume (K), by Application 2024 & 2032
- Figure 41: Middle East & Africa Miniaturized Dna Sequencer Revenue Share (%), by Application 2024 & 2032
- Figure 42: Middle East & Africa Miniaturized Dna Sequencer Volume Share (%), by Application 2024 & 2032
- Figure 43: Middle East & Africa Miniaturized Dna Sequencer Revenue (million), by Type 2024 & 2032
- Figure 44: Middle East & Africa Miniaturized Dna Sequencer Volume (K), by Type 2024 & 2032
- Figure 45: Middle East & Africa Miniaturized Dna Sequencer Revenue Share (%), by Type 2024 & 2032
- Figure 46: Middle East & Africa Miniaturized Dna Sequencer Volume Share (%), by Type 2024 & 2032
- Figure 47: Middle East & Africa Miniaturized Dna Sequencer Revenue (million), by Country 2024 & 2032
- Figure 48: Middle East & Africa Miniaturized Dna Sequencer Volume (K), by Country 2024 & 2032
- Figure 49: Middle East & Africa Miniaturized Dna Sequencer Revenue Share (%), by Country 2024 & 2032
- Figure 50: Middle East & Africa Miniaturized Dna Sequencer Volume Share (%), by Country 2024 & 2032
- Figure 51: Asia Pacific Miniaturized Dna Sequencer Revenue (million), by Application 2024 & 2032
- Figure 52: Asia Pacific Miniaturized Dna Sequencer Volume (K), by Application 2024 & 2032
- Figure 53: Asia Pacific Miniaturized Dna Sequencer Revenue Share (%), by Application 2024 & 2032
- Figure 54: Asia Pacific Miniaturized Dna Sequencer Volume Share (%), by Application 2024 & 2032
- Figure 55: Asia Pacific Miniaturized Dna Sequencer Revenue (million), by Type 2024 & 2032
- Figure 56: Asia Pacific Miniaturized Dna Sequencer Volume (K), by Type 2024 & 2032
- Figure 57: Asia Pacific Miniaturized Dna Sequencer Revenue Share (%), by Type 2024 & 2032
- Figure 58: Asia Pacific Miniaturized Dna Sequencer Volume Share (%), by Type 2024 & 2032
- Figure 59: Asia Pacific Miniaturized Dna Sequencer Revenue (million), by Country 2024 & 2032
- Figure 60: Asia Pacific Miniaturized Dna Sequencer Volume (K), by Country 2024 & 2032
- Figure 61: Asia Pacific Miniaturized Dna Sequencer Revenue Share (%), by Country 2024 & 2032
- Figure 62: Asia Pacific Miniaturized Dna Sequencer Volume Share (%), by Country 2024 & 2032
List of Tables
- Table 1: Global Miniaturized Dna Sequencer Revenue million Forecast, by Region 2019 & 2032
- Table 2: Global Miniaturized Dna Sequencer Volume K Forecast, by Region 2019 & 2032
- Table 3: Global Miniaturized Dna Sequencer Revenue million Forecast, by Application 2019 & 2032
- Table 4: Global Miniaturized Dna Sequencer Volume K Forecast, by Application 2019 & 2032
- Table 5: Global Miniaturized Dna Sequencer Revenue million Forecast, by Type 2019 & 2032
- Table 6: Global Miniaturized Dna Sequencer Volume K Forecast, by Type 2019 & 2032
- Table 7: Global Miniaturized Dna Sequencer Revenue million Forecast, by Region 2019 & 2032
- Table 8: Global Miniaturized Dna Sequencer Volume K Forecast, by Region 2019 & 2032
- Table 9: Global Miniaturized Dna Sequencer Revenue million Forecast, by Application 2019 & 2032
- Table 10: Global Miniaturized Dna Sequencer Volume K Forecast, by Application 2019 & 2032
- Table 11: Global Miniaturized Dna Sequencer Revenue million Forecast, by Type 2019 & 2032
- Table 12: Global Miniaturized Dna Sequencer Volume K Forecast, by Type 2019 & 2032
- Table 13: Global Miniaturized Dna Sequencer Revenue million Forecast, by Country 2019 & 2032
- Table 14: Global Miniaturized Dna Sequencer Volume K Forecast, by Country 2019 & 2032
- Table 15: United States Miniaturized Dna Sequencer Revenue (million) Forecast, by Application 2019 & 2032
- Table 16: United States Miniaturized Dna Sequencer Volume (K) Forecast, by Application 2019 & 2032
- Table 17: Canada Miniaturized Dna Sequencer Revenue (million) Forecast, by Application 2019 & 2032
- Table 18: Canada Miniaturized Dna Sequencer Volume (K) Forecast, by Application 2019 & 2032
- Table 19: Mexico Miniaturized Dna Sequencer Revenue (million) Forecast, by Application 2019 & 2032
- Table 20: Mexico Miniaturized Dna Sequencer Volume (K) Forecast, by Application 2019 & 2032
- Table 21: Global Miniaturized Dna Sequencer Revenue million Forecast, by Application 2019 & 2032
- Table 22: Global Miniaturized Dna Sequencer Volume K Forecast, by Application 2019 & 2032
- Table 23: Global Miniaturized Dna Sequencer Revenue million Forecast, by Type 2019 & 2032
- Table 24: Global Miniaturized Dna Sequencer Volume K Forecast, by Type 2019 & 2032
- Table 25: Global Miniaturized Dna Sequencer Revenue million Forecast, by Country 2019 & 2032
- Table 26: Global Miniaturized Dna Sequencer Volume K Forecast, by Country 2019 & 2032
- Table 27: Brazil Miniaturized Dna Sequencer Revenue (million) Forecast, by Application 2019 & 2032
- Table 28: Brazil Miniaturized Dna Sequencer Volume (K) Forecast, by Application 2019 & 2032
- Table 29: Argentina Miniaturized Dna Sequencer Revenue (million) Forecast, by Application 2019 & 2032
- Table 30: Argentina Miniaturized Dna Sequencer Volume (K) Forecast, by Application 2019 & 2032
- Table 31: Rest of South America Miniaturized Dna Sequencer Revenue (million) Forecast, by Application 2019 & 2032
- Table 32: Rest of South America Miniaturized Dna Sequencer Volume (K) Forecast, by Application 2019 & 2032
- Table 33: Global Miniaturized Dna Sequencer Revenue million Forecast, by Application 2019 & 2032
- Table 34: Global Miniaturized Dna Sequencer Volume K Forecast, by Application 2019 & 2032
- Table 35: Global Miniaturized Dna Sequencer Revenue million Forecast, by Type 2019 & 2032
- Table 36: Global Miniaturized Dna Sequencer Volume K Forecast, by Type 2019 & 2032
- Table 37: Global Miniaturized Dna Sequencer Revenue million Forecast, by Country 2019 & 2032
- Table 38: Global Miniaturized Dna Sequencer Volume K Forecast, by Country 2019 & 2032
- Table 39: United Kingdom Miniaturized Dna Sequencer Revenue (million) Forecast, by Application 2019 & 2032
- Table 40: United Kingdom Miniaturized Dna Sequencer Volume (K) Forecast, by Application 2019 & 2032
- Table 41: Germany Miniaturized Dna Sequencer Revenue (million) Forecast, by Application 2019 & 2032
- Table 42: Germany Miniaturized Dna Sequencer Volume (K) Forecast, by Application 2019 & 2032
- Table 43: France Miniaturized Dna Sequencer Revenue (million) Forecast, by Application 2019 & 2032
- Table 44: France Miniaturized Dna Sequencer Volume (K) Forecast, by Application 2019 & 2032
- Table 45: Italy Miniaturized Dna Sequencer Revenue (million) Forecast, by Application 2019 & 2032
- Table 46: Italy Miniaturized Dna Sequencer Volume (K) Forecast, by Application 2019 & 2032
- Table 47: Spain Miniaturized Dna Sequencer Revenue (million) Forecast, by Application 2019 & 2032
- Table 48: Spain Miniaturized Dna Sequencer Volume (K) Forecast, by Application 2019 & 2032
- Table 49: Russia Miniaturized Dna Sequencer Revenue (million) Forecast, by Application 2019 & 2032
- Table 50: Russia Miniaturized Dna Sequencer Volume (K) Forecast, by Application 2019 & 2032
- Table 51: Benelux Miniaturized Dna Sequencer Revenue (million) Forecast, by Application 2019 & 2032
- Table 52: Benelux Miniaturized Dna Sequencer Volume (K) Forecast, by Application 2019 & 2032
- Table 53: Nordics Miniaturized Dna Sequencer Revenue (million) Forecast, by Application 2019 & 2032
- Table 54: Nordics Miniaturized Dna Sequencer Volume (K) Forecast, by Application 2019 & 2032
- Table 55: Rest of Europe Miniaturized Dna Sequencer Revenue (million) Forecast, by Application 2019 & 2032
- Table 56: Rest of Europe Miniaturized Dna Sequencer Volume (K) Forecast, by Application 2019 & 2032
- Table 57: Global Miniaturized Dna Sequencer Revenue million Forecast, by Application 2019 & 2032
- Table 58: Global Miniaturized Dna Sequencer Volume K Forecast, by Application 2019 & 2032
- Table 59: Global Miniaturized Dna Sequencer Revenue million Forecast, by Type 2019 & 2032
- Table 60: Global Miniaturized Dna Sequencer Volume K Forecast, by Type 2019 & 2032
- Table 61: Global Miniaturized Dna Sequencer Revenue million Forecast, by Country 2019 & 2032
- Table 62: Global Miniaturized Dna Sequencer Volume K Forecast, by Country 2019 & 2032
- Table 63: Turkey Miniaturized Dna Sequencer Revenue (million) Forecast, by Application 2019 & 2032
- Table 64: Turkey Miniaturized Dna Sequencer Volume (K) Forecast, by Application 2019 & 2032
- Table 65: Israel Miniaturized Dna Sequencer Revenue (million) Forecast, by Application 2019 & 2032
- Table 66: Israel Miniaturized Dna Sequencer Volume (K) Forecast, by Application 2019 & 2032
- Table 67: GCC Miniaturized Dna Sequencer Revenue (million) Forecast, by Application 2019 & 2032
- Table 68: GCC Miniaturized Dna Sequencer Volume (K) Forecast, by Application 2019 & 2032
- Table 69: North Africa Miniaturized Dna Sequencer Revenue (million) Forecast, by Application 2019 & 2032
- Table 70: North Africa Miniaturized Dna Sequencer Volume (K) Forecast, by Application 2019 & 2032
- Table 71: South Africa Miniaturized Dna Sequencer Revenue (million) Forecast, by Application 2019 & 2032
- Table 72: South Africa Miniaturized Dna Sequencer Volume (K) Forecast, by Application 2019 & 2032
- Table 73: Rest of Middle East & Africa Miniaturized Dna Sequencer Revenue (million) Forecast, by Application 2019 & 2032
- Table 74: Rest of Middle East & Africa Miniaturized Dna Sequencer Volume (K) Forecast, by Application 2019 & 2032
- Table 75: Global Miniaturized Dna Sequencer Revenue million Forecast, by Application 2019 & 2032
- Table 76: Global Miniaturized Dna Sequencer Volume K Forecast, by Application 2019 & 2032
- Table 77: Global Miniaturized Dna Sequencer Revenue million Forecast, by Type 2019 & 2032
- Table 78: Global Miniaturized Dna Sequencer Volume K Forecast, by Type 2019 & 2032
- Table 79: Global Miniaturized Dna Sequencer Revenue million Forecast, by Country 2019 & 2032
- Table 80: Global Miniaturized Dna Sequencer Volume K Forecast, by Country 2019 & 2032
- Table 81: China Miniaturized Dna Sequencer Revenue (million) Forecast, by Application 2019 & 2032
- Table 82: China Miniaturized Dna Sequencer Volume (K) Forecast, by Application 2019 & 2032
- Table 83: India Miniaturized Dna Sequencer Revenue (million) Forecast, by Application 2019 & 2032
- Table 84: India Miniaturized Dna Sequencer Volume (K) Forecast, by Application 2019 & 2032
- Table 85: Japan Miniaturized Dna Sequencer Revenue (million) Forecast, by Application 2019 & 2032
- Table 86: Japan Miniaturized Dna Sequencer Volume (K) Forecast, by Application 2019 & 2032
- Table 87: South Korea Miniaturized Dna Sequencer Revenue (million) Forecast, by Application 2019 & 2032
- Table 88: South Korea Miniaturized Dna Sequencer Volume (K) Forecast, by Application 2019 & 2032
- Table 89: ASEAN Miniaturized Dna Sequencer Revenue (million) Forecast, by Application 2019 & 2032
- Table 90: ASEAN Miniaturized Dna Sequencer Volume (K) Forecast, by Application 2019 & 2032
- Table 91: Oceania Miniaturized Dna Sequencer Revenue (million) Forecast, by Application 2019 & 2032
- Table 92: Oceania Miniaturized Dna Sequencer Volume (K) Forecast, by Application 2019 & 2032
- Table 93: Rest of Asia Pacific Miniaturized Dna Sequencer Revenue (million) Forecast, by Application 2019 & 2032
- Table 94: Rest of Asia Pacific Miniaturized Dna Sequencer Volume (K) Forecast, by Application 2019 & 2032
Frequently Asked Questions
1. What is the projected Compound Annual Growth Rate (CAGR) of the Miniaturized Dna Sequencer?
The projected CAGR is approximately XXX%.
2. Which companies are prominent players in the Miniaturized Dna Sequencer?
Key companies in the market include Qitan Technology, Illumina, MGI Tech, Oxford Nanopore Technologies, Pacific Biosciences of California.
3. What are the main segments of the Miniaturized Dna Sequencer?
The market segments include Application, Type.
4. Can you provide details about the market size?
The market size is estimated to be USD XXX million as of 2022.
5. What are some drivers contributing to market growth?
N/A
6. What are the notable trends driving market growth?
N/A
7. Are there any restraints impacting market growth?
N/A
8. Can you provide examples of recent developments in the market?
N/A
9. What pricing options are available for accessing the report?
Pricing options include single-user, multi-user, and enterprise licenses priced at USD 3950.00, USD 5925.00, and USD 7900.00 respectively.
10. Is the market size provided in terms of value or volume?
The market size is provided in terms of value, measured in million and volume, measured in K.
11. Are there any specific market keywords associated with the report?
Yes, the market keyword associated with the report is "Miniaturized Dna Sequencer," which aids in identifying and referencing the specific market segment covered.
12. How do I determine which pricing option suits my needs best?
The pricing options vary based on user requirements and access needs. Individual users may opt for single-user licenses, while businesses requiring broader access may choose multi-user or enterprise licenses for cost-effective access to the report.
13. Are there any additional resources or data provided in the Miniaturized Dna Sequencer report?
While the report offers comprehensive insights, it's advisable to review the specific contents or supplementary materials provided to ascertain if additional resources or data are available.
14. How can I stay updated on further developments or reports in the Miniaturized Dna Sequencer?
To stay informed about further developments, trends, and reports in the Miniaturized Dna Sequencer, consider subscribing to industry newsletters, following relevant companies and organizations, or regularly checking reputable industry news sources and publications.
Methodology
Step 1 - Identification of Relevant Samples Size from Population Database


Step 2 - Approaches for Defining Global Market Size (Value, Volume* & Price*)

Note*: In applicable scenarios
Step 3 - Data Sources
Primary Research
- Web Analytics
- Survey Reports
- Research Institute
- Latest Research Reports
- Opinion Leaders
Secondary Research
- Annual Reports
- White Paper
- Latest Press Release
- Industry Association
- Paid Database
- Investor Presentations

Step 4 - Data Triangulation
Involves using different sources of information in order to increase the validity of a study
These sources are likely to be stakeholders in a program - participants, other researchers, program staff, other community members, and so on.
Then we put all data in single framework & apply various statistical tools to find out the dynamic on the market.
During the analysis stage, feedback from the stakeholder groups would be compared to determine areas of agreement as well as areas of divergence
