

Key Insights
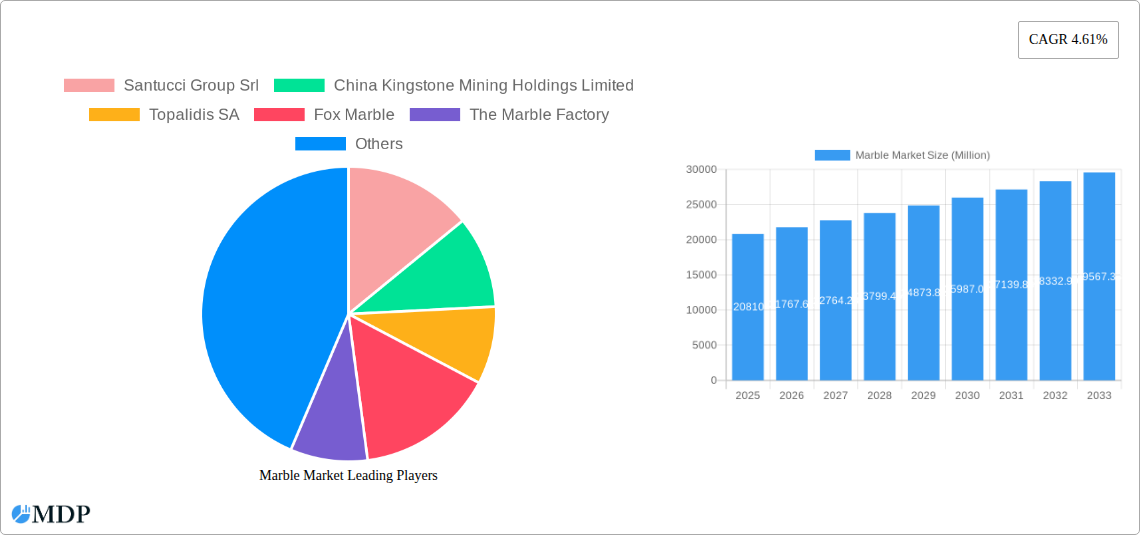
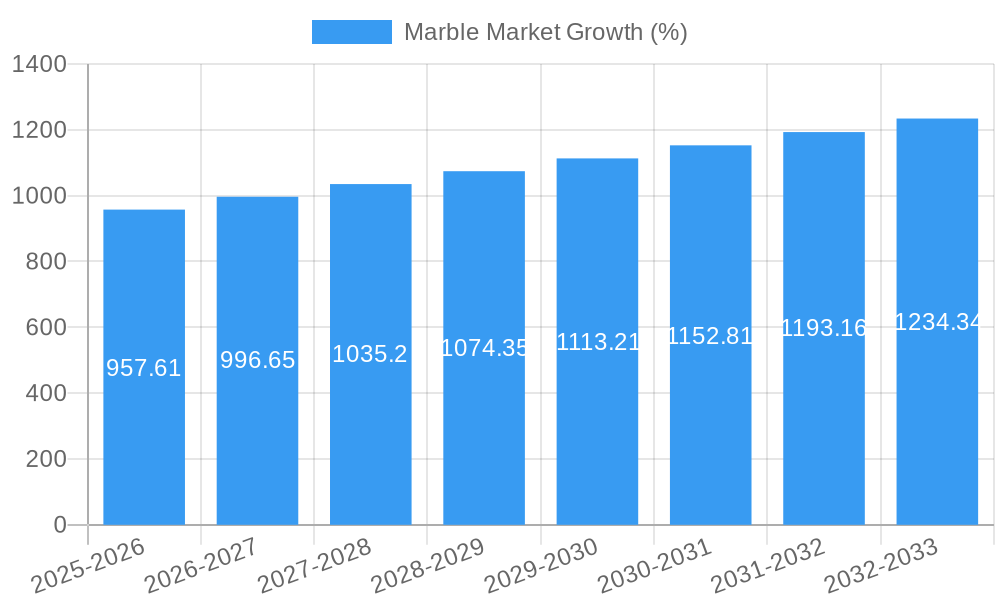
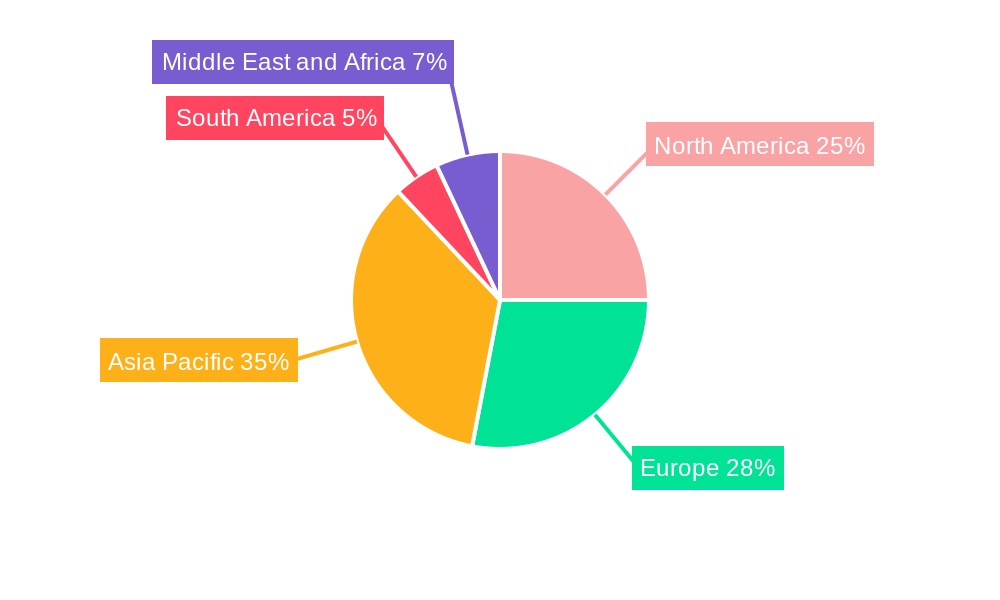
The global marble market, valued at $20.81 billion in 2025, is projected to experience steady growth, driven by a Compound Annual Growth Rate (CAGR) of 4.61% from 2025 to 2033. This growth is fueled by several key factors. The increasing popularity of marble in construction and decoration projects, particularly in residential and commercial buildings, is a significant driver. Its aesthetic appeal, durability, and timeless elegance continue to make it a preferred material among architects and designers. Furthermore, the expanding use of marble in statues, monuments, and high-end furniture contributes to market expansion. Growth is also influenced by rising disposable incomes in developing economies, leading to increased spending on home improvement and luxury goods. However, the market faces some restraints, primarily the high cost of extraction, processing, and transportation of marble, which can limit accessibility in certain regions. Furthermore, environmental concerns related to marble mining and its potential impact on ecosystems pose a challenge to sustainable market growth. The market is segmented by color (white, black, yellow, red, and others) and application (building & decoration, statues & monuments, furniture, and others). The Asia-Pacific region, particularly China and India, is expected to dominate the market due to robust construction activity and growing demand for luxury building materials. North America and Europe also represent significant market segments, with continued demand from established construction sectors.
The competitive landscape is characterized by a mix of large multinational corporations and smaller regional players. Key players are leveraging strategic initiatives such as mergers and acquisitions, expanding product portfolios, and focusing on sustainable mining practices to gain a competitive edge. The forecast period (2025-2033) anticipates continued market growth, albeit at a potentially moderated pace given the aforementioned constraints. Innovation in marble processing techniques, along with the development of more environmentally friendly extraction methods, will be crucial for future growth and sustainability within the industry. The focus on customized marble products tailored to specific design needs is expected to drive premium pricing and further market segmentation. The overall outlook remains positive, with the marble market poised for consistent expansion driven by the enduring appeal of this classic material.
Marble Market: A Comprehensive Report (2019-2033)
This in-depth report provides a comprehensive analysis of the global marble market, offering invaluable insights for industry stakeholders, investors, and strategic decision-makers. With a study period spanning 2019-2033, a base year of 2025, and a forecast period of 2025-2033, this report meticulously examines market dynamics, trends, leading players, and future opportunities within the multi-billion dollar marble industry. The report leverages extensive data analysis to predict a market valued at $XX Million by 2033, offering crucial information on market segmentation by color (white, black, yellow, red, other colors) and application (building and decoration, statues and monuments, furniture, other applications).
Marble Market Dynamics & Concentration
The global marble market exhibits a moderately concentrated landscape, with a handful of major players holding significant market share. Market concentration is influenced by factors such as economies of scale in extraction and processing, established distribution networks, and brand recognition. The market share of the top 5 players is estimated at xx%, while the remaining share is distributed across numerous smaller regional and national players. Innovation in processing techniques, such as water-jet cutting and polishing, is driving market growth, while regulatory frameworks related to mining and environmental protection significantly influence operational costs and market access. Product substitutes, like engineered stone and ceramic tiles, pose a competitive challenge, impacting market penetration. M&A activity within the industry, while not excessively high, reflects strategic consolidation efforts to expand market reach and secure raw material sources. Over the historical period (2019-2024), an estimated xx M&A deals occurred, contributing to market consolidation. End-user trends, including a growing preference for sustainable building materials and increasing demand for aesthetically pleasing interior design elements, are shaping market demand.
- Market Concentration: Top 5 players hold xx% market share.
- Innovation Drivers: Advanced processing technologies, sustainable sourcing initiatives.
- Regulatory Frameworks: Environmental regulations, mining permits.
- Product Substitutes: Engineered stone, ceramic tiles.
- End-User Trends: Growing demand for sustainable and aesthetically appealing materials.
- M&A Activity: Approximately xx deals during 2019-2024.
Marble Market Industry Trends & Analysis
The global marble market is projected to experience a Compound Annual Growth Rate (CAGR) of xx% during the forecast period (2025-2033). This growth is driven by several key factors: Rising disposable incomes in developing economies are fueling demand for premium building materials, the booming construction and infrastructure development sectors in regions like Asia and the Middle East present significant growth opportunities, and the increasing popularity of marble in residential and commercial applications contributes to market expansion. However, technological disruptions, such as the emergence of alternative materials with improved durability and cost-effectiveness, pose a challenge. Consumer preferences are shifting towards sustainable and ethically sourced marble, creating a demand for transparency and traceability in the supply chain. Competitive dynamics are intensifying as new players enter the market and established players invest in capacity expansion and product diversification. Market penetration of marble in niche applications, such as high-end furniture and artistic sculptures, is steadily increasing, further driving market growth. The estimated market penetration in the building and decoration sector is xx%.
Leading Markets & Segments in Marble Market
The leading market for marble is currently Asia-Pacific, driven by strong economic growth and rapid urbanization in countries like China and India. Within the color segment, white marble maintains the largest market share, owing to its versatility and widespread use in various applications. The building and decoration sector accounts for the largest portion of marble consumption, followed by the monuments and statues segment.
- Key Drivers in Asia-Pacific: Rapid urbanization, robust infrastructure development, strong economic growth.
- White Marble Dominance: High versatility, aesthetic appeal, widespread application in building & decoration.
- Building & Decoration Segment Leadership: Large-scale construction projects, increasing demand for premium materials in residential and commercial sectors.
Marble Market Product Developments
Recent product innovations in the marble industry focus on enhancing durability, improving processing efficiency, and expanding applications. This includes the development of new surface treatments for enhanced stain resistance and scratch resistance, and advanced techniques for creating intricate patterns and designs. The focus is on creating unique and customized marble products to meet varied aesthetic preferences and application requirements. Technological advancements such as CNC machining and digital printing are enhancing the ability to create intricate designs and sizes, increasing the range of application possibilities.
Key Drivers of Marble Market Growth
Several factors propel the marble market's growth: increasing global construction activities, particularly in emerging economies, growing consumer preference for natural stone in architectural and interior design, and ongoing technological advancements enhancing processing efficiency and product quality. Government policies promoting sustainable building practices further contribute to the growth of the market.
Challenges in the Marble Market
The marble market faces challenges such as high initial investment costs for extraction and processing, fluctuating raw material prices impacted by global supply chain disruptions, and increasing environmental regulations that can impact operations. Competition from substitute materials, particularly engineered stone, also presents a significant challenge.
Emerging Opportunities in Marble Market
Significant opportunities exist in expanding into new markets, particularly in developing economies with burgeoning construction sectors. The incorporation of cutting-edge technologies in marble processing, such as 3D printing and AI-driven design tools, and strategic partnerships to improve supply chain sustainability can unlock significant growth potential.
Leading Players in the Marble Market Sector
- Santucci Group Srl
- China Kingstone Mining Holdings Limited
- Topalidis SA
- Fox Marble
- The Marble Factory
- Levantina y Asociados de Minerales S A
- Şimşekler Mermer
- Dimpomar
- BC Marble Products Ltd
- Temmer Marble
- FHL I Kiriakidis Marbles and Granites SA
- Universal Marble & Granite Group Ltd
- Tekmar
- Daltile
- Antolini Luigi & C SpA
- Kangli stone group
- Xishi Group Ltd
- Hilltop Granite
- HELLENIC GRANITE Co
- Indiana Limestone Company (A Polycor Inc Company)
- Mumal Marble
- Best Cheer Stone
Key Milestones in Marble Market Industry
- November 2021: Fox Marble signed a joint venture agreement with the Al Bab Al Mumtaz Group in the UAE, expanding its market reach in the Middle East.
Strategic Outlook for Marble Market
The future of the marble market looks promising, driven by sustained growth in the construction sector, increasing adoption of marble in various applications, and continuous innovation in processing and design. Strategic partnerships, investments in sustainable practices, and expansion into new markets will be crucial for players seeking to capitalize on future growth opportunities.
Marble Market Segmentation
-
1. Color
- 1.1. White
- 1.2. Black
- 1.3. Yellow
- 1.4. Red
- 1.5. Other Colors
-
2. Application
- 2.1. Building and Decoration
- 2.2. Statues and Monuments
- 2.3. Furniture
- 2.4. Other Applications
Marble Market Segmentation By Geography
-
1. Asia Pacific
- 1.1. China
- 1.2. India
- 1.3. Japan
- 1.4. South Korea
- 1.5. Rest of Asia Pacific
-
2. North America
- 2.1. United States
- 2.2. Canada
- 2.3. Mexico
-
3. Europe
- 3.1. Germany
- 3.2. United Kingdom
- 3.3. France
- 3.4. Italy
- 3.5. Turkey
- 3.6. Rest of Europe
-
4. South America
- 4.1. Brazil
- 4.2. Argentina
- 4.3. Rest of South America
-
5. Middle East and Africa
- 5.1. Saudi Arabia
- 5.2. South Africa
- 5.3. Rest of Middle East and Africa
Marble Market REPORT HIGHLIGHTS
| Aspects | Details |
|---|---|
| Study Period | 2019-2033 |
| Base Year | 2024 |
| Estimated Year | 2025 |
| Forecast Period | 2025-2033 |
| Historical Period | 2019-2024 |
| Growth Rate | CAGR of 4.61% from 2019-2033 |
| Segmentation |
|
Table of Contents
- 1. Introduction
- 1.1. Research Scope
- 1.2. Market Segmentation
- 1.3. Research Methodology
- 1.4. Definitions and Assumptions
- 2. Executive Summary
- 2.1. Introduction
- 3. Market Dynamics
- 3.1. Introduction
- 3.2. Market Drivers
- 3.2.1. Rapid Growth in the Construction Industry; Other Drivers
- 3.3. Market Restrains
- 3.3.1. Health Hazard Related to Marble Dust
- 3.4. Market Trends
- 3.4.1. Building and Decoration Segment to Dominate the Market
- 4. Market Factor Analysis
- 4.1. Porters Five Forces
- 4.2. Supply/Value Chain
- 4.3. PESTEL analysis
- 4.4. Market Entropy
- 4.5. Patent/Trademark Analysis
- 5. Global Marble Market Analysis, Insights and Forecast, 2019-2031
- 5.1. Market Analysis, Insights and Forecast - by Color
- 5.1.1. White
- 5.1.2. Black
- 5.1.3. Yellow
- 5.1.4. Red
- 5.1.5. Other Colors
- 5.2. Market Analysis, Insights and Forecast - by Application
- 5.2.1. Building and Decoration
- 5.2.2. Statues and Monuments
- 5.2.3. Furniture
- 5.2.4. Other Applications
- 5.3. Market Analysis, Insights and Forecast - by Region
- 5.3.1. Asia Pacific
- 5.3.2. North America
- 5.3.3. Europe
- 5.3.4. South America
- 5.3.5. Middle East and Africa
- 5.1. Market Analysis, Insights and Forecast - by Color
- 6. Asia Pacific Marble Market Analysis, Insights and Forecast, 2019-2031
- 6.1. Market Analysis, Insights and Forecast - by Color
- 6.1.1. White
- 6.1.2. Black
- 6.1.3. Yellow
- 6.1.4. Red
- 6.1.5. Other Colors
- 6.2. Market Analysis, Insights and Forecast - by Application
- 6.2.1. Building and Decoration
- 6.2.2. Statues and Monuments
- 6.2.3. Furniture
- 6.2.4. Other Applications
- 6.1. Market Analysis, Insights and Forecast - by Color
- 7. North America Marble Market Analysis, Insights and Forecast, 2019-2031
- 7.1. Market Analysis, Insights and Forecast - by Color
- 7.1.1. White
- 7.1.2. Black
- 7.1.3. Yellow
- 7.1.4. Red
- 7.1.5. Other Colors
- 7.2. Market Analysis, Insights and Forecast - by Application
- 7.2.1. Building and Decoration
- 7.2.2. Statues and Monuments
- 7.2.3. Furniture
- 7.2.4. Other Applications
- 7.1. Market Analysis, Insights and Forecast - by Color
- 8. Europe Marble Market Analysis, Insights and Forecast, 2019-2031
- 8.1. Market Analysis, Insights and Forecast - by Color
- 8.1.1. White
- 8.1.2. Black
- 8.1.3. Yellow
- 8.1.4. Red
- 8.1.5. Other Colors
- 8.2. Market Analysis, Insights and Forecast - by Application
- 8.2.1. Building and Decoration
- 8.2.2. Statues and Monuments
- 8.2.3. Furniture
- 8.2.4. Other Applications
- 8.1. Market Analysis, Insights and Forecast - by Color
- 9. South America Marble Market Analysis, Insights and Forecast, 2019-2031
- 9.1. Market Analysis, Insights and Forecast - by Color
- 9.1.1. White
- 9.1.2. Black
- 9.1.3. Yellow
- 9.1.4. Red
- 9.1.5. Other Colors
- 9.2. Market Analysis, Insights and Forecast - by Application
- 9.2.1. Building and Decoration
- 9.2.2. Statues and Monuments
- 9.2.3. Furniture
- 9.2.4. Other Applications
- 9.1. Market Analysis, Insights and Forecast - by Color
- 10. Middle East and Africa Marble Market Analysis, Insights and Forecast, 2019-2031
- 10.1. Market Analysis, Insights and Forecast - by Color
- 10.1.1. White
- 10.1.2. Black
- 10.1.3. Yellow
- 10.1.4. Red
- 10.1.5. Other Colors
- 10.2. Market Analysis, Insights and Forecast - by Application
- 10.2.1. Building and Decoration
- 10.2.2. Statues and Monuments
- 10.2.3. Furniture
- 10.2.4. Other Applications
- 10.1. Market Analysis, Insights and Forecast - by Color
- 11. Asia Pacific Marble Market Analysis, Insights and Forecast, 2019-2031
- 11.1. Market Analysis, Insights and Forecast - By Country/Sub-region
- 11.1.1 China
- 11.1.2 India
- 11.1.3 Japan
- 11.1.4 South Korea
- 11.1.5 Rest of Asia Pacific
- 12. North America Marble Market Analysis, Insights and Forecast, 2019-2031
- 12.1. Market Analysis, Insights and Forecast - By Country/Sub-region
- 12.1.1 United States
- 12.1.2 Canada
- 12.1.3 Mexico
- 13. Europe Marble Market Analysis, Insights and Forecast, 2019-2031
- 13.1. Market Analysis, Insights and Forecast - By Country/Sub-region
- 13.1.1 Germany
- 13.1.2 United Kingdom
- 13.1.3 France
- 13.1.4 Italy
- 13.1.5 Turkey
- 13.1.6 Rest of Europe
- 14. South America Marble Market Analysis, Insights and Forecast, 2019-2031
- 14.1. Market Analysis, Insights and Forecast - By Country/Sub-region
- 14.1.1 Brazil
- 14.1.2 Argentina
- 14.1.3 Rest of South America
- 15. Middle East and Africa Marble Market Analysis, Insights and Forecast, 2019-2031
- 15.1. Market Analysis, Insights and Forecast - By Country/Sub-region
- 15.1.1 Saudi Arabia
- 15.1.2 South Africa
- 15.1.3 Rest of Middle East and Africa
- 16. Competitive Analysis
- 16.1. Global Market Share Analysis 2024
- 16.2. Company Profiles
- 16.2.1 Santucci Group Srl
- 16.2.1.1. Overview
- 16.2.1.2. Products
- 16.2.1.3. SWOT Analysis
- 16.2.1.4. Recent Developments
- 16.2.1.5. Financials (Based on Availability)
- 16.2.2 China Kingstone Mining Holdings Limited
- 16.2.2.1. Overview
- 16.2.2.2. Products
- 16.2.2.3. SWOT Analysis
- 16.2.2.4. Recent Developments
- 16.2.2.5. Financials (Based on Availability)
- 16.2.3 Topalidis SA
- 16.2.3.1. Overview
- 16.2.3.2. Products
- 16.2.3.3. SWOT Analysis
- 16.2.3.4. Recent Developments
- 16.2.3.5. Financials (Based on Availability)
- 16.2.4 Fox Marble
- 16.2.4.1. Overview
- 16.2.4.2. Products
- 16.2.4.3. SWOT Analysis
- 16.2.4.4. Recent Developments
- 16.2.4.5. Financials (Based on Availability)
- 16.2.5 The Marble Factory
- 16.2.5.1. Overview
- 16.2.5.2. Products
- 16.2.5.3. SWOT Analysis
- 16.2.5.4. Recent Developments
- 16.2.5.5. Financials (Based on Availability)
- 16.2.6 Levantina y Asociados de Minerales S A
- 16.2.6.1. Overview
- 16.2.6.2. Products
- 16.2.6.3. SWOT Analysis
- 16.2.6.4. Recent Developments
- 16.2.6.5. Financials (Based on Availability)
- 16.2.7 Şimşekler Mermer
- 16.2.7.1. Overview
- 16.2.7.2. Products
- 16.2.7.3. SWOT Analysis
- 16.2.7.4. Recent Developments
- 16.2.7.5. Financials (Based on Availability)
- 16.2.8 Dimpomar
- 16.2.8.1. Overview
- 16.2.8.2. Products
- 16.2.8.3. SWOT Analysis
- 16.2.8.4. Recent Developments
- 16.2.8.5. Financials (Based on Availability)
- 16.2.9 BC Marble Products Ltd
- 16.2.9.1. Overview
- 16.2.9.2. Products
- 16.2.9.3. SWOT Analysis
- 16.2.9.4. Recent Developments
- 16.2.9.5. Financials (Based on Availability)
- 16.2.10 Temmer Marble
- 16.2.10.1. Overview
- 16.2.10.2. Products
- 16.2.10.3. SWOT Analysis
- 16.2.10.4. Recent Developments
- 16.2.10.5. Financials (Based on Availability)
- 16.2.11 FHL I Kiriakidis Marbles and Granites SA
- 16.2.11.1. Overview
- 16.2.11.2. Products
- 16.2.11.3. SWOT Analysis
- 16.2.11.4. Recent Developments
- 16.2.11.5. Financials (Based on Availability)
- 16.2.12 Universal Marble & Granite Group Ltd
- 16.2.12.1. Overview
- 16.2.12.2. Products
- 16.2.12.3. SWOT Analysis
- 16.2.12.4. Recent Developments
- 16.2.12.5. Financials (Based on Availability)
- 16.2.13 Tekmar
- 16.2.13.1. Overview
- 16.2.13.2. Products
- 16.2.13.3. SWOT Analysis
- 16.2.13.4. Recent Developments
- 16.2.13.5. Financials (Based on Availability)
- 16.2.14 Daltile
- 16.2.14.1. Overview
- 16.2.14.2. Products
- 16.2.14.3. SWOT Analysis
- 16.2.14.4. Recent Developments
- 16.2.14.5. Financials (Based on Availability)
- 16.2.15 Antolini Luigi & C SpA
- 16.2.15.1. Overview
- 16.2.15.2. Products
- 16.2.15.3. SWOT Analysis
- 16.2.15.4. Recent Developments
- 16.2.15.5. Financials (Based on Availability)
- 16.2.16 Kangli stone group
- 16.2.16.1. Overview
- 16.2.16.2. Products
- 16.2.16.3. SWOT Analysis
- 16.2.16.4. Recent Developments
- 16.2.16.5. Financials (Based on Availability)
- 16.2.17 Xishi Group Ltd*List Not Exhaustive
- 16.2.17.1. Overview
- 16.2.17.2. Products
- 16.2.17.3. SWOT Analysis
- 16.2.17.4. Recent Developments
- 16.2.17.5. Financials (Based on Availability)
- 16.2.18 Hilltop Granite
- 16.2.18.1. Overview
- 16.2.18.2. Products
- 16.2.18.3. SWOT Analysis
- 16.2.18.4. Recent Developments
- 16.2.18.5. Financials (Based on Availability)
- 16.2.19 HELLENIC GRANITE Co
- 16.2.19.1. Overview
- 16.2.19.2. Products
- 16.2.19.3. SWOT Analysis
- 16.2.19.4. Recent Developments
- 16.2.19.5. Financials (Based on Availability)
- 16.2.20 Indiana Limestone Company (A Polycor Inc Company)
- 16.2.20.1. Overview
- 16.2.20.2. Products
- 16.2.20.3. SWOT Analysis
- 16.2.20.4. Recent Developments
- 16.2.20.5. Financials (Based on Availability)
- 16.2.21 Mumal Marble
- 16.2.21.1. Overview
- 16.2.21.2. Products
- 16.2.21.3. SWOT Analysis
- 16.2.21.4. Recent Developments
- 16.2.21.5. Financials (Based on Availability)
- 16.2.22 Best Cheer Stone
- 16.2.22.1. Overview
- 16.2.22.2. Products
- 16.2.22.3. SWOT Analysis
- 16.2.22.4. Recent Developments
- 16.2.22.5. Financials (Based on Availability)
- 16.2.1 Santucci Group Srl
List of Figures
- Figure 1: Global Marble Market Revenue Breakdown (Million, %) by Region 2024 & 2032
- Figure 2: Asia Pacific Marble Market Revenue (Million), by Country 2024 & 2032
- Figure 3: Asia Pacific Marble Market Revenue Share (%), by Country 2024 & 2032
- Figure 4: North America Marble Market Revenue (Million), by Country 2024 & 2032
- Figure 5: North America Marble Market Revenue Share (%), by Country 2024 & 2032
- Figure 6: Europe Marble Market Revenue (Million), by Country 2024 & 2032
- Figure 7: Europe Marble Market Revenue Share (%), by Country 2024 & 2032
- Figure 8: South America Marble Market Revenue (Million), by Country 2024 & 2032
- Figure 9: South America Marble Market Revenue Share (%), by Country 2024 & 2032
- Figure 10: Middle East and Africa Marble Market Revenue (Million), by Country 2024 & 2032
- Figure 11: Middle East and Africa Marble Market Revenue Share (%), by Country 2024 & 2032
- Figure 12: Asia Pacific Marble Market Revenue (Million), by Color 2024 & 2032
- Figure 13: Asia Pacific Marble Market Revenue Share (%), by Color 2024 & 2032
- Figure 14: Asia Pacific Marble Market Revenue (Million), by Application 2024 & 2032
- Figure 15: Asia Pacific Marble Market Revenue Share (%), by Application 2024 & 2032
- Figure 16: Asia Pacific Marble Market Revenue (Million), by Country 2024 & 2032
- Figure 17: Asia Pacific Marble Market Revenue Share (%), by Country 2024 & 2032
- Figure 18: North America Marble Market Revenue (Million), by Color 2024 & 2032
- Figure 19: North America Marble Market Revenue Share (%), by Color 2024 & 2032
- Figure 20: North America Marble Market Revenue (Million), by Application 2024 & 2032
- Figure 21: North America Marble Market Revenue Share (%), by Application 2024 & 2032
- Figure 22: North America Marble Market Revenue (Million), by Country 2024 & 2032
- Figure 23: North America Marble Market Revenue Share (%), by Country 2024 & 2032
- Figure 24: Europe Marble Market Revenue (Million), by Color 2024 & 2032
- Figure 25: Europe Marble Market Revenue Share (%), by Color 2024 & 2032
- Figure 26: Europe Marble Market Revenue (Million), by Application 2024 & 2032
- Figure 27: Europe Marble Market Revenue Share (%), by Application 2024 & 2032
- Figure 28: Europe Marble Market Revenue (Million), by Country 2024 & 2032
- Figure 29: Europe Marble Market Revenue Share (%), by Country 2024 & 2032
- Figure 30: South America Marble Market Revenue (Million), by Color 2024 & 2032
- Figure 31: South America Marble Market Revenue Share (%), by Color 2024 & 2032
- Figure 32: South America Marble Market Revenue (Million), by Application 2024 & 2032
- Figure 33: South America Marble Market Revenue Share (%), by Application 2024 & 2032
- Figure 34: South America Marble Market Revenue (Million), by Country 2024 & 2032
- Figure 35: South America Marble Market Revenue Share (%), by Country 2024 & 2032
- Figure 36: Middle East and Africa Marble Market Revenue (Million), by Color 2024 & 2032
- Figure 37: Middle East and Africa Marble Market Revenue Share (%), by Color 2024 & 2032
- Figure 38: Middle East and Africa Marble Market Revenue (Million), by Application 2024 & 2032
- Figure 39: Middle East and Africa Marble Market Revenue Share (%), by Application 2024 & 2032
- Figure 40: Middle East and Africa Marble Market Revenue (Million), by Country 2024 & 2032
- Figure 41: Middle East and Africa Marble Market Revenue Share (%), by Country 2024 & 2032
List of Tables
- Table 1: Global Marble Market Revenue Million Forecast, by Region 2019 & 2032
- Table 2: Global Marble Market Revenue Million Forecast, by Color 2019 & 2032
- Table 3: Global Marble Market Revenue Million Forecast, by Application 2019 & 2032
- Table 4: Global Marble Market Revenue Million Forecast, by Region 2019 & 2032
- Table 5: Global Marble Market Revenue Million Forecast, by Country 2019 & 2032
- Table 6: China Marble Market Revenue (Million) Forecast, by Application 2019 & 2032
- Table 7: India Marble Market Revenue (Million) Forecast, by Application 2019 & 2032
- Table 8: Japan Marble Market Revenue (Million) Forecast, by Application 2019 & 2032
- Table 9: South Korea Marble Market Revenue (Million) Forecast, by Application 2019 & 2032
- Table 10: Rest of Asia Pacific Marble Market Revenue (Million) Forecast, by Application 2019 & 2032
- Table 11: Global Marble Market Revenue Million Forecast, by Country 2019 & 2032
- Table 12: United States Marble Market Revenue (Million) Forecast, by Application 2019 & 2032
- Table 13: Canada Marble Market Revenue (Million) Forecast, by Application 2019 & 2032
- Table 14: Mexico Marble Market Revenue (Million) Forecast, by Application 2019 & 2032
- Table 15: Global Marble Market Revenue Million Forecast, by Country 2019 & 2032
- Table 16: Germany Marble Market Revenue (Million) Forecast, by Application 2019 & 2032
- Table 17: United Kingdom Marble Market Revenue (Million) Forecast, by Application 2019 & 2032
- Table 18: France Marble Market Revenue (Million) Forecast, by Application 2019 & 2032
- Table 19: Italy Marble Market Revenue (Million) Forecast, by Application 2019 & 2032
- Table 20: Turkey Marble Market Revenue (Million) Forecast, by Application 2019 & 2032
- Table 21: Rest of Europe Marble Market Revenue (Million) Forecast, by Application 2019 & 2032
- Table 22: Global Marble Market Revenue Million Forecast, by Country 2019 & 2032
- Table 23: Brazil Marble Market Revenue (Million) Forecast, by Application 2019 & 2032
- Table 24: Argentina Marble Market Revenue (Million) Forecast, by Application 2019 & 2032
- Table 25: Rest of South America Marble Market Revenue (Million) Forecast, by Application 2019 & 2032
- Table 26: Global Marble Market Revenue Million Forecast, by Country 2019 & 2032
- Table 27: Saudi Arabia Marble Market Revenue (Million) Forecast, by Application 2019 & 2032
- Table 28: South Africa Marble Market Revenue (Million) Forecast, by Application 2019 & 2032
- Table 29: Rest of Middle East and Africa Marble Market Revenue (Million) Forecast, by Application 2019 & 2032
- Table 30: Global Marble Market Revenue Million Forecast, by Color 2019 & 2032
- Table 31: Global Marble Market Revenue Million Forecast, by Application 2019 & 2032
- Table 32: Global Marble Market Revenue Million Forecast, by Country 2019 & 2032
- Table 33: China Marble Market Revenue (Million) Forecast, by Application 2019 & 2032
- Table 34: India Marble Market Revenue (Million) Forecast, by Application 2019 & 2032
- Table 35: Japan Marble Market Revenue (Million) Forecast, by Application 2019 & 2032
- Table 36: South Korea Marble Market Revenue (Million) Forecast, by Application 2019 & 2032
- Table 37: Rest of Asia Pacific Marble Market Revenue (Million) Forecast, by Application 2019 & 2032
- Table 38: Global Marble Market Revenue Million Forecast, by Color 2019 & 2032
- Table 39: Global Marble Market Revenue Million Forecast, by Application 2019 & 2032
- Table 40: Global Marble Market Revenue Million Forecast, by Country 2019 & 2032
- Table 41: United States Marble Market Revenue (Million) Forecast, by Application 2019 & 2032
- Table 42: Canada Marble Market Revenue (Million) Forecast, by Application 2019 & 2032
- Table 43: Mexico Marble Market Revenue (Million) Forecast, by Application 2019 & 2032
- Table 44: Global Marble Market Revenue Million Forecast, by Color 2019 & 2032
- Table 45: Global Marble Market Revenue Million Forecast, by Application 2019 & 2032
- Table 46: Global Marble Market Revenue Million Forecast, by Country 2019 & 2032
- Table 47: Germany Marble Market Revenue (Million) Forecast, by Application 2019 & 2032
- Table 48: United Kingdom Marble Market Revenue (Million) Forecast, by Application 2019 & 2032
- Table 49: France Marble Market Revenue (Million) Forecast, by Application 2019 & 2032
- Table 50: Italy Marble Market Revenue (Million) Forecast, by Application 2019 & 2032
- Table 51: Turkey Marble Market Revenue (Million) Forecast, by Application 2019 & 2032
- Table 52: Rest of Europe Marble Market Revenue (Million) Forecast, by Application 2019 & 2032
- Table 53: Global Marble Market Revenue Million Forecast, by Color 2019 & 2032
- Table 54: Global Marble Market Revenue Million Forecast, by Application 2019 & 2032
- Table 55: Global Marble Market Revenue Million Forecast, by Country 2019 & 2032
- Table 56: Brazil Marble Market Revenue (Million) Forecast, by Application 2019 & 2032
- Table 57: Argentina Marble Market Revenue (Million) Forecast, by Application 2019 & 2032
- Table 58: Rest of South America Marble Market Revenue (Million) Forecast, by Application 2019 & 2032
- Table 59: Global Marble Market Revenue Million Forecast, by Color 2019 & 2032
- Table 60: Global Marble Market Revenue Million Forecast, by Application 2019 & 2032
- Table 61: Global Marble Market Revenue Million Forecast, by Country 2019 & 2032
- Table 62: Saudi Arabia Marble Market Revenue (Million) Forecast, by Application 2019 & 2032
- Table 63: South Africa Marble Market Revenue (Million) Forecast, by Application 2019 & 2032
- Table 64: Rest of Middle East and Africa Marble Market Revenue (Million) Forecast, by Application 2019 & 2032
Frequently Asked Questions
1. What is the projected Compound Annual Growth Rate (CAGR) of the Marble Market?
The projected CAGR is approximately 4.61%.
2. Which companies are prominent players in the Marble Market?
Key companies in the market include Santucci Group Srl, China Kingstone Mining Holdings Limited, Topalidis SA, Fox Marble, The Marble Factory, Levantina y Asociados de Minerales S A, Şimşekler Mermer, Dimpomar, BC Marble Products Ltd, Temmer Marble, FHL I Kiriakidis Marbles and Granites SA, Universal Marble & Granite Group Ltd, Tekmar, Daltile, Antolini Luigi & C SpA, Kangli stone group, Xishi Group Ltd*List Not Exhaustive, Hilltop Granite, HELLENIC GRANITE Co, Indiana Limestone Company (A Polycor Inc Company), Mumal Marble, Best Cheer Stone.
3. What are the main segments of the Marble Market?
The market segments include Color, Application.
4. Can you provide details about the market size?
The market size is estimated to be USD 20.81 Million as of 2022.
5. What are some drivers contributing to market growth?
Rapid Growth in the Construction Industry; Other Drivers.
6. What are the notable trends driving market growth?
Building and Decoration Segment to Dominate the Market.
7. Are there any restraints impacting market growth?
Health Hazard Related to Marble Dust.
8. Can you provide examples of recent developments in the market?
In November 2021, Fox Marble signed a joint venture agreement with the Al Bab Al Mumtaz Group in the United Arab Emirates. Under this agreement, Fox Marble will supply marble tiles and slabs processed in its factory in Kosovo to Al Bab Al Mumtaz Group for sale via its range of outlets in the region.
9. What pricing options are available for accessing the report?
Pricing options include single-user, multi-user, and enterprise licenses priced at USD 4750, USD 5250, and USD 8750 respectively.
10. Is the market size provided in terms of value or volume?
The market size is provided in terms of value, measured in Million.
11. Are there any specific market keywords associated with the report?
Yes, the market keyword associated with the report is "Marble Market," which aids in identifying and referencing the specific market segment covered.
12. How do I determine which pricing option suits my needs best?
The pricing options vary based on user requirements and access needs. Individual users may opt for single-user licenses, while businesses requiring broader access may choose multi-user or enterprise licenses for cost-effective access to the report.
13. Are there any additional resources or data provided in the Marble Market report?
While the report offers comprehensive insights, it's advisable to review the specific contents or supplementary materials provided to ascertain if additional resources or data are available.
14. How can I stay updated on further developments or reports in the Marble Market?
To stay informed about further developments, trends, and reports in the Marble Market, consider subscribing to industry newsletters, following relevant companies and organizations, or regularly checking reputable industry news sources and publications.
Methodology
Step 1 - Identification of Relevant Samples Size from Population Database


Step 2 - Approaches for Defining Global Market Size (Value, Volume* & Price*)

Note*: In applicable scenarios
Step 3 - Data Sources
Primary Research
- Web Analytics
- Survey Reports
- Research Institute
- Latest Research Reports
- Opinion Leaders
Secondary Research
- Annual Reports
- White Paper
- Latest Press Release
- Industry Association
- Paid Database
- Investor Presentations

Step 4 - Data Triangulation
Involves using different sources of information in order to increase the validity of a study
These sources are likely to be stakeholders in a program - participants, other researchers, program staff, other community members, and so on.
Then we put all data in single framework & apply various statistical tools to find out the dynamic on the market.
During the analysis stage, feedback from the stakeholder groups would be compared to determine areas of agreement as well as areas of divergence
