

Key Insights
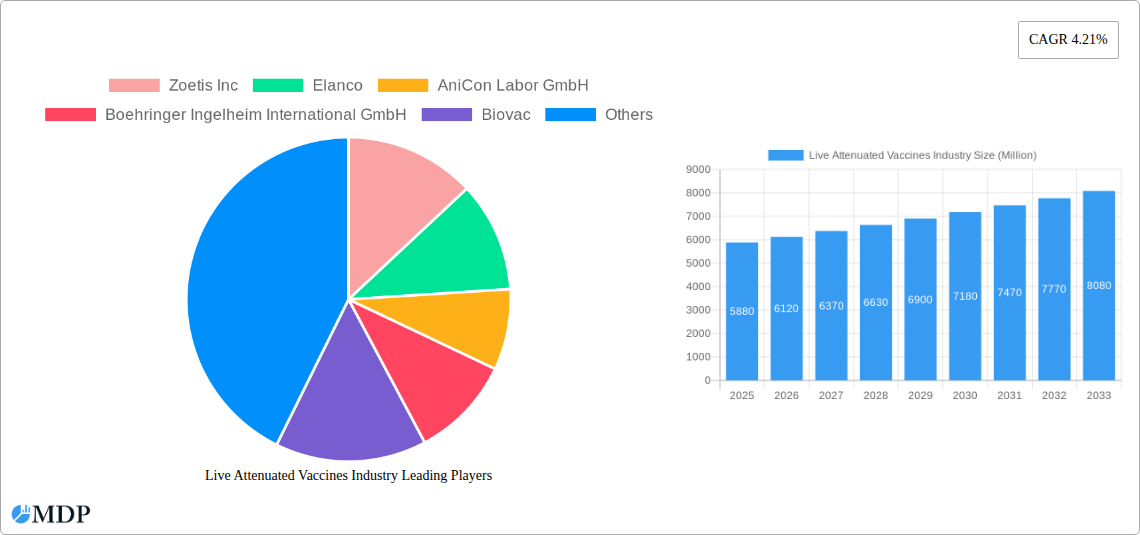
The global live attenuated vaccines market, a significant segment within the broader animal vaccines industry, is experiencing robust growth, driven by increasing demand for disease prevention in livestock and poultry. The market, valued at approximately $5.88 billion in 2025, is projected to exhibit a Compound Annual Growth Rate (CAGR) of 4.21% from 2025 to 2033. This growth is fueled by several key factors. Firstly, rising global meat consumption and intensifying livestock farming practices necessitate effective disease control measures. Secondly, advancements in vaccine technology, such as the development of more efficacious and safer live attenuated vaccines, are contributing to market expansion. Furthermore, increasing government initiatives promoting animal health and welfare in various regions are creating favorable regulatory environments. Finally, the growing awareness among farmers regarding the economic benefits of disease prevention through vaccination further strengthens market demand.
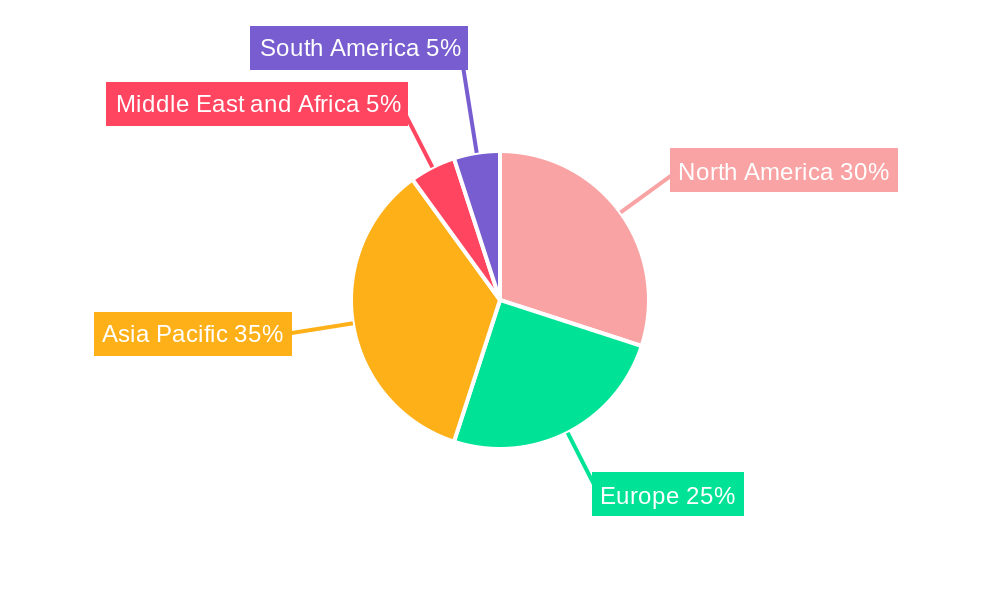
While the market demonstrates significant potential, certain restraints need to be considered. These include the potential for adverse reactions in certain animal populations, the fluctuating prices of raw materials used in vaccine production, and the complexities involved in vaccine distribution and cold-chain management, particularly in developing countries. Nevertheless, ongoing research and development focused on improving vaccine efficacy, safety, and ease of administration is expected to mitigate these challenges. The market is segmented by product type (bovine, poultry, porcine, and other livestock vaccines) and technology (live attenuated, inactivated, toxoid, and recombinant vaccines), offering opportunities for targeted market penetration by companies like Zoetis Inc., Elanco, Boehringer Ingelheim, and others. Regional variations in market growth are anticipated, with regions like Asia-Pacific expected to show robust expansion due to the high concentration of livestock and poultry farming.
Live Attenuated Vaccines Industry: Market Report 2019-2033
This comprehensive report provides a detailed analysis of the Live Attenuated Vaccines Industry, covering market dynamics, leading players, technological advancements, and future growth prospects. The report covers the period 2019-2033, with a focus on the forecast period 2025-2033, and utilizes data from 2019-2024 as the historical period. The base year for this analysis is 2025. The global market is estimated to reach xx Million by 2033. This report is invaluable for industry stakeholders, investors, and researchers seeking a deep understanding of this critical sector.
Live Attenuated Vaccines Industry Market Dynamics & Concentration
The Live Attenuated Vaccines market, valued at xx Million in 2025, exhibits a moderately concentrated landscape with several key players dominating market share. Innovation, particularly in developing more effective and safer vaccines, is a crucial driver of growth. Stringent regulatory frameworks, including those set by governmental agencies and international organizations, significantly impact market dynamics. The market also faces pressure from substitute technologies, such as inactivated or recombinant vaccines. End-user trends, particularly in emerging economies, influence demand. The market has witnessed considerable M&A activity in recent years, aiming to consolidate market share and enhance technological capabilities.
- Market Concentration: Top 5 players hold approximately xx% market share in 2025.
- M&A Activity: An estimated xx M&A deals occurred between 2019-2024.
- Innovation Drivers: Focus on developing multivalent vaccines and thermostable vaccines.
- Regulatory Frameworks: Stringent approval processes for new vaccines in various regions.
- Product Substitutes: Competition from other vaccine technologies (inactivated, recombinant).
- End-User Trends: Increasing demand driven by rising livestock populations and disease outbreaks.
Live Attenuated Vaccines Industry Industry Trends & Analysis
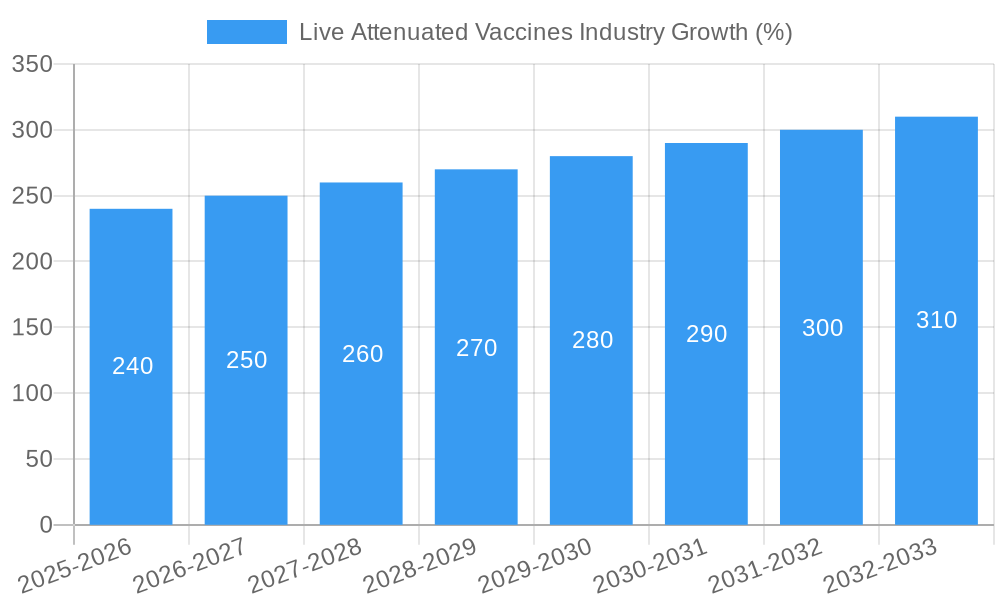
The Live Attenuated Vaccines industry is experiencing robust growth, driven by factors such as the rising global livestock population, increasing prevalence of animal diseases, and rising government initiatives promoting animal health. The market is projected to witness a CAGR of xx% during the forecast period (2025-2033). Technological advancements, such as the development of thermostable vaccines, are enhancing market penetration and expanding access to vaccination programs in regions with limited cold chain infrastructure. Consumer preferences are shifting towards safer and more effective vaccines with improved efficacy and fewer side effects. The competitive landscape is characterized by intense competition among major players focusing on product innovation, geographical expansion, and strategic partnerships.
Leading Markets & Segments in Live Attenuated Vaccines Industry
The poultry vaccine segment is currently the dominant product type, accounting for approximately xx% of the market in 2025. Geographically, Asia-Pacific is anticipated to be the leading region due to the rapidly growing livestock population and increasing awareness of animal health.
- Leading Product Type: Poultry vaccines demonstrate the highest market share driven by high poultry populations and prevalent diseases.
- Leading Technology: Live attenuated vaccines maintain a significant share due to their efficacy and cost-effectiveness.
- Leading Region: The Asia-Pacific region shows strong growth potential, fueled by increasing livestock populations and rising demand for improved animal health.
- Key Drivers (Asia-Pacific):
- Rapidly expanding livestock population.
- Increasing government investments in animal health infrastructure.
- Growing awareness among farmers regarding the importance of vaccination.
Dominance Analysis: The dominance of poultry vaccines and the Asia-Pacific region is driven by a combination of factors including favorable economic policies, expanding infrastructure for vaccine distribution, and a high prevalence of animal diseases requiring widespread vaccination.
Live Attenuated Vaccines Industry Product Developments
Recent advancements focus on the development of thermostable live attenuated vaccines to overcome cold-chain challenges. This allows for easier vaccine distribution and storage, particularly in developing nations. Further research explores multivalent vaccines, providing broader protection against multiple diseases with a single dose, improving cost-effectiveness and administration convenience. These improvements enhance market fit by addressing existing logistical and economic barriers, making vaccination more accessible and affordable.
Key Drivers of Live Attenuated Vaccines Industry Growth
The growth of the Live Attenuated Vaccines market is propelled by several key factors:
- Rising Livestock Population: The global livestock population is steadily increasing, leading to a higher demand for vaccines.
- Increasing Prevalence of Animal Diseases: Outbreaks of various animal diseases drive the need for effective vaccination programs.
- Technological Advancements: Innovation in vaccine technology is improving efficacy, safety, and accessibility.
- Government Initiatives: Government regulations and supportive policies promote vaccination programs.
Challenges in the Live Attenuated Vaccines Industry Market
The Live Attenuated Vaccines industry faces several challenges:
- Stringent Regulatory Approvals: The extensive regulatory approval process can delay product launches and increase costs.
- Cold Chain Logistics: Maintaining the cold chain for live attenuated vaccines poses logistical challenges.
- Competition: Intense competition among industry players puts pressure on pricing and profitability. This is estimated to reduce the market CAGR by approximately xx% in the next 5 years.
Emerging Opportunities in Live Attenuated Vaccines Industry
Emerging opportunities include:
- Technological Breakthroughs: Development of novel vaccine platforms and delivery systems.
- Strategic Partnerships: Collaborations between vaccine manufacturers and research institutions.
- Market Expansion: Focusing on under-served markets with limited vaccine access.
Leading Players in the Live Attenuated Vaccines Industry Sector
- Zoetis Inc
- Elanco
- AniCon Labor GmbH
- Boehringer Ingelheim International GmbH
- Biovac
- Animal Science Products Inc
- ADL BIONATUR SOLUTIONS S A
- Phibro Animal Health Corporation
- Ceva Sante Animale
- Merck & Co
Key Milestones in Live Attenuated Vaccines Industry Industry
- August 2022: The SRTF's agriculture project delivered a third batch of livestock vaccines to Northern Aleppo, indirectly benefiting 57,500 families.
- August 2022: Haryana, India, implemented a mass cattle vaccination program to combat lumpy skin disease, restricting cattle movement and fairs. These events highlight the crucial role of vaccines in animal health crises and government response strategies.
Strategic Outlook for Live Attenuated Vaccines Industry Market
The Live Attenuated Vaccines market holds significant future potential, driven by continuous technological advancements, expanding livestock populations, and increasing awareness of animal health. Strategic partnerships and market expansion into underserved regions present significant growth opportunities. Focus on developing thermostable and multivalent vaccines will be key to unlocking the full market potential.
Live Attenuated Vaccines Industry Segmentation
-
1. Product Type
- 1.1. Bovine Vaccine
- 1.2. Poultry Vaccine
- 1.3. Porcine Vaccine
- 1.4. Other Livestock Vaccines
-
2. Technology
- 2.1. Live Attenuated Vaccine
- 2.2. Inactivated Vaccine
- 2.3. Toxoid Vaccine
- 2.4. Recombinant Vaccine
- 2.5. Other Technologies
Live Attenuated Vaccines Industry Segmentation By Geography
-
1. North America
- 1.1. United States
- 1.2. Canada
- 1.3. Mexico
-
2. Europe
- 2.1. Germany
- 2.2. United Kingdom
- 2.3. France
- 2.4. Italy
- 2.5. Spain
- 2.6. Rest of Europe
-
3. Asia Pacific
- 3.1. China
- 3.2. Japan
- 3.3. India
- 3.4. Australia
- 3.5. South Korea
- 3.6. Rest of Asia Pacific
-
4. Middle East and Africa
- 4.1. GCC
- 4.2. South Africa
- 4.3. Rest of Middle East and Africa
-
5. South America
- 5.1. Brazil
- 5.2. Argentina
- 5.3. Rest of South America
Live Attenuated Vaccines Industry REPORT HIGHLIGHTS
| Aspects | Details |
|---|---|
| Study Period | 2019-2033 |
| Base Year | 2024 |
| Estimated Year | 2025 |
| Forecast Period | 2025-2033 |
| Historical Period | 2019-2024 |
| Growth Rate | CAGR of 4.21% from 2019-2033 |
| Segmentation |
|
Table of Contents
- 1. Introduction
- 1.1. Research Scope
- 1.2. Market Segmentation
- 1.3. Research Methodology
- 1.4. Definitions and Assumptions
- 2. Executive Summary
- 2.1. Introduction
- 3. Market Dynamics
- 3.1. Introduction
- 3.2. Market Drivers
- 3.2.1 Increasing Incidences of Zoonotic Diseases; Initiatives Taken by Various Government Agencies
- 3.2.2 Animal Associations
- 3.2.3 and Leading Players; Widened Focus on Food Safety
- 3.3. Market Restrains
- 3.3.1. Lack of Veterinarians and Shortage of Skilled Farm Workers; High Storage Costs for Vaccines
- 3.4. Market Trends
- 3.4.1. Poultry Vaccine is Expected to Cover a Large Share of the Livestock Vaccines Market
- 4. Market Factor Analysis
- 4.1. Porters Five Forces
- 4.2. Supply/Value Chain
- 4.3. PESTEL analysis
- 4.4. Market Entropy
- 4.5. Patent/Trademark Analysis
- 5. Global Live Attenuated Vaccines Industry Analysis, Insights and Forecast, 2019-2031
- 5.1. Market Analysis, Insights and Forecast - by Product Type
- 5.1.1. Bovine Vaccine
- 5.1.2. Poultry Vaccine
- 5.1.3. Porcine Vaccine
- 5.1.4. Other Livestock Vaccines
- 5.2. Market Analysis, Insights and Forecast - by Technology
- 5.2.1. Live Attenuated Vaccine
- 5.2.2. Inactivated Vaccine
- 5.2.3. Toxoid Vaccine
- 5.2.4. Recombinant Vaccine
- 5.2.5. Other Technologies
- 5.3. Market Analysis, Insights and Forecast - by Region
- 5.3.1. North America
- 5.3.2. Europe
- 5.3.3. Asia Pacific
- 5.3.4. Middle East and Africa
- 5.3.5. South America
- 5.1. Market Analysis, Insights and Forecast - by Product Type
- 6. North America Live Attenuated Vaccines Industry Analysis, Insights and Forecast, 2019-2031
- 6.1. Market Analysis, Insights and Forecast - by Product Type
- 6.1.1. Bovine Vaccine
- 6.1.2. Poultry Vaccine
- 6.1.3. Porcine Vaccine
- 6.1.4. Other Livestock Vaccines
- 6.2. Market Analysis, Insights and Forecast - by Technology
- 6.2.1. Live Attenuated Vaccine
- 6.2.2. Inactivated Vaccine
- 6.2.3. Toxoid Vaccine
- 6.2.4. Recombinant Vaccine
- 6.2.5. Other Technologies
- 6.1. Market Analysis, Insights and Forecast - by Product Type
- 7. Europe Live Attenuated Vaccines Industry Analysis, Insights and Forecast, 2019-2031
- 7.1. Market Analysis, Insights and Forecast - by Product Type
- 7.1.1. Bovine Vaccine
- 7.1.2. Poultry Vaccine
- 7.1.3. Porcine Vaccine
- 7.1.4. Other Livestock Vaccines
- 7.2. Market Analysis, Insights and Forecast - by Technology
- 7.2.1. Live Attenuated Vaccine
- 7.2.2. Inactivated Vaccine
- 7.2.3. Toxoid Vaccine
- 7.2.4. Recombinant Vaccine
- 7.2.5. Other Technologies
- 7.1. Market Analysis, Insights and Forecast - by Product Type
- 8. Asia Pacific Live Attenuated Vaccines Industry Analysis, Insights and Forecast, 2019-2031
- 8.1. Market Analysis, Insights and Forecast - by Product Type
- 8.1.1. Bovine Vaccine
- 8.1.2. Poultry Vaccine
- 8.1.3. Porcine Vaccine
- 8.1.4. Other Livestock Vaccines
- 8.2. Market Analysis, Insights and Forecast - by Technology
- 8.2.1. Live Attenuated Vaccine
- 8.2.2. Inactivated Vaccine
- 8.2.3. Toxoid Vaccine
- 8.2.4. Recombinant Vaccine
- 8.2.5. Other Technologies
- 8.1. Market Analysis, Insights and Forecast - by Product Type
- 9. Middle East and Africa Live Attenuated Vaccines Industry Analysis, Insights and Forecast, 2019-2031
- 9.1. Market Analysis, Insights and Forecast - by Product Type
- 9.1.1. Bovine Vaccine
- 9.1.2. Poultry Vaccine
- 9.1.3. Porcine Vaccine
- 9.1.4. Other Livestock Vaccines
- 9.2. Market Analysis, Insights and Forecast - by Technology
- 9.2.1. Live Attenuated Vaccine
- 9.2.2. Inactivated Vaccine
- 9.2.3. Toxoid Vaccine
- 9.2.4. Recombinant Vaccine
- 9.2.5. Other Technologies
- 9.1. Market Analysis, Insights and Forecast - by Product Type
- 10. South America Live Attenuated Vaccines Industry Analysis, Insights and Forecast, 2019-2031
- 10.1. Market Analysis, Insights and Forecast - by Product Type
- 10.1.1. Bovine Vaccine
- 10.1.2. Poultry Vaccine
- 10.1.3. Porcine Vaccine
- 10.1.4. Other Livestock Vaccines
- 10.2. Market Analysis, Insights and Forecast - by Technology
- 10.2.1. Live Attenuated Vaccine
- 10.2.2. Inactivated Vaccine
- 10.2.3. Toxoid Vaccine
- 10.2.4. Recombinant Vaccine
- 10.2.5. Other Technologies
- 10.1. Market Analysis, Insights and Forecast - by Product Type
- 11. North America Live Attenuated Vaccines Industry Analysis, Insights and Forecast, 2019-2031
- 11.1. Market Analysis, Insights and Forecast - By Country/Sub-region
- 11.1.1. undefined
- 12. Europe Live Attenuated Vaccines Industry Analysis, Insights and Forecast, 2019-2031
- 12.1. Market Analysis, Insights and Forecast - By Country/Sub-region
- 12.1.1. undefined
- 13. Asia Pacific Live Attenuated Vaccines Industry Analysis, Insights and Forecast, 2019-2031
- 13.1. Market Analysis, Insights and Forecast - By Country/Sub-region
- 13.1.1. undefined
- 14. Middle East and Africa Live Attenuated Vaccines Industry Analysis, Insights and Forecast, 2019-2031
- 14.1. Market Analysis, Insights and Forecast - By Country/Sub-region
- 14.1.1. undefined
- 15. South America Live Attenuated Vaccines Industry Analysis, Insights and Forecast, 2019-2031
- 15.1. Market Analysis, Insights and Forecast - By Country/Sub-region
- 15.1.1. undefined
- 16. Competitive Analysis
- 16.1. Global Market Share Analysis 2024
- 16.2. Company Profiles
- 16.2.1 Zoetis Inc
- 16.2.1.1. Overview
- 16.2.1.2. Products
- 16.2.1.3. SWOT Analysis
- 16.2.1.4. Recent Developments
- 16.2.1.5. Financials (Based on Availability)
- 16.2.2 Elanco
- 16.2.2.1. Overview
- 16.2.2.2. Products
- 16.2.2.3. SWOT Analysis
- 16.2.2.4. Recent Developments
- 16.2.2.5. Financials (Based on Availability)
- 16.2.3 AniCon Labor GmbH
- 16.2.3.1. Overview
- 16.2.3.2. Products
- 16.2.3.3. SWOT Analysis
- 16.2.3.4. Recent Developments
- 16.2.3.5. Financials (Based on Availability)
- 16.2.4 Boehringer Ingelheim International GmbH
- 16.2.4.1. Overview
- 16.2.4.2. Products
- 16.2.4.3. SWOT Analysis
- 16.2.4.4. Recent Developments
- 16.2.4.5. Financials (Based on Availability)
- 16.2.5 Biovac
- 16.2.5.1. Overview
- 16.2.5.2. Products
- 16.2.5.3. SWOT Analysis
- 16.2.5.4. Recent Developments
- 16.2.5.5. Financials (Based on Availability)
- 16.2.6 Animal Science Products Inc
- 16.2.6.1. Overview
- 16.2.6.2. Products
- 16.2.6.3. SWOT Analysis
- 16.2.6.4. Recent Developments
- 16.2.6.5. Financials (Based on Availability)
- 16.2.7 ADL BIONATUR SOLUTIONS S A
- 16.2.7.1. Overview
- 16.2.7.2. Products
- 16.2.7.3. SWOT Analysis
- 16.2.7.4. Recent Developments
- 16.2.7.5. Financials (Based on Availability)
- 16.2.8 Phibro Animal Health Corporation
- 16.2.8.1. Overview
- 16.2.8.2. Products
- 16.2.8.3. SWOT Analysis
- 16.2.8.4. Recent Developments
- 16.2.8.5. Financials (Based on Availability)
- 16.2.9 Ceva Sante Animale
- 16.2.9.1. Overview
- 16.2.9.2. Products
- 16.2.9.3. SWOT Analysis
- 16.2.9.4. Recent Developments
- 16.2.9.5. Financials (Based on Availability)
- 16.2.10 Merck & Co
- 16.2.10.1. Overview
- 16.2.10.2. Products
- 16.2.10.3. SWOT Analysis
- 16.2.10.4. Recent Developments
- 16.2.10.5. Financials (Based on Availability)
- 16.2.1 Zoetis Inc
List of Figures
- Figure 1: Global Live Attenuated Vaccines Industry Revenue Breakdown (Million, %) by Region 2024 & 2032
- Figure 2: Global Live Attenuated Vaccines Industry Volume Breakdown (K Unit, %) by Region 2024 & 2032
- Figure 3: North America Live Attenuated Vaccines Industry Revenue (Million), by Country 2024 & 2032
- Figure 4: North America Live Attenuated Vaccines Industry Volume (K Unit), by Country 2024 & 2032
- Figure 5: North America Live Attenuated Vaccines Industry Revenue Share (%), by Country 2024 & 2032
- Figure 6: North America Live Attenuated Vaccines Industry Volume Share (%), by Country 2024 & 2032
- Figure 7: Europe Live Attenuated Vaccines Industry Revenue (Million), by Country 2024 & 2032
- Figure 8: Europe Live Attenuated Vaccines Industry Volume (K Unit), by Country 2024 & 2032
- Figure 9: Europe Live Attenuated Vaccines Industry Revenue Share (%), by Country 2024 & 2032
- Figure 10: Europe Live Attenuated Vaccines Industry Volume Share (%), by Country 2024 & 2032
- Figure 11: Asia Pacific Live Attenuated Vaccines Industry Revenue (Million), by Country 2024 & 2032
- Figure 12: Asia Pacific Live Attenuated Vaccines Industry Volume (K Unit), by Country 2024 & 2032
- Figure 13: Asia Pacific Live Attenuated Vaccines Industry Revenue Share (%), by Country 2024 & 2032
- Figure 14: Asia Pacific Live Attenuated Vaccines Industry Volume Share (%), by Country 2024 & 2032
- Figure 15: Middle East and Africa Live Attenuated Vaccines Industry Revenue (Million), by Country 2024 & 2032
- Figure 16: Middle East and Africa Live Attenuated Vaccines Industry Volume (K Unit), by Country 2024 & 2032
- Figure 17: Middle East and Africa Live Attenuated Vaccines Industry Revenue Share (%), by Country 2024 & 2032
- Figure 18: Middle East and Africa Live Attenuated Vaccines Industry Volume Share (%), by Country 2024 & 2032
- Figure 19: South America Live Attenuated Vaccines Industry Revenue (Million), by Country 2024 & 2032
- Figure 20: South America Live Attenuated Vaccines Industry Volume (K Unit), by Country 2024 & 2032
- Figure 21: South America Live Attenuated Vaccines Industry Revenue Share (%), by Country 2024 & 2032
- Figure 22: South America Live Attenuated Vaccines Industry Volume Share (%), by Country 2024 & 2032
- Figure 23: North America Live Attenuated Vaccines Industry Revenue (Million), by Product Type 2024 & 2032
- Figure 24: North America Live Attenuated Vaccines Industry Volume (K Unit), by Product Type 2024 & 2032
- Figure 25: North America Live Attenuated Vaccines Industry Revenue Share (%), by Product Type 2024 & 2032
- Figure 26: North America Live Attenuated Vaccines Industry Volume Share (%), by Product Type 2024 & 2032
- Figure 27: North America Live Attenuated Vaccines Industry Revenue (Million), by Technology 2024 & 2032
- Figure 28: North America Live Attenuated Vaccines Industry Volume (K Unit), by Technology 2024 & 2032
- Figure 29: North America Live Attenuated Vaccines Industry Revenue Share (%), by Technology 2024 & 2032
- Figure 30: North America Live Attenuated Vaccines Industry Volume Share (%), by Technology 2024 & 2032
- Figure 31: North America Live Attenuated Vaccines Industry Revenue (Million), by Country 2024 & 2032
- Figure 32: North America Live Attenuated Vaccines Industry Volume (K Unit), by Country 2024 & 2032
- Figure 33: North America Live Attenuated Vaccines Industry Revenue Share (%), by Country 2024 & 2032
- Figure 34: North America Live Attenuated Vaccines Industry Volume Share (%), by Country 2024 & 2032
- Figure 35: Europe Live Attenuated Vaccines Industry Revenue (Million), by Product Type 2024 & 2032
- Figure 36: Europe Live Attenuated Vaccines Industry Volume (K Unit), by Product Type 2024 & 2032
- Figure 37: Europe Live Attenuated Vaccines Industry Revenue Share (%), by Product Type 2024 & 2032
- Figure 38: Europe Live Attenuated Vaccines Industry Volume Share (%), by Product Type 2024 & 2032
- Figure 39: Europe Live Attenuated Vaccines Industry Revenue (Million), by Technology 2024 & 2032
- Figure 40: Europe Live Attenuated Vaccines Industry Volume (K Unit), by Technology 2024 & 2032
- Figure 41: Europe Live Attenuated Vaccines Industry Revenue Share (%), by Technology 2024 & 2032
- Figure 42: Europe Live Attenuated Vaccines Industry Volume Share (%), by Technology 2024 & 2032
- Figure 43: Europe Live Attenuated Vaccines Industry Revenue (Million), by Country 2024 & 2032
- Figure 44: Europe Live Attenuated Vaccines Industry Volume (K Unit), by Country 2024 & 2032
- Figure 45: Europe Live Attenuated Vaccines Industry Revenue Share (%), by Country 2024 & 2032
- Figure 46: Europe Live Attenuated Vaccines Industry Volume Share (%), by Country 2024 & 2032
- Figure 47: Asia Pacific Live Attenuated Vaccines Industry Revenue (Million), by Product Type 2024 & 2032
- Figure 48: Asia Pacific Live Attenuated Vaccines Industry Volume (K Unit), by Product Type 2024 & 2032
- Figure 49: Asia Pacific Live Attenuated Vaccines Industry Revenue Share (%), by Product Type 2024 & 2032
- Figure 50: Asia Pacific Live Attenuated Vaccines Industry Volume Share (%), by Product Type 2024 & 2032
- Figure 51: Asia Pacific Live Attenuated Vaccines Industry Revenue (Million), by Technology 2024 & 2032
- Figure 52: Asia Pacific Live Attenuated Vaccines Industry Volume (K Unit), by Technology 2024 & 2032
- Figure 53: Asia Pacific Live Attenuated Vaccines Industry Revenue Share (%), by Technology 2024 & 2032
- Figure 54: Asia Pacific Live Attenuated Vaccines Industry Volume Share (%), by Technology 2024 & 2032
- Figure 55: Asia Pacific Live Attenuated Vaccines Industry Revenue (Million), by Country 2024 & 2032
- Figure 56: Asia Pacific Live Attenuated Vaccines Industry Volume (K Unit), by Country 2024 & 2032
- Figure 57: Asia Pacific Live Attenuated Vaccines Industry Revenue Share (%), by Country 2024 & 2032
- Figure 58: Asia Pacific Live Attenuated Vaccines Industry Volume Share (%), by Country 2024 & 2032
- Figure 59: Middle East and Africa Live Attenuated Vaccines Industry Revenue (Million), by Product Type 2024 & 2032
- Figure 60: Middle East and Africa Live Attenuated Vaccines Industry Volume (K Unit), by Product Type 2024 & 2032
- Figure 61: Middle East and Africa Live Attenuated Vaccines Industry Revenue Share (%), by Product Type 2024 & 2032
- Figure 62: Middle East and Africa Live Attenuated Vaccines Industry Volume Share (%), by Product Type 2024 & 2032
- Figure 63: Middle East and Africa Live Attenuated Vaccines Industry Revenue (Million), by Technology 2024 & 2032
- Figure 64: Middle East and Africa Live Attenuated Vaccines Industry Volume (K Unit), by Technology 2024 & 2032
- Figure 65: Middle East and Africa Live Attenuated Vaccines Industry Revenue Share (%), by Technology 2024 & 2032
- Figure 66: Middle East and Africa Live Attenuated Vaccines Industry Volume Share (%), by Technology 2024 & 2032
- Figure 67: Middle East and Africa Live Attenuated Vaccines Industry Revenue (Million), by Country 2024 & 2032
- Figure 68: Middle East and Africa Live Attenuated Vaccines Industry Volume (K Unit), by Country 2024 & 2032
- Figure 69: Middle East and Africa Live Attenuated Vaccines Industry Revenue Share (%), by Country 2024 & 2032
- Figure 70: Middle East and Africa Live Attenuated Vaccines Industry Volume Share (%), by Country 2024 & 2032
- Figure 71: South America Live Attenuated Vaccines Industry Revenue (Million), by Product Type 2024 & 2032
- Figure 72: South America Live Attenuated Vaccines Industry Volume (K Unit), by Product Type 2024 & 2032
- Figure 73: South America Live Attenuated Vaccines Industry Revenue Share (%), by Product Type 2024 & 2032
- Figure 74: South America Live Attenuated Vaccines Industry Volume Share (%), by Product Type 2024 & 2032
- Figure 75: South America Live Attenuated Vaccines Industry Revenue (Million), by Technology 2024 & 2032
- Figure 76: South America Live Attenuated Vaccines Industry Volume (K Unit), by Technology 2024 & 2032
- Figure 77: South America Live Attenuated Vaccines Industry Revenue Share (%), by Technology 2024 & 2032
- Figure 78: South America Live Attenuated Vaccines Industry Volume Share (%), by Technology 2024 & 2032
- Figure 79: South America Live Attenuated Vaccines Industry Revenue (Million), by Country 2024 & 2032
- Figure 80: South America Live Attenuated Vaccines Industry Volume (K Unit), by Country 2024 & 2032
- Figure 81: South America Live Attenuated Vaccines Industry Revenue Share (%), by Country 2024 & 2032
- Figure 82: South America Live Attenuated Vaccines Industry Volume Share (%), by Country 2024 & 2032
List of Tables
- Table 1: Global Live Attenuated Vaccines Industry Revenue Million Forecast, by Region 2019 & 2032
- Table 2: Global Live Attenuated Vaccines Industry Volume K Unit Forecast, by Region 2019 & 2032
- Table 3: Global Live Attenuated Vaccines Industry Revenue Million Forecast, by Product Type 2019 & 2032
- Table 4: Global Live Attenuated Vaccines Industry Volume K Unit Forecast, by Product Type 2019 & 2032
- Table 5: Global Live Attenuated Vaccines Industry Revenue Million Forecast, by Technology 2019 & 2032
- Table 6: Global Live Attenuated Vaccines Industry Volume K Unit Forecast, by Technology 2019 & 2032
- Table 7: Global Live Attenuated Vaccines Industry Revenue Million Forecast, by Region 2019 & 2032
- Table 8: Global Live Attenuated Vaccines Industry Volume K Unit Forecast, by Region 2019 & 2032
- Table 9: Global Live Attenuated Vaccines Industry Revenue Million Forecast, by Country 2019 & 2032
- Table 10: Global Live Attenuated Vaccines Industry Volume K Unit Forecast, by Country 2019 & 2032
- Table 11: Global Live Attenuated Vaccines Industry Revenue Million Forecast, by Country 2019 & 2032
- Table 12: Global Live Attenuated Vaccines Industry Volume K Unit Forecast, by Country 2019 & 2032
- Table 13: Global Live Attenuated Vaccines Industry Revenue Million Forecast, by Country 2019 & 2032
- Table 14: Global Live Attenuated Vaccines Industry Volume K Unit Forecast, by Country 2019 & 2032
- Table 15: Global Live Attenuated Vaccines Industry Revenue Million Forecast, by Country 2019 & 2032
- Table 16: Global Live Attenuated Vaccines Industry Volume K Unit Forecast, by Country 2019 & 2032
- Table 17: Global Live Attenuated Vaccines Industry Revenue Million Forecast, by Country 2019 & 2032
- Table 18: Global Live Attenuated Vaccines Industry Volume K Unit Forecast, by Country 2019 & 2032
- Table 19: Global Live Attenuated Vaccines Industry Revenue Million Forecast, by Product Type 2019 & 2032
- Table 20: Global Live Attenuated Vaccines Industry Volume K Unit Forecast, by Product Type 2019 & 2032
- Table 21: Global Live Attenuated Vaccines Industry Revenue Million Forecast, by Technology 2019 & 2032
- Table 22: Global Live Attenuated Vaccines Industry Volume K Unit Forecast, by Technology 2019 & 2032
- Table 23: Global Live Attenuated Vaccines Industry Revenue Million Forecast, by Country 2019 & 2032
- Table 24: Global Live Attenuated Vaccines Industry Volume K Unit Forecast, by Country 2019 & 2032
- Table 25: United States Live Attenuated Vaccines Industry Revenue (Million) Forecast, by Application 2019 & 2032
- Table 26: United States Live Attenuated Vaccines Industry Volume (K Unit) Forecast, by Application 2019 & 2032
- Table 27: Canada Live Attenuated Vaccines Industry Revenue (Million) Forecast, by Application 2019 & 2032
- Table 28: Canada Live Attenuated Vaccines Industry Volume (K Unit) Forecast, by Application 2019 & 2032
- Table 29: Mexico Live Attenuated Vaccines Industry Revenue (Million) Forecast, by Application 2019 & 2032
- Table 30: Mexico Live Attenuated Vaccines Industry Volume (K Unit) Forecast, by Application 2019 & 2032
- Table 31: Global Live Attenuated Vaccines Industry Revenue Million Forecast, by Product Type 2019 & 2032
- Table 32: Global Live Attenuated Vaccines Industry Volume K Unit Forecast, by Product Type 2019 & 2032
- Table 33: Global Live Attenuated Vaccines Industry Revenue Million Forecast, by Technology 2019 & 2032
- Table 34: Global Live Attenuated Vaccines Industry Volume K Unit Forecast, by Technology 2019 & 2032
- Table 35: Global Live Attenuated Vaccines Industry Revenue Million Forecast, by Country 2019 & 2032
- Table 36: Global Live Attenuated Vaccines Industry Volume K Unit Forecast, by Country 2019 & 2032
- Table 37: Germany Live Attenuated Vaccines Industry Revenue (Million) Forecast, by Application 2019 & 2032
- Table 38: Germany Live Attenuated Vaccines Industry Volume (K Unit) Forecast, by Application 2019 & 2032
- Table 39: United Kingdom Live Attenuated Vaccines Industry Revenue (Million) Forecast, by Application 2019 & 2032
- Table 40: United Kingdom Live Attenuated Vaccines Industry Volume (K Unit) Forecast, by Application 2019 & 2032
- Table 41: France Live Attenuated Vaccines Industry Revenue (Million) Forecast, by Application 2019 & 2032
- Table 42: France Live Attenuated Vaccines Industry Volume (K Unit) Forecast, by Application 2019 & 2032
- Table 43: Italy Live Attenuated Vaccines Industry Revenue (Million) Forecast, by Application 2019 & 2032
- Table 44: Italy Live Attenuated Vaccines Industry Volume (K Unit) Forecast, by Application 2019 & 2032
- Table 45: Spain Live Attenuated Vaccines Industry Revenue (Million) Forecast, by Application 2019 & 2032
- Table 46: Spain Live Attenuated Vaccines Industry Volume (K Unit) Forecast, by Application 2019 & 2032
- Table 47: Rest of Europe Live Attenuated Vaccines Industry Revenue (Million) Forecast, by Application 2019 & 2032
- Table 48: Rest of Europe Live Attenuated Vaccines Industry Volume (K Unit) Forecast, by Application 2019 & 2032
- Table 49: Global Live Attenuated Vaccines Industry Revenue Million Forecast, by Product Type 2019 & 2032
- Table 50: Global Live Attenuated Vaccines Industry Volume K Unit Forecast, by Product Type 2019 & 2032
- Table 51: Global Live Attenuated Vaccines Industry Revenue Million Forecast, by Technology 2019 & 2032
- Table 52: Global Live Attenuated Vaccines Industry Volume K Unit Forecast, by Technology 2019 & 2032
- Table 53: Global Live Attenuated Vaccines Industry Revenue Million Forecast, by Country 2019 & 2032
- Table 54: Global Live Attenuated Vaccines Industry Volume K Unit Forecast, by Country 2019 & 2032
- Table 55: China Live Attenuated Vaccines Industry Revenue (Million) Forecast, by Application 2019 & 2032
- Table 56: China Live Attenuated Vaccines Industry Volume (K Unit) Forecast, by Application 2019 & 2032
- Table 57: Japan Live Attenuated Vaccines Industry Revenue (Million) Forecast, by Application 2019 & 2032
- Table 58: Japan Live Attenuated Vaccines Industry Volume (K Unit) Forecast, by Application 2019 & 2032
- Table 59: India Live Attenuated Vaccines Industry Revenue (Million) Forecast, by Application 2019 & 2032
- Table 60: India Live Attenuated Vaccines Industry Volume (K Unit) Forecast, by Application 2019 & 2032
- Table 61: Australia Live Attenuated Vaccines Industry Revenue (Million) Forecast, by Application 2019 & 2032
- Table 62: Australia Live Attenuated Vaccines Industry Volume (K Unit) Forecast, by Application 2019 & 2032
- Table 63: South Korea Live Attenuated Vaccines Industry Revenue (Million) Forecast, by Application 2019 & 2032
- Table 64: South Korea Live Attenuated Vaccines Industry Volume (K Unit) Forecast, by Application 2019 & 2032
- Table 65: Rest of Asia Pacific Live Attenuated Vaccines Industry Revenue (Million) Forecast, by Application 2019 & 2032
- Table 66: Rest of Asia Pacific Live Attenuated Vaccines Industry Volume (K Unit) Forecast, by Application 2019 & 2032
- Table 67: Global Live Attenuated Vaccines Industry Revenue Million Forecast, by Product Type 2019 & 2032
- Table 68: Global Live Attenuated Vaccines Industry Volume K Unit Forecast, by Product Type 2019 & 2032
- Table 69: Global Live Attenuated Vaccines Industry Revenue Million Forecast, by Technology 2019 & 2032
- Table 70: Global Live Attenuated Vaccines Industry Volume K Unit Forecast, by Technology 2019 & 2032
- Table 71: Global Live Attenuated Vaccines Industry Revenue Million Forecast, by Country 2019 & 2032
- Table 72: Global Live Attenuated Vaccines Industry Volume K Unit Forecast, by Country 2019 & 2032
- Table 73: GCC Live Attenuated Vaccines Industry Revenue (Million) Forecast, by Application 2019 & 2032
- Table 74: GCC Live Attenuated Vaccines Industry Volume (K Unit) Forecast, by Application 2019 & 2032
- Table 75: South Africa Live Attenuated Vaccines Industry Revenue (Million) Forecast, by Application 2019 & 2032
- Table 76: South Africa Live Attenuated Vaccines Industry Volume (K Unit) Forecast, by Application 2019 & 2032
- Table 77: Rest of Middle East and Africa Live Attenuated Vaccines Industry Revenue (Million) Forecast, by Application 2019 & 2032
- Table 78: Rest of Middle East and Africa Live Attenuated Vaccines Industry Volume (K Unit) Forecast, by Application 2019 & 2032
- Table 79: Global Live Attenuated Vaccines Industry Revenue Million Forecast, by Product Type 2019 & 2032
- Table 80: Global Live Attenuated Vaccines Industry Volume K Unit Forecast, by Product Type 2019 & 2032
- Table 81: Global Live Attenuated Vaccines Industry Revenue Million Forecast, by Technology 2019 & 2032
- Table 82: Global Live Attenuated Vaccines Industry Volume K Unit Forecast, by Technology 2019 & 2032
- Table 83: Global Live Attenuated Vaccines Industry Revenue Million Forecast, by Country 2019 & 2032
- Table 84: Global Live Attenuated Vaccines Industry Volume K Unit Forecast, by Country 2019 & 2032
- Table 85: Brazil Live Attenuated Vaccines Industry Revenue (Million) Forecast, by Application 2019 & 2032
- Table 86: Brazil Live Attenuated Vaccines Industry Volume (K Unit) Forecast, by Application 2019 & 2032
- Table 87: Argentina Live Attenuated Vaccines Industry Revenue (Million) Forecast, by Application 2019 & 2032
- Table 88: Argentina Live Attenuated Vaccines Industry Volume (K Unit) Forecast, by Application 2019 & 2032
- Table 89: Rest of South America Live Attenuated Vaccines Industry Revenue (Million) Forecast, by Application 2019 & 2032
- Table 90: Rest of South America Live Attenuated Vaccines Industry Volume (K Unit) Forecast, by Application 2019 & 2032
Frequently Asked Questions
1. What is the projected Compound Annual Growth Rate (CAGR) of the Live Attenuated Vaccines Industry?
The projected CAGR is approximately 4.21%.
2. Which companies are prominent players in the Live Attenuated Vaccines Industry?
Key companies in the market include Zoetis Inc, Elanco, AniCon Labor GmbH, Boehringer Ingelheim International GmbH, Biovac, Animal Science Products Inc, ADL BIONATUR SOLUTIONS S A, Phibro Animal Health Corporation, Ceva Sante Animale, Merck & Co.
3. What are the main segments of the Live Attenuated Vaccines Industry?
The market segments include Product Type, Technology.
4. Can you provide details about the market size?
The market size is estimated to be USD 5.88 Million as of 2022.
5. What are some drivers contributing to market growth?
Increasing Incidences of Zoonotic Diseases; Initiatives Taken by Various Government Agencies. Animal Associations. and Leading Players; Widened Focus on Food Safety.
6. What are the notable trends driving market growth?
Poultry Vaccine is Expected to Cover a Large Share of the Livestock Vaccines Market.
7. Are there any restraints impacting market growth?
Lack of Veterinarians and Shortage of Skilled Farm Workers; High Storage Costs for Vaccines.
8. Can you provide examples of recent developments in the market?
In August 2022, The SRTF's agriculture project 'Support for the Recovery of Livestock Production Within Northern Aleppo- Phase II' announced receiving the third batch of livestock vaccines. Indirectly, the project will benefit 57,500 estimated family members of livestock breeders in the project area populated by an estimated 250,000 people.
9. What pricing options are available for accessing the report?
Pricing options include single-user, multi-user, and enterprise licenses priced at USD 4750, USD 5250, and USD 8750 respectively.
10. Is the market size provided in terms of value or volume?
The market size is provided in terms of value, measured in Million and volume, measured in K Unit.
11. Are there any specific market keywords associated with the report?
Yes, the market keyword associated with the report is "Live Attenuated Vaccines Industry," which aids in identifying and referencing the specific market segment covered.
12. How do I determine which pricing option suits my needs best?
The pricing options vary based on user requirements and access needs. Individual users may opt for single-user licenses, while businesses requiring broader access may choose multi-user or enterprise licenses for cost-effective access to the report.
13. Are there any additional resources or data provided in the Live Attenuated Vaccines Industry report?
While the report offers comprehensive insights, it's advisable to review the specific contents or supplementary materials provided to ascertain if additional resources or data are available.
14. How can I stay updated on further developments or reports in the Live Attenuated Vaccines Industry?
To stay informed about further developments, trends, and reports in the Live Attenuated Vaccines Industry, consider subscribing to industry newsletters, following relevant companies and organizations, or regularly checking reputable industry news sources and publications.
Methodology
Step 1 - Identification of Relevant Samples Size from Population Database


Step 2 - Approaches for Defining Global Market Size (Value, Volume* & Price*)

Note*: In applicable scenarios
Step 3 - Data Sources
Primary Research
- Web Analytics
- Survey Reports
- Research Institute
- Latest Research Reports
- Opinion Leaders
Secondary Research
- Annual Reports
- White Paper
- Latest Press Release
- Industry Association
- Paid Database
- Investor Presentations

Step 4 - Data Triangulation
Involves using different sources of information in order to increase the validity of a study
These sources are likely to be stakeholders in a program - participants, other researchers, program staff, other community members, and so on.
Then we put all data in single framework & apply various statistical tools to find out the dynamic on the market.
During the analysis stage, feedback from the stakeholder groups would be compared to determine areas of agreement as well as areas of divergence
