

Key Insights
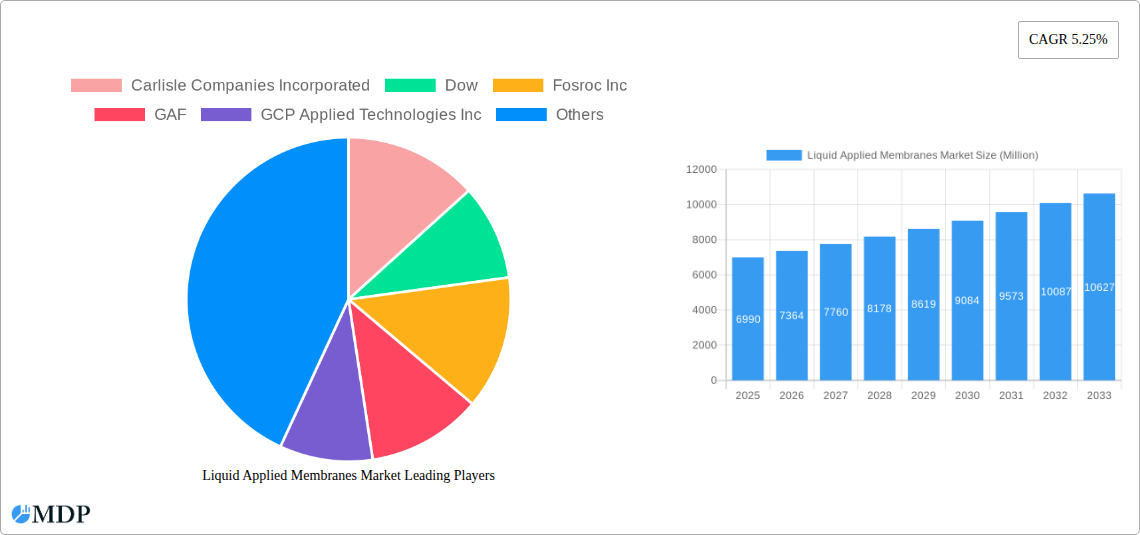
The global liquid applied membranes market, valued at $6.99 billion in 2025, is projected to experience robust growth, driven by several key factors. The increasing demand for sustainable and energy-efficient building solutions is a major catalyst. Liquid applied membranes offer superior waterproofing and insulation properties compared to traditional methods, contributing to reduced energy consumption and lower carbon footprints. Furthermore, the rising prevalence of green building initiatives and stringent building codes globally are pushing the adoption of environmentally friendly roofing and waterproofing materials, further boosting market growth. The construction industry's ongoing expansion, particularly in developing economies experiencing rapid urbanization, fuels this demand. Innovation in membrane formulations, focusing on enhanced durability, flexibility, and UV resistance, is also a key driver. Competition among established players like Carlisle Companies Incorporated, Dow, and Sika AG, alongside emerging players, is fostering innovation and price competitiveness. While challenges such as material cost fluctuations and the need for skilled labor for proper application exist, the long-term growth prospects for the liquid applied membranes market remain positive.
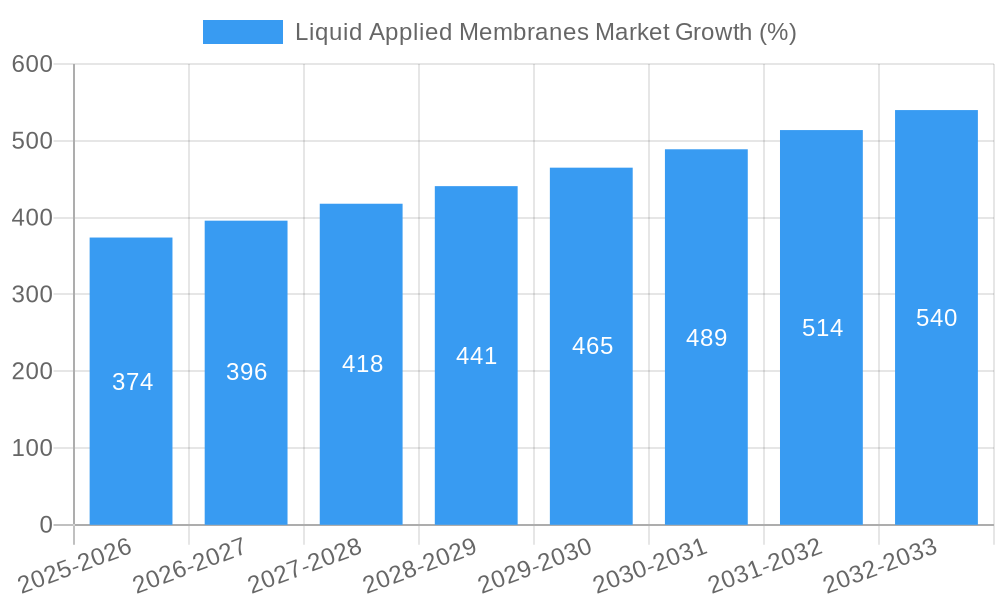
The market's compound annual growth rate (CAGR) of 5.25% from 2025 to 2033 indicates a steady expansion. This growth is expected to be distributed across various segments, with likely stronger performance in regions experiencing significant construction activity. Factors such as government regulations promoting sustainable building practices and the growing awareness among building owners about the long-term benefits of liquid applied membranes will continue to fuel market expansion. The market is segmented based on polymer type (e.g., polyurethane, acrylic, bitumen), application (roofing, waterproofing, tanking), and end-use (residential, commercial, industrial). The future will likely see a greater emphasis on specialized formulations tailored to specific applications and regional climatic conditions. This market segment will continue its growth trajectory due to the aforementioned factors and the continued push towards more sustainable and durable construction techniques.
Liquid Applied Membranes Market: A Comprehensive Report (2019-2033)
This in-depth report provides a comprehensive analysis of the Liquid Applied Membranes Market, offering invaluable insights for industry stakeholders, investors, and strategic decision-makers. Covering the period from 2019 to 2033, with a focus on 2025, this study unveils market dynamics, trends, opportunities, and challenges shaping this dynamic sector. The report forecasts robust growth, driven by technological advancements and expanding applications across diverse industries. Download now to gain a competitive edge.
Liquid Applied Membranes Market Dynamics & Concentration
The Liquid Applied Membranes Market is characterized by a moderately concentrated landscape, with several major players holding significant market share. However, the presence of numerous smaller, specialized companies fosters innovation and competition. The market's dynamics are influenced by several key factors:
Market Concentration: The top 10 players collectively hold an estimated xx% market share in 2025, indicating a moderately concentrated market structure. Further consolidation is expected through mergers and acquisitions (M&A).
Innovation Drivers: Ongoing research and development efforts focus on enhancing membrane properties like durability, flexibility, and UV resistance. This fuels the adoption of technologically advanced liquid applied membranes across various applications.
Regulatory Frameworks: Building codes and environmental regulations play a crucial role, driving demand for sustainable and environmentally friendly membrane solutions. Compliance requirements influence product development and market penetration.
Product Substitutes: Traditional waterproofing materials like sheet membranes and bituminous materials pose competition; however, the advantages of liquid applied membranes in terms of ease of application and seamless coverage are driving market growth.
End-User Trends: The increasing demand for energy-efficient buildings and infrastructure projects, along with stringent waterproofing needs, fuels the growth of liquid applied membranes.
M&A Activities: The market witnessed xx M&A deals between 2019 and 2024, indicating a trend towards consolidation and expansion among major players. A notable example is the May 2023 acquisition of MBCC Group by Sika AG, significantly impacting market dynamics.
Liquid Applied Membranes Market Industry Trends & Analysis
The global Liquid Applied Membranes Market is experiencing substantial growth, projected to reach xx Million by 2033, exhibiting a CAGR of xx% during the forecast period (2025-2033). Several factors contribute to this expansion:
The market is witnessing a shift towards high-performance, eco-friendly, and cost-effective solutions. Technological advancements, such as the development of self-healing membranes and those incorporating nanotechnology, are further enhancing market attractiveness. Consumer preferences are increasingly favoring durable, long-lasting, and easy-to-install membranes. The competitive landscape is dynamic, with companies focusing on product diversification, strategic partnerships, and geographic expansion to gain a competitive edge. Market penetration is increasing steadily across various end-use sectors, driven by growing awareness of the benefits offered by liquid applied membranes.
Leading Markets & Segments in Liquid Applied Membranes Market
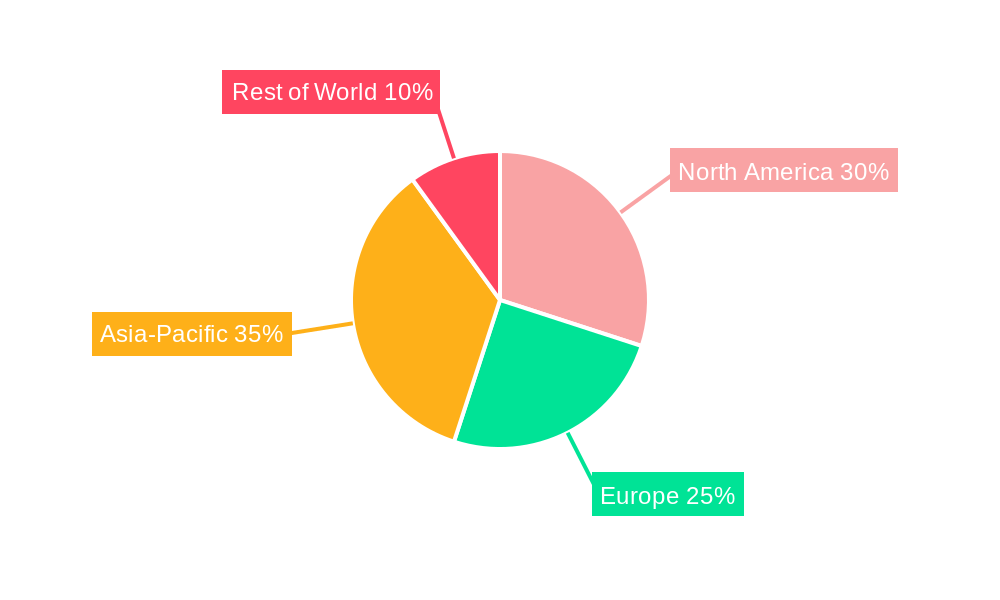
The North American region currently holds the largest market share, driven primarily by robust construction activities and stringent building codes. However, Asia-Pacific is expected to witness significant growth during the forecast period due to rapid urbanization and infrastructure development.
Key Drivers in North America:
- Strong construction industry growth.
- Stringent building codes and regulations.
- High adoption of energy-efficient building technologies.
Key Drivers in Asia-Pacific:
- Rapid urbanization and infrastructure development.
- Increasing government investments in construction projects.
- Growing awareness of the benefits of liquid applied membranes.
Detailed analysis reveals that the roofing segment currently dominates, followed by the waterproofing segment. The industrial sector exhibits the highest growth potential.
Liquid Applied Membranes Market Product Developments
Recent product innovations focus on enhancing durability, flexibility, and UV resistance. New formulations incorporate sustainable materials, reducing environmental impact. Advanced applications include self-healing technologies and integration with smart building systems. Competitive advantages lie in superior performance characteristics, ease of application, and long-term cost-effectiveness. The market increasingly features customized solutions tailored to specific application needs and environmental conditions.
Key Drivers of Liquid Applied Membranes Market Growth
Several factors drive the market's growth trajectory:
Technological Advancements: Innovations in polymer chemistry and nanotechnology enhance membrane performance and expand applications.
Economic Growth: Robust construction activity and infrastructure development in several regions fuel demand for waterproofing and roofing solutions.
Stringent Regulations: Environmental regulations and building codes promote the adoption of sustainable and high-performance membranes.
Challenges in the Liquid Applied Membranes Market
The market faces challenges including:
Fluctuating Raw Material Prices: Price volatility impacts production costs and profitability.
Supply Chain Disruptions: Global events can disrupt the supply of raw materials and finished products.
Intense Competition: The market is relatively competitive, with several established players and emerging companies. This competition exerts pressure on pricing and margins.
Emerging Opportunities in Liquid Applied Membranes Market
The market presents several promising opportunities:
Expansion into Emerging Markets: Untapped potential exists in developing economies experiencing rapid infrastructure development.
Strategic Partnerships and Collaborations: Joint ventures can facilitate technology transfer and market access.
Development of Innovative Products: Research and development efforts focused on creating sustainable and high-performance membranes can drive future growth.
Leading Players in the Liquid Applied Membranes Market Sector
- Carlisle Companies Incorporated
- Dow
- Fosroc Inc
- GAF
- GCP Applied Technologies Inc
- Henry Company
- Johns Manville (A Berkshire Hathaway Company)
- KEMPER SYSTEM Ltd
- MAPEI SpA
- SOPREMA INC
- Saint-Gobain Weber
- Sika AG *List Not Exhaustive
Key Milestones in Liquid Applied Membranes Market Industry
- May 2023: Sika AG completed the acquisition of MBCC Group, a global supplier of construction chemicals, significantly expanding Sika's market presence and product portfolio. This acquisition is expected to accelerate innovation and enhance market share.
Strategic Outlook for Liquid Applied Membranes Market
The Liquid Applied Membranes Market is poised for continued growth, driven by technological advancements, sustainable practices, and expanding applications. Strategic opportunities lie in focusing on innovation, sustainability, and market diversification. Companies should prioritize research and development, strategic partnerships, and expansion into high-growth markets to maximize their market share and profitability. The long-term outlook remains positive, with strong potential for growth in both developed and emerging economies.
Liquid Applied Membranes Market Segmentation
-
1. Type
- 1.1. Polyurethane
- 1.2. Cementitious
- 1.3. Bituminous
- 1.4. Other Types
-
2. Application
- 2.1. Roofing
- 2.2. Walls
- 2.3. Underground and Tunnels
- 2.4. Other Applications
Liquid Applied Membranes Market Segmentation By Geography
-
1. Asia Pacific
- 1.1. China
- 1.2. India
- 1.3. Japan
- 1.4. South Korea
- 1.5. ASEAN Countries
- 1.6. Rest of Asia Pacific
-
2. North America
- 2.1. United States
- 2.2. Canada
- 2.3. Mexico
-
3. Europe
- 3.1. Germany
- 3.2. United Kingdom
- 3.3. Italy
- 3.4. France
- 3.5. Russia
- 3.6. Rest of Europe
-
4. South America
- 4.1. Brazil
- 4.2. Argentina
- 4.3. Rest of South America
-
5. Middle East and Africa
- 5.1. Saudi Arabia
- 5.2. South Africa
- 5.3. Rest of Middle East and Africa
Liquid Applied Membranes Market REPORT HIGHLIGHTS
| Aspects | Details |
|---|---|
| Study Period | 2019-2033 |
| Base Year | 2024 |
| Estimated Year | 2025 |
| Forecast Period | 2025-2033 |
| Historical Period | 2019-2024 |
| Growth Rate | CAGR of 5.25% from 2019-2033 |
| Segmentation |
|
Table of Contents
- 1. Introduction
- 1.1. Research Scope
- 1.2. Market Segmentation
- 1.3. Research Methodology
- 1.4. Definitions and Assumptions
- 2. Executive Summary
- 2.1. Introduction
- 3. Market Dynamics
- 3.1. Introduction
- 3.2. Market Drivers
- 3.2.1. Growing Usage of Waterproofing Membranes to Maintain Longevity of Buildings; Increasing Benefits of Liquid Applied Membranes Resulting in Cost-effective Construction; Growing Infrastructural and Commercial Projects in Emerging Economies
- 3.3. Market Restrains
- 3.3.1. Growing Usage of Waterproofing Membranes to Maintain Longevity of Buildings; Increasing Benefits of Liquid Applied Membranes Resulting in Cost-effective Construction; Growing Infrastructural and Commercial Projects in Emerging Economies
- 3.4. Market Trends
- 3.4.1. Roofing Application is Expected to Dominate the Market
- 4. Market Factor Analysis
- 4.1. Porters Five Forces
- 4.2. Supply/Value Chain
- 4.3. PESTEL analysis
- 4.4. Market Entropy
- 4.5. Patent/Trademark Analysis
- 5. Global Liquid Applied Membranes Market Analysis, Insights and Forecast, 2019-2031
- 5.1. Market Analysis, Insights and Forecast - by Type
- 5.1.1. Polyurethane
- 5.1.2. Cementitious
- 5.1.3. Bituminous
- 5.1.4. Other Types
- 5.2. Market Analysis, Insights and Forecast - by Application
- 5.2.1. Roofing
- 5.2.2. Walls
- 5.2.3. Underground and Tunnels
- 5.2.4. Other Applications
- 5.3. Market Analysis, Insights and Forecast - by Region
- 5.3.1. Asia Pacific
- 5.3.2. North America
- 5.3.3. Europe
- 5.3.4. South America
- 5.3.5. Middle East and Africa
- 5.1. Market Analysis, Insights and Forecast - by Type
- 6. Asia Pacific Liquid Applied Membranes Market Analysis, Insights and Forecast, 2019-2031
- 6.1. Market Analysis, Insights and Forecast - by Type
- 6.1.1. Polyurethane
- 6.1.2. Cementitious
- 6.1.3. Bituminous
- 6.1.4. Other Types
- 6.2. Market Analysis, Insights and Forecast - by Application
- 6.2.1. Roofing
- 6.2.2. Walls
- 6.2.3. Underground and Tunnels
- 6.2.4. Other Applications
- 6.1. Market Analysis, Insights and Forecast - by Type
- 7. North America Liquid Applied Membranes Market Analysis, Insights and Forecast, 2019-2031
- 7.1. Market Analysis, Insights and Forecast - by Type
- 7.1.1. Polyurethane
- 7.1.2. Cementitious
- 7.1.3. Bituminous
- 7.1.4. Other Types
- 7.2. Market Analysis, Insights and Forecast - by Application
- 7.2.1. Roofing
- 7.2.2. Walls
- 7.2.3. Underground and Tunnels
- 7.2.4. Other Applications
- 7.1. Market Analysis, Insights and Forecast - by Type
- 8. Europe Liquid Applied Membranes Market Analysis, Insights and Forecast, 2019-2031
- 8.1. Market Analysis, Insights and Forecast - by Type
- 8.1.1. Polyurethane
- 8.1.2. Cementitious
- 8.1.3. Bituminous
- 8.1.4. Other Types
- 8.2. Market Analysis, Insights and Forecast - by Application
- 8.2.1. Roofing
- 8.2.2. Walls
- 8.2.3. Underground and Tunnels
- 8.2.4. Other Applications
- 8.1. Market Analysis, Insights and Forecast - by Type
- 9. South America Liquid Applied Membranes Market Analysis, Insights and Forecast, 2019-2031
- 9.1. Market Analysis, Insights and Forecast - by Type
- 9.1.1. Polyurethane
- 9.1.2. Cementitious
- 9.1.3. Bituminous
- 9.1.4. Other Types
- 9.2. Market Analysis, Insights and Forecast - by Application
- 9.2.1. Roofing
- 9.2.2. Walls
- 9.2.3. Underground and Tunnels
- 9.2.4. Other Applications
- 9.1. Market Analysis, Insights and Forecast - by Type
- 10. Middle East and Africa Liquid Applied Membranes Market Analysis, Insights and Forecast, 2019-2031
- 10.1. Market Analysis, Insights and Forecast - by Type
- 10.1.1. Polyurethane
- 10.1.2. Cementitious
- 10.1.3. Bituminous
- 10.1.4. Other Types
- 10.2. Market Analysis, Insights and Forecast - by Application
- 10.2.1. Roofing
- 10.2.2. Walls
- 10.2.3. Underground and Tunnels
- 10.2.4. Other Applications
- 10.1. Market Analysis, Insights and Forecast - by Type
- 11. Competitive Analysis
- 11.1. Global Market Share Analysis 2024
- 11.2. Company Profiles
- 11.2.1 Carlisle Companies Incorporated
- 11.2.1.1. Overview
- 11.2.1.2. Products
- 11.2.1.3. SWOT Analysis
- 11.2.1.4. Recent Developments
- 11.2.1.5. Financials (Based on Availability)
- 11.2.2 Dow
- 11.2.2.1. Overview
- 11.2.2.2. Products
- 11.2.2.3. SWOT Analysis
- 11.2.2.4. Recent Developments
- 11.2.2.5. Financials (Based on Availability)
- 11.2.3 Fosroc Inc
- 11.2.3.1. Overview
- 11.2.3.2. Products
- 11.2.3.3. SWOT Analysis
- 11.2.3.4. Recent Developments
- 11.2.3.5. Financials (Based on Availability)
- 11.2.4 GAF
- 11.2.4.1. Overview
- 11.2.4.2. Products
- 11.2.4.3. SWOT Analysis
- 11.2.4.4. Recent Developments
- 11.2.4.5. Financials (Based on Availability)
- 11.2.5 GCP Applied Technologies Inc
- 11.2.5.1. Overview
- 11.2.5.2. Products
- 11.2.5.3. SWOT Analysis
- 11.2.5.4. Recent Developments
- 11.2.5.5. Financials (Based on Availability)
- 11.2.6 Henry Company
- 11.2.6.1. Overview
- 11.2.6.2. Products
- 11.2.6.3. SWOT Analysis
- 11.2.6.4. Recent Developments
- 11.2.6.5. Financials (Based on Availability)
- 11.2.7 Johns Manville (A Berkshire Hathaway Company)
- 11.2.7.1. Overview
- 11.2.7.2. Products
- 11.2.7.3. SWOT Analysis
- 11.2.7.4. Recent Developments
- 11.2.7.5. Financials (Based on Availability)
- 11.2.8 KEMPER SYSTEM Ltd
- 11.2.8.1. Overview
- 11.2.8.2. Products
- 11.2.8.3. SWOT Analysis
- 11.2.8.4. Recent Developments
- 11.2.8.5. Financials (Based on Availability)
- 11.2.9 MAPEI SpA
- 11.2.9.1. Overview
- 11.2.9.2. Products
- 11.2.9.3. SWOT Analysis
- 11.2.9.4. Recent Developments
- 11.2.9.5. Financials (Based on Availability)
- 11.2.10 SOPREMA INC
- 11.2.10.1. Overview
- 11.2.10.2. Products
- 11.2.10.3. SWOT Analysis
- 11.2.10.4. Recent Developments
- 11.2.10.5. Financials (Based on Availability)
- 11.2.11 Saint-Gobain Weber
- 11.2.11.1. Overview
- 11.2.11.2. Products
- 11.2.11.3. SWOT Analysis
- 11.2.11.4. Recent Developments
- 11.2.11.5. Financials (Based on Availability)
- 11.2.12 Sika AG*List Not Exhaustive
- 11.2.12.1. Overview
- 11.2.12.2. Products
- 11.2.12.3. SWOT Analysis
- 11.2.12.4. Recent Developments
- 11.2.12.5. Financials (Based on Availability)
- 11.2.1 Carlisle Companies Incorporated
List of Figures
- Figure 1: Global Liquid Applied Membranes Market Revenue Breakdown (Million, %) by Region 2024 & 2032
- Figure 2: Global Liquid Applied Membranes Market Volume Breakdown (Billion, %) by Region 2024 & 2032
- Figure 3: Asia Pacific Liquid Applied Membranes Market Revenue (Million), by Type 2024 & 2032
- Figure 4: Asia Pacific Liquid Applied Membranes Market Volume (Billion), by Type 2024 & 2032
- Figure 5: Asia Pacific Liquid Applied Membranes Market Revenue Share (%), by Type 2024 & 2032
- Figure 6: Asia Pacific Liquid Applied Membranes Market Volume Share (%), by Type 2024 & 2032
- Figure 7: Asia Pacific Liquid Applied Membranes Market Revenue (Million), by Application 2024 & 2032
- Figure 8: Asia Pacific Liquid Applied Membranes Market Volume (Billion), by Application 2024 & 2032
- Figure 9: Asia Pacific Liquid Applied Membranes Market Revenue Share (%), by Application 2024 & 2032
- Figure 10: Asia Pacific Liquid Applied Membranes Market Volume Share (%), by Application 2024 & 2032
- Figure 11: Asia Pacific Liquid Applied Membranes Market Revenue (Million), by Country 2024 & 2032
- Figure 12: Asia Pacific Liquid Applied Membranes Market Volume (Billion), by Country 2024 & 2032
- Figure 13: Asia Pacific Liquid Applied Membranes Market Revenue Share (%), by Country 2024 & 2032
- Figure 14: Asia Pacific Liquid Applied Membranes Market Volume Share (%), by Country 2024 & 2032
- Figure 15: North America Liquid Applied Membranes Market Revenue (Million), by Type 2024 & 2032
- Figure 16: North America Liquid Applied Membranes Market Volume (Billion), by Type 2024 & 2032
- Figure 17: North America Liquid Applied Membranes Market Revenue Share (%), by Type 2024 & 2032
- Figure 18: North America Liquid Applied Membranes Market Volume Share (%), by Type 2024 & 2032
- Figure 19: North America Liquid Applied Membranes Market Revenue (Million), by Application 2024 & 2032
- Figure 20: North America Liquid Applied Membranes Market Volume (Billion), by Application 2024 & 2032
- Figure 21: North America Liquid Applied Membranes Market Revenue Share (%), by Application 2024 & 2032
- Figure 22: North America Liquid Applied Membranes Market Volume Share (%), by Application 2024 & 2032
- Figure 23: North America Liquid Applied Membranes Market Revenue (Million), by Country 2024 & 2032
- Figure 24: North America Liquid Applied Membranes Market Volume (Billion), by Country 2024 & 2032
- Figure 25: North America Liquid Applied Membranes Market Revenue Share (%), by Country 2024 & 2032
- Figure 26: North America Liquid Applied Membranes Market Volume Share (%), by Country 2024 & 2032
- Figure 27: Europe Liquid Applied Membranes Market Revenue (Million), by Type 2024 & 2032
- Figure 28: Europe Liquid Applied Membranes Market Volume (Billion), by Type 2024 & 2032
- Figure 29: Europe Liquid Applied Membranes Market Revenue Share (%), by Type 2024 & 2032
- Figure 30: Europe Liquid Applied Membranes Market Volume Share (%), by Type 2024 & 2032
- Figure 31: Europe Liquid Applied Membranes Market Revenue (Million), by Application 2024 & 2032
- Figure 32: Europe Liquid Applied Membranes Market Volume (Billion), by Application 2024 & 2032
- Figure 33: Europe Liquid Applied Membranes Market Revenue Share (%), by Application 2024 & 2032
- Figure 34: Europe Liquid Applied Membranes Market Volume Share (%), by Application 2024 & 2032
- Figure 35: Europe Liquid Applied Membranes Market Revenue (Million), by Country 2024 & 2032
- Figure 36: Europe Liquid Applied Membranes Market Volume (Billion), by Country 2024 & 2032
- Figure 37: Europe Liquid Applied Membranes Market Revenue Share (%), by Country 2024 & 2032
- Figure 38: Europe Liquid Applied Membranes Market Volume Share (%), by Country 2024 & 2032
- Figure 39: South America Liquid Applied Membranes Market Revenue (Million), by Type 2024 & 2032
- Figure 40: South America Liquid Applied Membranes Market Volume (Billion), by Type 2024 & 2032
- Figure 41: South America Liquid Applied Membranes Market Revenue Share (%), by Type 2024 & 2032
- Figure 42: South America Liquid Applied Membranes Market Volume Share (%), by Type 2024 & 2032
- Figure 43: South America Liquid Applied Membranes Market Revenue (Million), by Application 2024 & 2032
- Figure 44: South America Liquid Applied Membranes Market Volume (Billion), by Application 2024 & 2032
- Figure 45: South America Liquid Applied Membranes Market Revenue Share (%), by Application 2024 & 2032
- Figure 46: South America Liquid Applied Membranes Market Volume Share (%), by Application 2024 & 2032
- Figure 47: South America Liquid Applied Membranes Market Revenue (Million), by Country 2024 & 2032
- Figure 48: South America Liquid Applied Membranes Market Volume (Billion), by Country 2024 & 2032
- Figure 49: South America Liquid Applied Membranes Market Revenue Share (%), by Country 2024 & 2032
- Figure 50: South America Liquid Applied Membranes Market Volume Share (%), by Country 2024 & 2032
- Figure 51: Middle East and Africa Liquid Applied Membranes Market Revenue (Million), by Type 2024 & 2032
- Figure 52: Middle East and Africa Liquid Applied Membranes Market Volume (Billion), by Type 2024 & 2032
- Figure 53: Middle East and Africa Liquid Applied Membranes Market Revenue Share (%), by Type 2024 & 2032
- Figure 54: Middle East and Africa Liquid Applied Membranes Market Volume Share (%), by Type 2024 & 2032
- Figure 55: Middle East and Africa Liquid Applied Membranes Market Revenue (Million), by Application 2024 & 2032
- Figure 56: Middle East and Africa Liquid Applied Membranes Market Volume (Billion), by Application 2024 & 2032
- Figure 57: Middle East and Africa Liquid Applied Membranes Market Revenue Share (%), by Application 2024 & 2032
- Figure 58: Middle East and Africa Liquid Applied Membranes Market Volume Share (%), by Application 2024 & 2032
- Figure 59: Middle East and Africa Liquid Applied Membranes Market Revenue (Million), by Country 2024 & 2032
- Figure 60: Middle East and Africa Liquid Applied Membranes Market Volume (Billion), by Country 2024 & 2032
- Figure 61: Middle East and Africa Liquid Applied Membranes Market Revenue Share (%), by Country 2024 & 2032
- Figure 62: Middle East and Africa Liquid Applied Membranes Market Volume Share (%), by Country 2024 & 2032
List of Tables
- Table 1: Global Liquid Applied Membranes Market Revenue Million Forecast, by Region 2019 & 2032
- Table 2: Global Liquid Applied Membranes Market Volume Billion Forecast, by Region 2019 & 2032
- Table 3: Global Liquid Applied Membranes Market Revenue Million Forecast, by Type 2019 & 2032
- Table 4: Global Liquid Applied Membranes Market Volume Billion Forecast, by Type 2019 & 2032
- Table 5: Global Liquid Applied Membranes Market Revenue Million Forecast, by Application 2019 & 2032
- Table 6: Global Liquid Applied Membranes Market Volume Billion Forecast, by Application 2019 & 2032
- Table 7: Global Liquid Applied Membranes Market Revenue Million Forecast, by Region 2019 & 2032
- Table 8: Global Liquid Applied Membranes Market Volume Billion Forecast, by Region 2019 & 2032
- Table 9: Global Liquid Applied Membranes Market Revenue Million Forecast, by Type 2019 & 2032
- Table 10: Global Liquid Applied Membranes Market Volume Billion Forecast, by Type 2019 & 2032
- Table 11: Global Liquid Applied Membranes Market Revenue Million Forecast, by Application 2019 & 2032
- Table 12: Global Liquid Applied Membranes Market Volume Billion Forecast, by Application 2019 & 2032
- Table 13: Global Liquid Applied Membranes Market Revenue Million Forecast, by Country 2019 & 2032
- Table 14: Global Liquid Applied Membranes Market Volume Billion Forecast, by Country 2019 & 2032
- Table 15: China Liquid Applied Membranes Market Revenue (Million) Forecast, by Application 2019 & 2032
- Table 16: China Liquid Applied Membranes Market Volume (Billion) Forecast, by Application 2019 & 2032
- Table 17: India Liquid Applied Membranes Market Revenue (Million) Forecast, by Application 2019 & 2032
- Table 18: India Liquid Applied Membranes Market Volume (Billion) Forecast, by Application 2019 & 2032
- Table 19: Japan Liquid Applied Membranes Market Revenue (Million) Forecast, by Application 2019 & 2032
- Table 20: Japan Liquid Applied Membranes Market Volume (Billion) Forecast, by Application 2019 & 2032
- Table 21: South Korea Liquid Applied Membranes Market Revenue (Million) Forecast, by Application 2019 & 2032
- Table 22: South Korea Liquid Applied Membranes Market Volume (Billion) Forecast, by Application 2019 & 2032
- Table 23: ASEAN Countries Liquid Applied Membranes Market Revenue (Million) Forecast, by Application 2019 & 2032
- Table 24: ASEAN Countries Liquid Applied Membranes Market Volume (Billion) Forecast, by Application 2019 & 2032
- Table 25: Rest of Asia Pacific Liquid Applied Membranes Market Revenue (Million) Forecast, by Application 2019 & 2032
- Table 26: Rest of Asia Pacific Liquid Applied Membranes Market Volume (Billion) Forecast, by Application 2019 & 2032
- Table 27: Global Liquid Applied Membranes Market Revenue Million Forecast, by Type 2019 & 2032
- Table 28: Global Liquid Applied Membranes Market Volume Billion Forecast, by Type 2019 & 2032
- Table 29: Global Liquid Applied Membranes Market Revenue Million Forecast, by Application 2019 & 2032
- Table 30: Global Liquid Applied Membranes Market Volume Billion Forecast, by Application 2019 & 2032
- Table 31: Global Liquid Applied Membranes Market Revenue Million Forecast, by Country 2019 & 2032
- Table 32: Global Liquid Applied Membranes Market Volume Billion Forecast, by Country 2019 & 2032
- Table 33: United States Liquid Applied Membranes Market Revenue (Million) Forecast, by Application 2019 & 2032
- Table 34: United States Liquid Applied Membranes Market Volume (Billion) Forecast, by Application 2019 & 2032
- Table 35: Canada Liquid Applied Membranes Market Revenue (Million) Forecast, by Application 2019 & 2032
- Table 36: Canada Liquid Applied Membranes Market Volume (Billion) Forecast, by Application 2019 & 2032
- Table 37: Mexico Liquid Applied Membranes Market Revenue (Million) Forecast, by Application 2019 & 2032
- Table 38: Mexico Liquid Applied Membranes Market Volume (Billion) Forecast, by Application 2019 & 2032
- Table 39: Global Liquid Applied Membranes Market Revenue Million Forecast, by Type 2019 & 2032
- Table 40: Global Liquid Applied Membranes Market Volume Billion Forecast, by Type 2019 & 2032
- Table 41: Global Liquid Applied Membranes Market Revenue Million Forecast, by Application 2019 & 2032
- Table 42: Global Liquid Applied Membranes Market Volume Billion Forecast, by Application 2019 & 2032
- Table 43: Global Liquid Applied Membranes Market Revenue Million Forecast, by Country 2019 & 2032
- Table 44: Global Liquid Applied Membranes Market Volume Billion Forecast, by Country 2019 & 2032
- Table 45: Germany Liquid Applied Membranes Market Revenue (Million) Forecast, by Application 2019 & 2032
- Table 46: Germany Liquid Applied Membranes Market Volume (Billion) Forecast, by Application 2019 & 2032
- Table 47: United Kingdom Liquid Applied Membranes Market Revenue (Million) Forecast, by Application 2019 & 2032
- Table 48: United Kingdom Liquid Applied Membranes Market Volume (Billion) Forecast, by Application 2019 & 2032
- Table 49: Italy Liquid Applied Membranes Market Revenue (Million) Forecast, by Application 2019 & 2032
- Table 50: Italy Liquid Applied Membranes Market Volume (Billion) Forecast, by Application 2019 & 2032
- Table 51: France Liquid Applied Membranes Market Revenue (Million) Forecast, by Application 2019 & 2032
- Table 52: France Liquid Applied Membranes Market Volume (Billion) Forecast, by Application 2019 & 2032
- Table 53: Russia Liquid Applied Membranes Market Revenue (Million) Forecast, by Application 2019 & 2032
- Table 54: Russia Liquid Applied Membranes Market Volume (Billion) Forecast, by Application 2019 & 2032
- Table 55: Rest of Europe Liquid Applied Membranes Market Revenue (Million) Forecast, by Application 2019 & 2032
- Table 56: Rest of Europe Liquid Applied Membranes Market Volume (Billion) Forecast, by Application 2019 & 2032
- Table 57: Global Liquid Applied Membranes Market Revenue Million Forecast, by Type 2019 & 2032
- Table 58: Global Liquid Applied Membranes Market Volume Billion Forecast, by Type 2019 & 2032
- Table 59: Global Liquid Applied Membranes Market Revenue Million Forecast, by Application 2019 & 2032
- Table 60: Global Liquid Applied Membranes Market Volume Billion Forecast, by Application 2019 & 2032
- Table 61: Global Liquid Applied Membranes Market Revenue Million Forecast, by Country 2019 & 2032
- Table 62: Global Liquid Applied Membranes Market Volume Billion Forecast, by Country 2019 & 2032
- Table 63: Brazil Liquid Applied Membranes Market Revenue (Million) Forecast, by Application 2019 & 2032
- Table 64: Brazil Liquid Applied Membranes Market Volume (Billion) Forecast, by Application 2019 & 2032
- Table 65: Argentina Liquid Applied Membranes Market Revenue (Million) Forecast, by Application 2019 & 2032
- Table 66: Argentina Liquid Applied Membranes Market Volume (Billion) Forecast, by Application 2019 & 2032
- Table 67: Rest of South America Liquid Applied Membranes Market Revenue (Million) Forecast, by Application 2019 & 2032
- Table 68: Rest of South America Liquid Applied Membranes Market Volume (Billion) Forecast, by Application 2019 & 2032
- Table 69: Global Liquid Applied Membranes Market Revenue Million Forecast, by Type 2019 & 2032
- Table 70: Global Liquid Applied Membranes Market Volume Billion Forecast, by Type 2019 & 2032
- Table 71: Global Liquid Applied Membranes Market Revenue Million Forecast, by Application 2019 & 2032
- Table 72: Global Liquid Applied Membranes Market Volume Billion Forecast, by Application 2019 & 2032
- Table 73: Global Liquid Applied Membranes Market Revenue Million Forecast, by Country 2019 & 2032
- Table 74: Global Liquid Applied Membranes Market Volume Billion Forecast, by Country 2019 & 2032
- Table 75: Saudi Arabia Liquid Applied Membranes Market Revenue (Million) Forecast, by Application 2019 & 2032
- Table 76: Saudi Arabia Liquid Applied Membranes Market Volume (Billion) Forecast, by Application 2019 & 2032
- Table 77: South Africa Liquid Applied Membranes Market Revenue (Million) Forecast, by Application 2019 & 2032
- Table 78: South Africa Liquid Applied Membranes Market Volume (Billion) Forecast, by Application 2019 & 2032
- Table 79: Rest of Middle East and Africa Liquid Applied Membranes Market Revenue (Million) Forecast, by Application 2019 & 2032
- Table 80: Rest of Middle East and Africa Liquid Applied Membranes Market Volume (Billion) Forecast, by Application 2019 & 2032
Frequently Asked Questions
1. What is the projected Compound Annual Growth Rate (CAGR) of the Liquid Applied Membranes Market?
The projected CAGR is approximately 5.25%.
2. Which companies are prominent players in the Liquid Applied Membranes Market?
Key companies in the market include Carlisle Companies Incorporated, Dow, Fosroc Inc, GAF, GCP Applied Technologies Inc, Henry Company, Johns Manville (A Berkshire Hathaway Company), KEMPER SYSTEM Ltd, MAPEI SpA, SOPREMA INC, Saint-Gobain Weber, Sika AG*List Not Exhaustive.
3. What are the main segments of the Liquid Applied Membranes Market?
The market segments include Type, Application.
4. Can you provide details about the market size?
The market size is estimated to be USD 6.99 Million as of 2022.
5. What are some drivers contributing to market growth?
Growing Usage of Waterproofing Membranes to Maintain Longevity of Buildings; Increasing Benefits of Liquid Applied Membranes Resulting in Cost-effective Construction; Growing Infrastructural and Commercial Projects in Emerging Economies.
6. What are the notable trends driving market growth?
Roofing Application is Expected to Dominate the Market.
7. Are there any restraints impacting market growth?
Growing Usage of Waterproofing Membranes to Maintain Longevity of Buildings; Increasing Benefits of Liquid Applied Membranes Resulting in Cost-effective Construction; Growing Infrastructural and Commercial Projects in Emerging Economies.
8. Can you provide examples of recent developments in the market?
May 2023: Sika AG completed the acquisition of MBCC Group. MBCC Group is a global supplier of construction chemicals.
9. What pricing options are available for accessing the report?
Pricing options include single-user, multi-user, and enterprise licenses priced at USD 4750, USD 5250, and USD 8750 respectively.
10. Is the market size provided in terms of value or volume?
The market size is provided in terms of value, measured in Million and volume, measured in Billion.
11. Are there any specific market keywords associated with the report?
Yes, the market keyword associated with the report is "Liquid Applied Membranes Market," which aids in identifying and referencing the specific market segment covered.
12. How do I determine which pricing option suits my needs best?
The pricing options vary based on user requirements and access needs. Individual users may opt for single-user licenses, while businesses requiring broader access may choose multi-user or enterprise licenses for cost-effective access to the report.
13. Are there any additional resources or data provided in the Liquid Applied Membranes Market report?
While the report offers comprehensive insights, it's advisable to review the specific contents or supplementary materials provided to ascertain if additional resources or data are available.
14. How can I stay updated on further developments or reports in the Liquid Applied Membranes Market?
To stay informed about further developments, trends, and reports in the Liquid Applied Membranes Market, consider subscribing to industry newsletters, following relevant companies and organizations, or regularly checking reputable industry news sources and publications.
Methodology
Step 1 - Identification of Relevant Samples Size from Population Database


Step 2 - Approaches for Defining Global Market Size (Value, Volume* & Price*)

Note*: In applicable scenarios
Step 3 - Data Sources
Primary Research
- Web Analytics
- Survey Reports
- Research Institute
- Latest Research Reports
- Opinion Leaders
Secondary Research
- Annual Reports
- White Paper
- Latest Press Release
- Industry Association
- Paid Database
- Investor Presentations

Step 4 - Data Triangulation
Involves using different sources of information in order to increase the validity of a study
These sources are likely to be stakeholders in a program - participants, other researchers, program staff, other community members, and so on.
Then we put all data in single framework & apply various statistical tools to find out the dynamic on the market.
During the analysis stage, feedback from the stakeholder groups would be compared to determine areas of agreement as well as areas of divergence
