

Key Insights
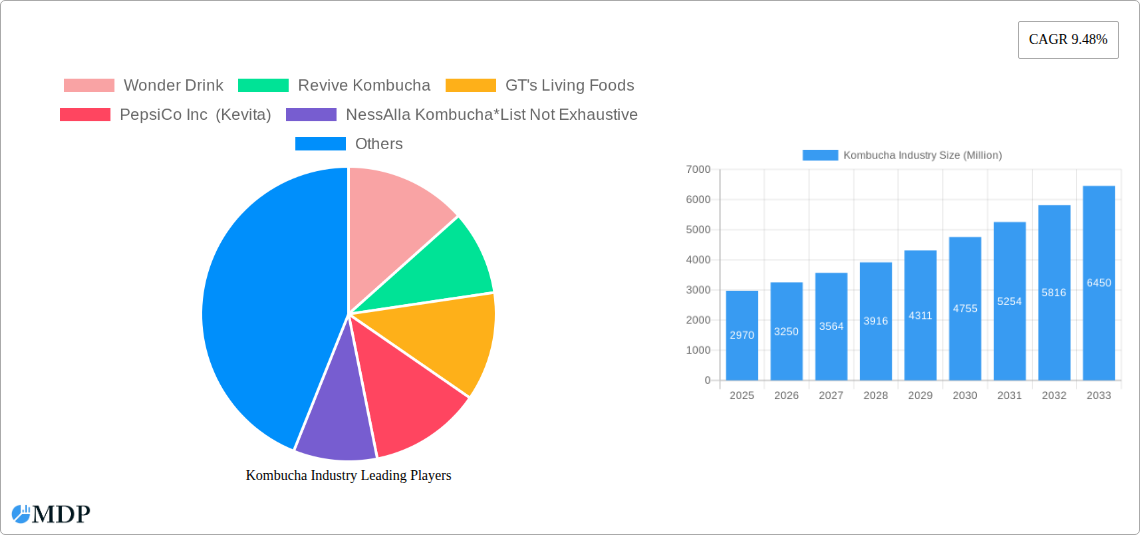
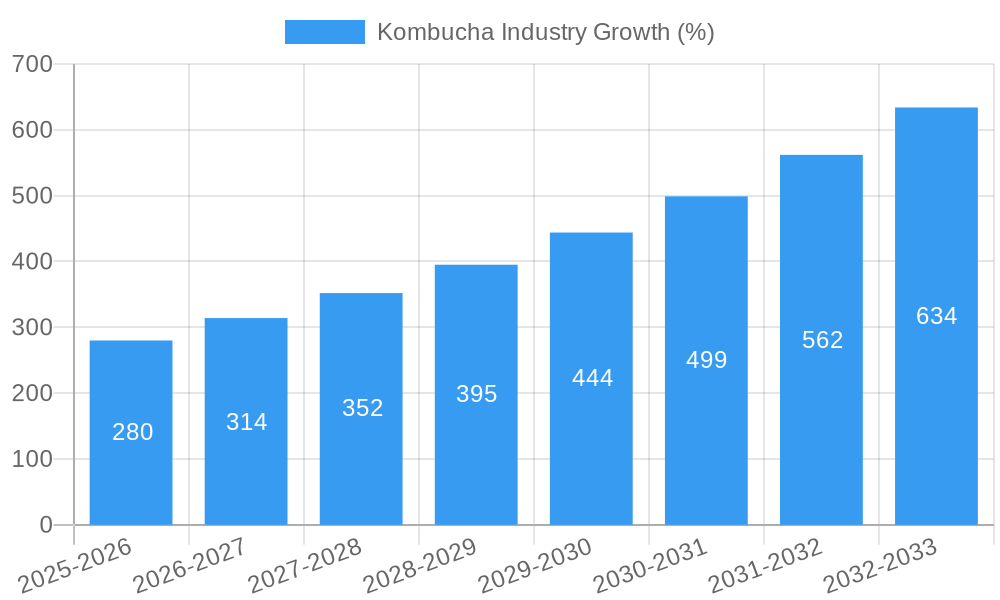
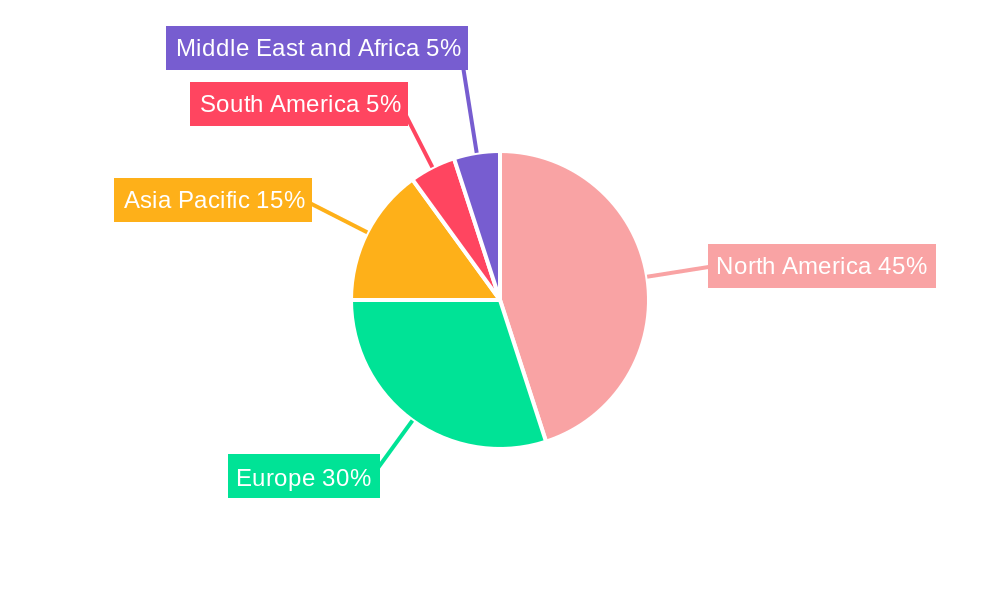
The global kombucha market, valued at $2.97 billion in 2025, is experiencing robust growth, projected to expand at a compound annual growth rate (CAGR) of 9.48% from 2025 to 2033. This significant expansion is fueled by several key drivers. The increasing consumer awareness of health and wellness, coupled with the rising demand for functional beverages with probiotic benefits, significantly boosts kombucha consumption. Furthermore, the expanding distribution channels, encompassing supermarkets, specialty stores, online retailers, and convenience stores, contribute to wider market penetration. The growing popularity of flavored kombucha variants, catering to diverse palates and preferences, also propels market growth. However, the market faces challenges, such as the relatively high price point of kombucha compared to traditional beverages, which can limit accessibility for price-sensitive consumers. Furthermore, inconsistent product quality and concerns about sugar content in some brands present hurdles to overcome. The market segmentation reveals a preference for flavored kombucha over original varieties, indicating successful product diversification. Online retail channels are gaining traction, reflecting the evolving consumer behavior and preference for convenient shopping experiences. Major players like Wonder Drink, GT's Living Foods, and PepsiCo (Kevita) are shaping the market landscape through innovation, brand building, and strategic expansion. Regional analysis indicates strong performance in North America and Europe, driven by high awareness and established consumer bases. The Asia-Pacific region presents substantial growth potential due to rising disposable incomes and changing consumer preferences.
The forecast period (2025-2033) anticipates continued market expansion, driven by product innovation focusing on low-sugar, organic, and unique flavor profiles. The industry is likely to see increased competition, with both established players and new entrants vying for market share. Strategic partnerships, mergers, and acquisitions are expected to reshape the competitive landscape. Brands are likely to focus on enhancing their product lines, improving distribution networks, and strengthening brand messaging to target health-conscious and adventurous consumers. The market's success hinges on addressing the challenges related to pricing, sugar content, and maintaining consistent product quality to ensure sustained growth and consumer trust.
Kombucha Industry Market Report: 2019-2033
This comprehensive report provides an in-depth analysis of the global Kombucha market, offering invaluable insights for industry stakeholders, investors, and businesses seeking to navigate this dynamic sector. With a study period spanning 2019-2033, a base year of 2025, and a forecast period of 2025-2033, this report delivers actionable intelligence for strategic decision-making. The market is valued at $XX Million in 2025 and is projected to reach $XX Million by 2033, exhibiting a CAGR of XX%.
Kombucha Industry Market Dynamics & Concentration
The global kombucha market exhibits a moderately fragmented landscape, with several key players vying for market share. While large corporations like PepsiCo Inc (Kevita) exert significant influence, numerous smaller, independent brands contribute substantially to market dynamism. Market concentration is characterized by a Herfindahl-Hirschman Index (HHI) of XX, indicating a moderately competitive environment. Innovation plays a critical role, with companies continually introducing new flavors, formats, and functional benefits to attract health-conscious consumers. Regulatory frameworks vary across regions, impacting ingredient sourcing, labeling requirements, and production processes. The kombucha market faces competition from other functional beverages, including fermented teas, sparkling water with added benefits, and fruit juices, which all influence consumer choice. Significant M&A activity has been observed in the recent past; xx major mergers and acquisitions were recorded between 2019 and 2024, driven by the expansion of larger players and increasing investor interest in the sector.
- Market Share (2024 Estimates): Wonder Drink (XX%), GT's Living Foods (XX%), PepsiCo Inc (Kevita) (XX%), Others (XX%)
- M&A Deal Count (2019-2024): xx
Kombucha Industry Industry Trends & Analysis
The kombucha market is experiencing robust growth, propelled by several key trends. Increasing consumer awareness of health and wellness is a primary driver, with kombucha’s perceived health benefits, including probiotics and antioxidants, resonating strongly with target demographics. Technological advancements in production processes have enhanced efficiency and scalability, lowering production costs. Consumer preferences are shifting towards organic, natural, and sustainably sourced ingredients, driving innovation in kombucha formulations and packaging. The competitive landscape is characterized by fierce rivalry, with established brands and emerging players introducing innovative products and marketing strategies. Market penetration is steadily increasing, particularly in developed economies where health and wellness awareness is high. The global market demonstrates a compound annual growth rate (CAGR) of XX% during the forecast period.
Leading Markets & Segments in Kombucha Industry
The North American market currently holds the largest share of the global kombucha market due to high consumer adoption and established distribution networks. Within the US, California, New York, and Texas are leading state markets. This dominance can be attributed to several key factors:
- Economic Factors: High disposable income and strong consumer spending power.
- Infrastructure: Well-developed retail infrastructure and robust supply chains.
- Consumer Preferences: High awareness of health and wellness and willingness to embrace new products.
Segment Analysis:
- By Type: The flavored segment dominates the market, driven by the preference for diverse taste profiles. The original/regular segment maintains a substantial market share, catering to consumers seeking a more traditional kombucha experience.
- By Distribution Channel: Supermarkets/Hypermarkets continue to be the most prominent distribution channel due to widespread accessibility, followed by specialist stores catering to health-conscious shoppers. Online retailers are experiencing rapid growth, capitalizing on the increasing popularity of e-commerce.
Kombucha Industry Product Developments
Recent years have witnessed significant product innovations in the kombucha market, emphasizing functional benefits and diverse flavor profiles. Key trends include the incorporation of superfoods, adaptogens, and other functional ingredients to enhance health benefits. Companies are also experimenting with different packaging formats, such as cans and pouches, to improve shelf life and portability. The focus on low-sugar and organic options underscores the importance of aligning with consumer health and wellness demands. The development of instant kombucha further expands accessibility.
Key Drivers of Kombucha Industry Growth
Several factors are driving the remarkable expansion of the kombucha market. The escalating consumer demand for healthy and functional beverages is a significant catalyst, complemented by ongoing improvements in manufacturing techniques resulting in greater efficiency and affordability. Favorable regulatory environments in some regions further support growth. Furthermore, increased investment and funding into kombucha startups are stimulating innovation and expanding the market's reach.
Challenges in the Kombucha Industry Market
The kombucha industry faces several obstacles, including stringent regulatory requirements in certain markets, causing delays in product approvals and escalating production costs. Supply chain complexities, particularly regarding the sourcing of organic and high-quality ingredients, can lead to production disruptions. Intense competition among established brands and emerging players creates pressure to maintain cost-competitiveness and market share, impacting profitability.
Emerging Opportunities in Kombucha Industry
The kombucha industry presents several lucrative opportunities. Technological innovations in brewing and fermentation processes promise to increase efficiency and reduce costs. Strategic partnerships between established beverage companies and emerging kombucha brands can lead to expanded distribution networks and increased market reach. Market expansion into untapped regions, particularly in developing economies with growing health-conscious populations, offers substantial potential.
Leading Players in the Kombucha Industry Sector
- Wonder Drink
- Revive Kombucha
- GT's Living Foods
- PepsiCo Inc (Kevita)
- NessAlla Kombucha
- Brew Dr Kombucha
- Makana Beverages Inc
- Hain Celestial
- Humm Kombucha LLC
- Health-Ade
Key Milestones in Kombucha Industry Industry
- February 2022: Brew Dr. Kombucha launches "Just Peachy," its first peach-flavored kombucha, expanding its product line and tapping into consumer demand for unique flavor profiles.
- February 2022: Superfoods Company introduces an "instant kombucha" formula, offering convenience and accessibility to a broader consumer base.
- March 2021: Health-Ade Kombucha expands its brand with the launch of Health-Ade Mixers, a kombucha-based cocktail line, diversifying its product portfolio and targeting new consumer segments.
Strategic Outlook for Kombucha Industry Market
The future of the kombucha market appears bright, with significant growth potential driven by sustained demand for healthy beverages and continued product innovation. Strategic opportunities abound for companies willing to invest in research and development, explore new distribution channels, and leverage technological advancements to enhance production efficiency and sustainability. Focusing on customized health benefits, unique flavor combinations and sophisticated marketing will be key to success.
Kombucha Industry Segmentation
-
1. Type
- 1.1. Original/Regular
- 1.2. Flavored
-
2. Distribution Channel
- 2.1. Supermarkets/Hypermarkets
- 2.2. Specialist Stores
- 2.3. Convenience Stores
- 2.4. Online Retailers
- 2.5. Other Distribution Channel
Kombucha Industry Segmentation By Geography
-
1. North America
- 1.1. United States
- 1.2. Canada
- 1.3. Mexico
- 1.4. Rest of North America
-
2. Europe
- 2.1. Spain
- 2.2. United Kingdom
- 2.3. Germany
- 2.4. France
- 2.5. Italy
- 2.6. Russia
- 2.7. Rest of Europe
-
3. Asia Pacific
- 3.1. China
- 3.2. Japan
- 3.3. India
- 3.4. Australia
- 3.5. Rest of Asia Pacific
-
4. South America
- 4.1. Brazil
- 4.2. Argentina
- 4.3. Rest of South America
-
5. Middle East and Africa
- 5.1. South Africa
- 5.2. Saudi Arabia
- 5.3. Rest of Middle East and Africa
Kombucha Industry REPORT HIGHLIGHTS
| Aspects | Details |
|---|---|
| Study Period | 2019-2033 |
| Base Year | 2024 |
| Estimated Year | 2025 |
| Forecast Period | 2025-2033 |
| Historical Period | 2019-2024 |
| Growth Rate | CAGR of 9.48% from 2019-2033 |
| Segmentation |
|
Table of Contents
- 1. Introduction
- 1.1. Research Scope
- 1.2. Market Segmentation
- 1.3. Research Methodology
- 1.4. Definitions and Assumptions
- 2. Executive Summary
- 2.1. Introduction
- 3. Market Dynamics
- 3.1. Introduction
- 3.2. Market Drivers
- 3.2.1. Increasing application of Gelatin in healthcare and pharmaceutical sector
- 3.3. Market Restrains
- 3.3.1. Rising demand for clean label products
- 3.4. Market Trends
- 3.4.1. Rising Health Awareness Among Consumers
- 4. Market Factor Analysis
- 4.1. Porters Five Forces
- 4.2. Supply/Value Chain
- 4.3. PESTEL analysis
- 4.4. Market Entropy
- 4.5. Patent/Trademark Analysis
- 5. Global Kombucha Industry Analysis, Insights and Forecast, 2019-2031
- 5.1. Market Analysis, Insights and Forecast - by Type
- 5.1.1. Original/Regular
- 5.1.2. Flavored
- 5.2. Market Analysis, Insights and Forecast - by Distribution Channel
- 5.2.1. Supermarkets/Hypermarkets
- 5.2.2. Specialist Stores
- 5.2.3. Convenience Stores
- 5.2.4. Online Retailers
- 5.2.5. Other Distribution Channel
- 5.3. Market Analysis, Insights and Forecast - by Region
- 5.3.1. North America
- 5.3.2. Europe
- 5.3.3. Asia Pacific
- 5.3.4. South America
- 5.3.5. Middle East and Africa
- 5.1. Market Analysis, Insights and Forecast - by Type
- 6. North America Kombucha Industry Analysis, Insights and Forecast, 2019-2031
- 6.1. Market Analysis, Insights and Forecast - by Type
- 6.1.1. Original/Regular
- 6.1.2. Flavored
- 6.2. Market Analysis, Insights and Forecast - by Distribution Channel
- 6.2.1. Supermarkets/Hypermarkets
- 6.2.2. Specialist Stores
- 6.2.3. Convenience Stores
- 6.2.4. Online Retailers
- 6.2.5. Other Distribution Channel
- 6.1. Market Analysis, Insights and Forecast - by Type
- 7. Europe Kombucha Industry Analysis, Insights and Forecast, 2019-2031
- 7.1. Market Analysis, Insights and Forecast - by Type
- 7.1.1. Original/Regular
- 7.1.2. Flavored
- 7.2. Market Analysis, Insights and Forecast - by Distribution Channel
- 7.2.1. Supermarkets/Hypermarkets
- 7.2.2. Specialist Stores
- 7.2.3. Convenience Stores
- 7.2.4. Online Retailers
- 7.2.5. Other Distribution Channel
- 7.1. Market Analysis, Insights and Forecast - by Type
- 8. Asia Pacific Kombucha Industry Analysis, Insights and Forecast, 2019-2031
- 8.1. Market Analysis, Insights and Forecast - by Type
- 8.1.1. Original/Regular
- 8.1.2. Flavored
- 8.2. Market Analysis, Insights and Forecast - by Distribution Channel
- 8.2.1. Supermarkets/Hypermarkets
- 8.2.2. Specialist Stores
- 8.2.3. Convenience Stores
- 8.2.4. Online Retailers
- 8.2.5. Other Distribution Channel
- 8.1. Market Analysis, Insights and Forecast - by Type
- 9. South America Kombucha Industry Analysis, Insights and Forecast, 2019-2031
- 9.1. Market Analysis, Insights and Forecast - by Type
- 9.1.1. Original/Regular
- 9.1.2. Flavored
- 9.2. Market Analysis, Insights and Forecast - by Distribution Channel
- 9.2.1. Supermarkets/Hypermarkets
- 9.2.2. Specialist Stores
- 9.2.3. Convenience Stores
- 9.2.4. Online Retailers
- 9.2.5. Other Distribution Channel
- 9.1. Market Analysis, Insights and Forecast - by Type
- 10. Middle East and Africa Kombucha Industry Analysis, Insights and Forecast, 2019-2031
- 10.1. Market Analysis, Insights and Forecast - by Type
- 10.1.1. Original/Regular
- 10.1.2. Flavored
- 10.2. Market Analysis, Insights and Forecast - by Distribution Channel
- 10.2.1. Supermarkets/Hypermarkets
- 10.2.2. Specialist Stores
- 10.2.3. Convenience Stores
- 10.2.4. Online Retailers
- 10.2.5. Other Distribution Channel
- 10.1. Market Analysis, Insights and Forecast - by Type
- 11. North America Kombucha Industry Analysis, Insights and Forecast, 2019-2031
- 11.1. Market Analysis, Insights and Forecast - By Country/Sub-region
- 11.1.1 United States
- 11.1.2 Canada
- 11.1.3 Mexico
- 11.1.4 Rest of North America
- 12. Europe Kombucha Industry Analysis, Insights and Forecast, 2019-2031
- 12.1. Market Analysis, Insights and Forecast - By Country/Sub-region
- 12.1.1 Spain
- 12.1.2 United Kingdom
- 12.1.3 Germany
- 12.1.4 France
- 12.1.5 Italy
- 12.1.6 Russia
- 12.1.7 Rest of Europe
- 13. Asia Pacific Kombucha Industry Analysis, Insights and Forecast, 2019-2031
- 13.1. Market Analysis, Insights and Forecast - By Country/Sub-region
- 13.1.1 China
- 13.1.2 Japan
- 13.1.3 India
- 13.1.4 Australia
- 13.1.5 Rest of Asia Pacific
- 14. South America Kombucha Industry Analysis, Insights and Forecast, 2019-2031
- 14.1. Market Analysis, Insights and Forecast - By Country/Sub-region
- 14.1.1 Brazil
- 14.1.2 Argentina
- 14.1.3 Rest of South America
- 15. Middle East and Africa Kombucha Industry Analysis, Insights and Forecast, 2019-2031
- 15.1. Market Analysis, Insights and Forecast - By Country/Sub-region
- 15.1.1 South Africa
- 15.1.2 Saudi Arabia
- 15.1.3 Rest of Middle East and Africa
- 16. Competitive Analysis
- 16.1. Global Market Share Analysis 2024
- 16.2. Company Profiles
- 16.2.1 Wonder Drink
- 16.2.1.1. Overview
- 16.2.1.2. Products
- 16.2.1.3. SWOT Analysis
- 16.2.1.4. Recent Developments
- 16.2.1.5. Financials (Based on Availability)
- 16.2.2 Revive Kombucha
- 16.2.2.1. Overview
- 16.2.2.2. Products
- 16.2.2.3. SWOT Analysis
- 16.2.2.4. Recent Developments
- 16.2.2.5. Financials (Based on Availability)
- 16.2.3 GT's Living Foods
- 16.2.3.1. Overview
- 16.2.3.2. Products
- 16.2.3.3. SWOT Analysis
- 16.2.3.4. Recent Developments
- 16.2.3.5. Financials (Based on Availability)
- 16.2.4 PepsiCo Inc (Kevita)
- 16.2.4.1. Overview
- 16.2.4.2. Products
- 16.2.4.3. SWOT Analysis
- 16.2.4.4. Recent Developments
- 16.2.4.5. Financials (Based on Availability)
- 16.2.5 NessAlla Kombucha*List Not Exhaustive
- 16.2.5.1. Overview
- 16.2.5.2. Products
- 16.2.5.3. SWOT Analysis
- 16.2.5.4. Recent Developments
- 16.2.5.5. Financials (Based on Availability)
- 16.2.6 Brew Dr Kombucha
- 16.2.6.1. Overview
- 16.2.6.2. Products
- 16.2.6.3. SWOT Analysis
- 16.2.6.4. Recent Developments
- 16.2.6.5. Financials (Based on Availability)
- 16.2.7 Makana Beverages Inc
- 16.2.7.1. Overview
- 16.2.7.2. Products
- 16.2.7.3. SWOT Analysis
- 16.2.7.4. Recent Developments
- 16.2.7.5. Financials (Based on Availability)
- 16.2.8 Hain Celestial
- 16.2.8.1. Overview
- 16.2.8.2. Products
- 16.2.8.3. SWOT Analysis
- 16.2.8.4. Recent Developments
- 16.2.8.5. Financials (Based on Availability)
- 16.2.9 Humm Kombucha LLC
- 16.2.9.1. Overview
- 16.2.9.2. Products
- 16.2.9.3. SWOT Analysis
- 16.2.9.4. Recent Developments
- 16.2.9.5. Financials (Based on Availability)
- 16.2.10 Health-Ade
- 16.2.10.1. Overview
- 16.2.10.2. Products
- 16.2.10.3. SWOT Analysis
- 16.2.10.4. Recent Developments
- 16.2.10.5. Financials (Based on Availability)
- 16.2.1 Wonder Drink
List of Figures
- Figure 1: Global Kombucha Industry Revenue Breakdown (Million, %) by Region 2024 & 2032
- Figure 2: North America Kombucha Industry Revenue (Million), by Country 2024 & 2032
- Figure 3: North America Kombucha Industry Revenue Share (%), by Country 2024 & 2032
- Figure 4: Europe Kombucha Industry Revenue (Million), by Country 2024 & 2032
- Figure 5: Europe Kombucha Industry Revenue Share (%), by Country 2024 & 2032
- Figure 6: Asia Pacific Kombucha Industry Revenue (Million), by Country 2024 & 2032
- Figure 7: Asia Pacific Kombucha Industry Revenue Share (%), by Country 2024 & 2032
- Figure 8: South America Kombucha Industry Revenue (Million), by Country 2024 & 2032
- Figure 9: South America Kombucha Industry Revenue Share (%), by Country 2024 & 2032
- Figure 10: Middle East and Africa Kombucha Industry Revenue (Million), by Country 2024 & 2032
- Figure 11: Middle East and Africa Kombucha Industry Revenue Share (%), by Country 2024 & 2032
- Figure 12: North America Kombucha Industry Revenue (Million), by Type 2024 & 2032
- Figure 13: North America Kombucha Industry Revenue Share (%), by Type 2024 & 2032
- Figure 14: North America Kombucha Industry Revenue (Million), by Distribution Channel 2024 & 2032
- Figure 15: North America Kombucha Industry Revenue Share (%), by Distribution Channel 2024 & 2032
- Figure 16: North America Kombucha Industry Revenue (Million), by Country 2024 & 2032
- Figure 17: North America Kombucha Industry Revenue Share (%), by Country 2024 & 2032
- Figure 18: Europe Kombucha Industry Revenue (Million), by Type 2024 & 2032
- Figure 19: Europe Kombucha Industry Revenue Share (%), by Type 2024 & 2032
- Figure 20: Europe Kombucha Industry Revenue (Million), by Distribution Channel 2024 & 2032
- Figure 21: Europe Kombucha Industry Revenue Share (%), by Distribution Channel 2024 & 2032
- Figure 22: Europe Kombucha Industry Revenue (Million), by Country 2024 & 2032
- Figure 23: Europe Kombucha Industry Revenue Share (%), by Country 2024 & 2032
- Figure 24: Asia Pacific Kombucha Industry Revenue (Million), by Type 2024 & 2032
- Figure 25: Asia Pacific Kombucha Industry Revenue Share (%), by Type 2024 & 2032
- Figure 26: Asia Pacific Kombucha Industry Revenue (Million), by Distribution Channel 2024 & 2032
- Figure 27: Asia Pacific Kombucha Industry Revenue Share (%), by Distribution Channel 2024 & 2032
- Figure 28: Asia Pacific Kombucha Industry Revenue (Million), by Country 2024 & 2032
- Figure 29: Asia Pacific Kombucha Industry Revenue Share (%), by Country 2024 & 2032
- Figure 30: South America Kombucha Industry Revenue (Million), by Type 2024 & 2032
- Figure 31: South America Kombucha Industry Revenue Share (%), by Type 2024 & 2032
- Figure 32: South America Kombucha Industry Revenue (Million), by Distribution Channel 2024 & 2032
- Figure 33: South America Kombucha Industry Revenue Share (%), by Distribution Channel 2024 & 2032
- Figure 34: South America Kombucha Industry Revenue (Million), by Country 2024 & 2032
- Figure 35: South America Kombucha Industry Revenue Share (%), by Country 2024 & 2032
- Figure 36: Middle East and Africa Kombucha Industry Revenue (Million), by Type 2024 & 2032
- Figure 37: Middle East and Africa Kombucha Industry Revenue Share (%), by Type 2024 & 2032
- Figure 38: Middle East and Africa Kombucha Industry Revenue (Million), by Distribution Channel 2024 & 2032
- Figure 39: Middle East and Africa Kombucha Industry Revenue Share (%), by Distribution Channel 2024 & 2032
- Figure 40: Middle East and Africa Kombucha Industry Revenue (Million), by Country 2024 & 2032
- Figure 41: Middle East and Africa Kombucha Industry Revenue Share (%), by Country 2024 & 2032
List of Tables
- Table 1: Global Kombucha Industry Revenue Million Forecast, by Region 2019 & 2032
- Table 2: Global Kombucha Industry Revenue Million Forecast, by Type 2019 & 2032
- Table 3: Global Kombucha Industry Revenue Million Forecast, by Distribution Channel 2019 & 2032
- Table 4: Global Kombucha Industry Revenue Million Forecast, by Region 2019 & 2032
- Table 5: Global Kombucha Industry Revenue Million Forecast, by Country 2019 & 2032
- Table 6: United States Kombucha Industry Revenue (Million) Forecast, by Application 2019 & 2032
- Table 7: Canada Kombucha Industry Revenue (Million) Forecast, by Application 2019 & 2032
- Table 8: Mexico Kombucha Industry Revenue (Million) Forecast, by Application 2019 & 2032
- Table 9: Rest of North America Kombucha Industry Revenue (Million) Forecast, by Application 2019 & 2032
- Table 10: Global Kombucha Industry Revenue Million Forecast, by Country 2019 & 2032
- Table 11: Spain Kombucha Industry Revenue (Million) Forecast, by Application 2019 & 2032
- Table 12: United Kingdom Kombucha Industry Revenue (Million) Forecast, by Application 2019 & 2032
- Table 13: Germany Kombucha Industry Revenue (Million) Forecast, by Application 2019 & 2032
- Table 14: France Kombucha Industry Revenue (Million) Forecast, by Application 2019 & 2032
- Table 15: Italy Kombucha Industry Revenue (Million) Forecast, by Application 2019 & 2032
- Table 16: Russia Kombucha Industry Revenue (Million) Forecast, by Application 2019 & 2032
- Table 17: Rest of Europe Kombucha Industry Revenue (Million) Forecast, by Application 2019 & 2032
- Table 18: Global Kombucha Industry Revenue Million Forecast, by Country 2019 & 2032
- Table 19: China Kombucha Industry Revenue (Million) Forecast, by Application 2019 & 2032
- Table 20: Japan Kombucha Industry Revenue (Million) Forecast, by Application 2019 & 2032
- Table 21: India Kombucha Industry Revenue (Million) Forecast, by Application 2019 & 2032
- Table 22: Australia Kombucha Industry Revenue (Million) Forecast, by Application 2019 & 2032
- Table 23: Rest of Asia Pacific Kombucha Industry Revenue (Million) Forecast, by Application 2019 & 2032
- Table 24: Global Kombucha Industry Revenue Million Forecast, by Country 2019 & 2032
- Table 25: Brazil Kombucha Industry Revenue (Million) Forecast, by Application 2019 & 2032
- Table 26: Argentina Kombucha Industry Revenue (Million) Forecast, by Application 2019 & 2032
- Table 27: Rest of South America Kombucha Industry Revenue (Million) Forecast, by Application 2019 & 2032
- Table 28: Global Kombucha Industry Revenue Million Forecast, by Country 2019 & 2032
- Table 29: South Africa Kombucha Industry Revenue (Million) Forecast, by Application 2019 & 2032
- Table 30: Saudi Arabia Kombucha Industry Revenue (Million) Forecast, by Application 2019 & 2032
- Table 31: Rest of Middle East and Africa Kombucha Industry Revenue (Million) Forecast, by Application 2019 & 2032
- Table 32: Global Kombucha Industry Revenue Million Forecast, by Type 2019 & 2032
- Table 33: Global Kombucha Industry Revenue Million Forecast, by Distribution Channel 2019 & 2032
- Table 34: Global Kombucha Industry Revenue Million Forecast, by Country 2019 & 2032
- Table 35: United States Kombucha Industry Revenue (Million) Forecast, by Application 2019 & 2032
- Table 36: Canada Kombucha Industry Revenue (Million) Forecast, by Application 2019 & 2032
- Table 37: Mexico Kombucha Industry Revenue (Million) Forecast, by Application 2019 & 2032
- Table 38: Rest of North America Kombucha Industry Revenue (Million) Forecast, by Application 2019 & 2032
- Table 39: Global Kombucha Industry Revenue Million Forecast, by Type 2019 & 2032
- Table 40: Global Kombucha Industry Revenue Million Forecast, by Distribution Channel 2019 & 2032
- Table 41: Global Kombucha Industry Revenue Million Forecast, by Country 2019 & 2032
- Table 42: Spain Kombucha Industry Revenue (Million) Forecast, by Application 2019 & 2032
- Table 43: United Kingdom Kombucha Industry Revenue (Million) Forecast, by Application 2019 & 2032
- Table 44: Germany Kombucha Industry Revenue (Million) Forecast, by Application 2019 & 2032
- Table 45: France Kombucha Industry Revenue (Million) Forecast, by Application 2019 & 2032
- Table 46: Italy Kombucha Industry Revenue (Million) Forecast, by Application 2019 & 2032
- Table 47: Russia Kombucha Industry Revenue (Million) Forecast, by Application 2019 & 2032
- Table 48: Rest of Europe Kombucha Industry Revenue (Million) Forecast, by Application 2019 & 2032
- Table 49: Global Kombucha Industry Revenue Million Forecast, by Type 2019 & 2032
- Table 50: Global Kombucha Industry Revenue Million Forecast, by Distribution Channel 2019 & 2032
- Table 51: Global Kombucha Industry Revenue Million Forecast, by Country 2019 & 2032
- Table 52: China Kombucha Industry Revenue (Million) Forecast, by Application 2019 & 2032
- Table 53: Japan Kombucha Industry Revenue (Million) Forecast, by Application 2019 & 2032
- Table 54: India Kombucha Industry Revenue (Million) Forecast, by Application 2019 & 2032
- Table 55: Australia Kombucha Industry Revenue (Million) Forecast, by Application 2019 & 2032
- Table 56: Rest of Asia Pacific Kombucha Industry Revenue (Million) Forecast, by Application 2019 & 2032
- Table 57: Global Kombucha Industry Revenue Million Forecast, by Type 2019 & 2032
- Table 58: Global Kombucha Industry Revenue Million Forecast, by Distribution Channel 2019 & 2032
- Table 59: Global Kombucha Industry Revenue Million Forecast, by Country 2019 & 2032
- Table 60: Brazil Kombucha Industry Revenue (Million) Forecast, by Application 2019 & 2032
- Table 61: Argentina Kombucha Industry Revenue (Million) Forecast, by Application 2019 & 2032
- Table 62: Rest of South America Kombucha Industry Revenue (Million) Forecast, by Application 2019 & 2032
- Table 63: Global Kombucha Industry Revenue Million Forecast, by Type 2019 & 2032
- Table 64: Global Kombucha Industry Revenue Million Forecast, by Distribution Channel 2019 & 2032
- Table 65: Global Kombucha Industry Revenue Million Forecast, by Country 2019 & 2032
- Table 66: South Africa Kombucha Industry Revenue (Million) Forecast, by Application 2019 & 2032
- Table 67: Saudi Arabia Kombucha Industry Revenue (Million) Forecast, by Application 2019 & 2032
- Table 68: Rest of Middle East and Africa Kombucha Industry Revenue (Million) Forecast, by Application 2019 & 2032
Frequently Asked Questions
1. What is the projected Compound Annual Growth Rate (CAGR) of the Kombucha Industry?
The projected CAGR is approximately 9.48%.
2. Which companies are prominent players in the Kombucha Industry?
Key companies in the market include Wonder Drink, Revive Kombucha, GT's Living Foods, PepsiCo Inc (Kevita), NessAlla Kombucha*List Not Exhaustive, Brew Dr Kombucha, Makana Beverages Inc, Hain Celestial, Humm Kombucha LLC, Health-Ade.
3. What are the main segments of the Kombucha Industry?
The market segments include Type, Distribution Channel.
4. Can you provide details about the market size?
The market size is estimated to be USD 2.97 Million as of 2022.
5. What are some drivers contributing to market growth?
Increasing application of Gelatin in healthcare and pharmaceutical sector.
6. What are the notable trends driving market growth?
Rising Health Awareness Among Consumers.
7. Are there any restraints impacting market growth?
Rising demand for clean label products.
8. Can you provide examples of recent developments in the market?
February 2022: Brew Dr. launched their first-ever peach-flavored kombucha, Just Peachy. It is made with high-quality loose-leaf green tea and then blends in five varieties of organic peaches. The result is a delicious balance of sweet, ripe, and tart flavors, with hints of honey and summer flowers.
9. What pricing options are available for accessing the report?
Pricing options include single-user, multi-user, and enterprise licenses priced at USD 4750, USD 5250, and USD 8750 respectively.
10. Is the market size provided in terms of value or volume?
The market size is provided in terms of value, measured in Million.
11. Are there any specific market keywords associated with the report?
Yes, the market keyword associated with the report is "Kombucha Industry," which aids in identifying and referencing the specific market segment covered.
12. How do I determine which pricing option suits my needs best?
The pricing options vary based on user requirements and access needs. Individual users may opt for single-user licenses, while businesses requiring broader access may choose multi-user or enterprise licenses for cost-effective access to the report.
13. Are there any additional resources or data provided in the Kombucha Industry report?
While the report offers comprehensive insights, it's advisable to review the specific contents or supplementary materials provided to ascertain if additional resources or data are available.
14. How can I stay updated on further developments or reports in the Kombucha Industry?
To stay informed about further developments, trends, and reports in the Kombucha Industry, consider subscribing to industry newsletters, following relevant companies and organizations, or regularly checking reputable industry news sources and publications.
Methodology
Step 1 - Identification of Relevant Samples Size from Population Database


Step 2 - Approaches for Defining Global Market Size (Value, Volume* & Price*)

Note*: In applicable scenarios
Step 3 - Data Sources
Primary Research
- Web Analytics
- Survey Reports
- Research Institute
- Latest Research Reports
- Opinion Leaders
Secondary Research
- Annual Reports
- White Paper
- Latest Press Release
- Industry Association
- Paid Database
- Investor Presentations

Step 4 - Data Triangulation
Involves using different sources of information in order to increase the validity of a study
These sources are likely to be stakeholders in a program - participants, other researchers, program staff, other community members, and so on.
Then we put all data in single framework & apply various statistical tools to find out the dynamic on the market.
During the analysis stage, feedback from the stakeholder groups would be compared to determine areas of agreement as well as areas of divergence
