

Key Insights
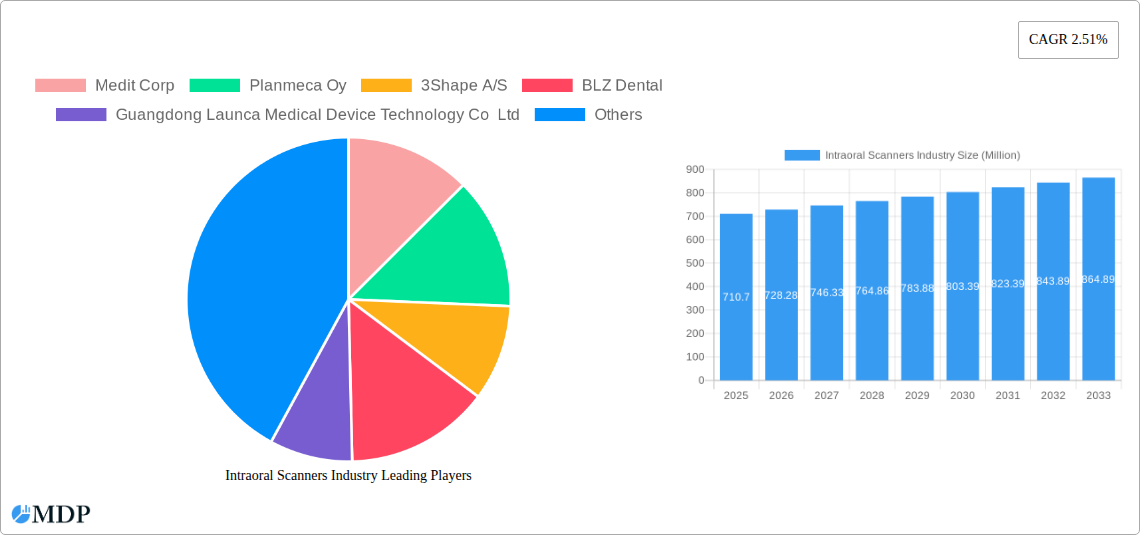
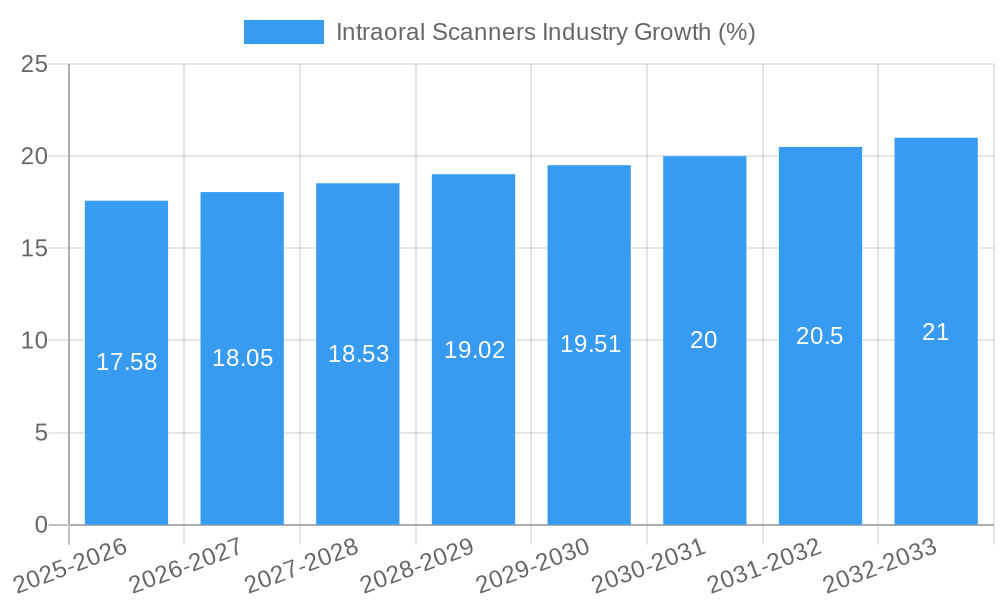
The global intraoral scanner market, valued at $710.70 million in 2025, is projected to experience steady growth, driven by the increasing adoption of digital dentistry and the rising demand for efficient and accurate dental procedures. The market's Compound Annual Growth Rate (CAGR) of 2.51% from 2025 to 2033 indicates a consistent expansion, fueled by technological advancements leading to improved image quality, faster scanning speeds, and enhanced software integration. Key market drivers include the growing preference for minimally invasive procedures, the increasing prevalence of dental diseases, and the expanding geriatric population requiring more sophisticated dental care. The market segmentation reveals a significant contribution from standalone scanners, favored for their accuracy and comprehensive features in dental clinics and hospitals. However, portable scanners are gaining traction due to their flexibility and portability, expanding their use in various settings. Leading companies like Medit Corp, Planmeca Oy, and 3Shape A/S are driving innovation and market competition through continuous product development and strategic partnerships. Geographical analysis shows strong market presence in North America and Europe, driven by higher adoption rates and advanced healthcare infrastructure. However, emerging markets in the Middle East, Africa, and South America present significant growth opportunities as awareness and accessibility improve. The market's growth trajectory is influenced by factors such as increasing costs associated with advanced technology, the need for skilled professionals, and regulatory hurdles related to medical device approvals.
The forecast period (2025-2033) anticipates continued expansion, with a projected market size exceeding $900 million by 2033. This growth will be further shaped by the integration of artificial intelligence and machine learning in intraoral scanning technologies, enabling automated analysis and diagnosis, streamlining the workflow for dental professionals and improving patient care. Furthermore, the increasing focus on chairside CAD/CAM dentistry is expected to boost the demand for intraoral scanners, further driving market growth. The competitive landscape will likely see increased consolidation and strategic partnerships, leading to innovations that enhance efficiency, accuracy, and accessibility of intraoral scanning across diverse healthcare settings.
Intraoral Scanners Industry: Market Report 2019-2033
This comprehensive report provides a detailed analysis of the Intraoral Scanners industry, covering market dynamics, leading players, technological advancements, and future growth prospects. The study period spans from 2019 to 2033, with 2025 as the base and estimated year. The report offers invaluable insights for industry stakeholders, investors, and businesses seeking to navigate this dynamic market. The global Intraoral Scanners market is projected to reach xx Million by 2033, exhibiting a CAGR of xx% during the forecast period (2025-2033).
Intraoral Scanners Industry Market Dynamics & Concentration
The Intraoral Scanners market exhibits a moderately concentrated landscape, with key players such as Medit Corp, Planmeca Oy, and 3Shape A/S holding significant market share. Market concentration is influenced by factors including technological innovation, regulatory frameworks (varying across geographies), and the availability of substitute technologies (e.g., traditional impression taking). The market is characterized by a dynamic interplay of organic growth strategies (product innovation, geographic expansion) and inorganic activities (mergers and acquisitions). Over the historical period (2019-2024), an estimated xx M&A deals were recorded, consolidating market share among leading players. The average market share for the top 5 players is estimated at xx% in 2025. End-user trends, particularly the growing adoption of digital dentistry workflows in dental clinics and hospitals, significantly influence market growth.
- Market Share: Top 3 players hold approximately xx% of the market.
- M&A Activity: xx deals observed between 2019 and 2024, indicating consolidation.
- Regulatory Landscape: Varying regulations across regions impact market entry and expansion strategies.
- Innovation Drivers: Continuous advancements in imaging technology and software integration drive market growth.
Intraoral Scanners Industry Industry Trends & Analysis
The Intraoral Scanners market is experiencing robust growth fueled by several key factors. The increasing adoption of digital dentistry workflows, driven by enhanced accuracy, efficiency, and patient comfort compared to traditional methods, is a primary driver. Technological advancements, such as the development of more compact and user-friendly scanners, coupled with improved software integration for seamless workflow integration, are further boosting market expansion. Consumer preferences are shifting towards minimally invasive and technologically advanced dental procedures, creating a strong demand for intraoral scanners. Furthermore, the competitive landscape is characterized by intense rivalry among established players and emerging companies, leading to continuous innovation and competitive pricing. The market is witnessing a growing penetration of portable scanners, catering to the increasing demand for mobile and flexible solutions. This trend is expected to continue, with portable scanners gaining market share over the coming years. The CAGR for the overall market is projected at xx% during the forecast period.
Leading Markets & Segments in Intraoral Scanners Industry
The North American and European regions currently dominate the Intraoral Scanners market, driven by high healthcare expenditure, advanced technological infrastructure, and a strong adoption of digital dentistry technologies. Within the modality segment, standalone scanners currently hold a larger market share compared to portable scanners, primarily due to superior accuracy and image quality. However, the portable segment is experiencing rapid growth, driven by increasing demand for flexibility and mobility. In terms of end-users, dental clinics represent the largest segment, owing to the widespread adoption of digital workflows within dental practices. Hospitals and other end-users, such as dental laboratories, are also contributing to market growth.
- North America: High adoption of digital dentistry, advanced healthcare infrastructure.
- Europe: Strong regulatory support, significant investment in dental technology.
- Standalone Scanners: Higher accuracy and image quality compared to portable models.
- Dental Clinics: Largest end-user segment due to widespread adoption of digital workflows.
Intraoral Scanners Industry Product Developments
Recent product innovations focus on enhanced accuracy, speed, ease of use, and improved integration with existing dental software platforms. The development of smaller, more portable scanners addresses the need for greater flexibility and mobility. Key competitive advantages stem from superior image quality, faster scanning speeds, user-friendly interfaces, and robust software integration. These advancements are driving greater market penetration and expanding the overall addressable market.
Key Drivers of Intraoral Scanners Industry Growth
Several key factors are driving the growth of the Intraoral Scanners industry. Technological advancements, resulting in smaller, faster, and more accurate scanners, are a primary driver. The increasing prevalence of dental diseases globally is creating a greater demand for advanced diagnostic tools. Government initiatives promoting digital healthcare and favorable reimbursement policies in various regions are further accelerating market expansion. Moreover, strategic partnerships and collaborations between manufacturers and dental clinics are creating synergistic growth opportunities.
Challenges in the Intraoral Scanners Industry Market
Challenges in the Intraoral Scanners market include the high initial investment cost for dental clinics, which can act as a barrier to adoption. Supply chain disruptions and the availability of skilled technicians for scanner maintenance and repair can also affect market growth. Furthermore, intense competition from established players and emerging entrants creates price pressure and impacts profit margins. These factors collectively contribute to slower than expected adoption rates in certain regions.
Emerging Opportunities in Intraoral Scanners Industry
The Intraoral Scanners market presents significant long-term growth opportunities. Continued technological innovation, including the development of AI-powered diagnostic capabilities within scanners, will enhance accuracy and efficiency. Strategic partnerships between scanner manufacturers and dental software providers will drive seamless workflow integration. Market expansion into emerging economies with growing dental care needs will unlock substantial growth potential in the coming years.
Leading Players in the Intraoral Scanners Industry Sector
- Medit Corp
- Planmeca Oy
- 3Shape A/S
- BLZ Dental
- Guangdong Launca Medical Device Technology Co Ltd
- Densys Ltd
- Condor Technologies NV
- Dentsply Sirona Inc
- Align Technology Inc
- Institut Straumann AG
Key Milestones in Intraoral Scanners Industry Industry
- March 2023: Freqty Technology launched the PANDA Smart intra-oral scanner at IDS Germany. This launch highlights the growing trend towards smaller, more portable devices.
- March 2023: GC launched the Aadva IOS 200 intra-oral scanner with 4DR technology at IDS Cologne. This signifies the increasing focus on advanced imaging capabilities.
Strategic Outlook for Intraoral Scanners Industry Market
The Intraoral Scanners market is poised for continued growth, driven by technological innovation, increasing adoption of digital dentistry, and expansion into new markets. Strategic partnerships, product diversification, and investments in R&D will be crucial for success. Companies focusing on user-friendly interfaces, seamless software integration, and superior image quality will capture significant market share. The long-term potential for the market is substantial, particularly with the growing integration of AI and machine learning capabilities within scanners.
Intraoral Scanners Industry Segmentation
-
1. Modality
- 1.1. Standalone
- 1.2. Portable
-
2. End User
- 2.1. Dental Clinics
- 2.2. Hospitals
- 2.3. Other End Users
Intraoral Scanners Industry Segmentation By Geography
-
1. North America
- 1.1. United States
- 1.2. Canada
- 1.3. Mexico
-
2. Europe
- 2.1. Germany
- 2.2. United Kingdom
- 2.3. France
- 2.4. Italy
- 2.5. Spain
- 2.6. Rest of Europe
-
3. Asia Pacific
- 3.1. China
- 3.2. Japan
- 3.3. India
- 3.4. Australia
- 3.5. South Korea
- 3.6. Rest of Asia Pacific
-
4. Middle East and Africa
- 4.1. GCC
- 4.2. South Africa
- 4.3. Rest of Middle East and Africa
-
5. South America
- 5.1. Brazil
- 5.2. Argentina
- 5.3. Rest of South America

Intraoral Scanners Industry REPORT HIGHLIGHTS
| Aspects | Details |
|---|---|
| Study Period | 2019-2033 |
| Base Year | 2024 |
| Estimated Year | 2025 |
| Forecast Period | 2025-2033 |
| Historical Period | 2019-2024 |
| Growth Rate | CAGR of 2.51% from 2019-2033 |
| Segmentation |
|
Table of Contents
- 1. Introduction
- 1.1. Research Scope
- 1.2. Market Segmentation
- 1.3. Research Methodology
- 1.4. Definitions and Assumptions
- 2. Executive Summary
- 2.1. Introduction
- 3. Market Dynamics
- 3.1. Introduction
- 3.2. Market Drivers
- 3.2.1. Rapid Technological Advancements; Increase in Geriatric Population; Rise in Dental Disorders
- 3.3. Market Restrains
- 3.3.1. Lack of Skilled Professionals; High Cost of Intraoral Scanners
- 3.4. Market Trends
- 3.4.1. Standalone Devices Segment is Expected to Witness Strong Growth in The Coming Years
- 4. Market Factor Analysis
- 4.1. Porters Five Forces
- 4.2. Supply/Value Chain
- 4.3. PESTEL analysis
- 4.4. Market Entropy
- 4.5. Patent/Trademark Analysis
- 5. Global Intraoral Scanners Industry Analysis, Insights and Forecast, 2019-2031
- 5.1. Market Analysis, Insights and Forecast - by Modality
- 5.1.1. Standalone
- 5.1.2. Portable
- 5.2. Market Analysis, Insights and Forecast - by End User
- 5.2.1. Dental Clinics
- 5.2.2. Hospitals
- 5.2.3. Other End Users
- 5.3. Market Analysis, Insights and Forecast - by Region
- 5.3.1. North America
- 5.3.2. Europe
- 5.3.3. Asia Pacific
- 5.3.4. Middle East and Africa
- 5.3.5. South America
- 5.1. Market Analysis, Insights and Forecast - by Modality
- 6. North America Intraoral Scanners Industry Analysis, Insights and Forecast, 2019-2031
- 6.1. Market Analysis, Insights and Forecast - by Modality
- 6.1.1. Standalone
- 6.1.2. Portable
- 6.2. Market Analysis, Insights and Forecast - by End User
- 6.2.1. Dental Clinics
- 6.2.2. Hospitals
- 6.2.3. Other End Users
- 6.1. Market Analysis, Insights and Forecast - by Modality
- 7. Europe Intraoral Scanners Industry Analysis, Insights and Forecast, 2019-2031
- 7.1. Market Analysis, Insights and Forecast - by Modality
- 7.1.1. Standalone
- 7.1.2. Portable
- 7.2. Market Analysis, Insights and Forecast - by End User
- 7.2.1. Dental Clinics
- 7.2.2. Hospitals
- 7.2.3. Other End Users
- 7.1. Market Analysis, Insights and Forecast - by Modality
- 8. Asia Pacific Intraoral Scanners Industry Analysis, Insights and Forecast, 2019-2031
- 8.1. Market Analysis, Insights and Forecast - by Modality
- 8.1.1. Standalone
- 8.1.2. Portable
- 8.2. Market Analysis, Insights and Forecast - by End User
- 8.2.1. Dental Clinics
- 8.2.2. Hospitals
- 8.2.3. Other End Users
- 8.1. Market Analysis, Insights and Forecast - by Modality
- 9. Middle East and Africa Intraoral Scanners Industry Analysis, Insights and Forecast, 2019-2031
- 9.1. Market Analysis, Insights and Forecast - by Modality
- 9.1.1. Standalone
- 9.1.2. Portable
- 9.2. Market Analysis, Insights and Forecast - by End User
- 9.2.1. Dental Clinics
- 9.2.2. Hospitals
- 9.2.3. Other End Users
- 9.1. Market Analysis, Insights and Forecast - by Modality
- 10. South America Intraoral Scanners Industry Analysis, Insights and Forecast, 2019-2031
- 10.1. Market Analysis, Insights and Forecast - by Modality
- 10.1.1. Standalone
- 10.1.2. Portable
- 10.2. Market Analysis, Insights and Forecast - by End User
- 10.2.1. Dental Clinics
- 10.2.2. Hospitals
- 10.2.3. Other End Users
- 10.1. Market Analysis, Insights and Forecast - by Modality
- 11. North America Intraoral Scanners Industry Analysis, Insights and Forecast, 2019-2031
- 11.1. Market Analysis, Insights and Forecast - By Country/Sub-region
- 11.1.1. undefined
- 12. Europe Intraoral Scanners Industry Analysis, Insights and Forecast, 2019-2031
- 12.1. Market Analysis, Insights and Forecast - By Country/Sub-region
- 12.1.1. undefined
- 13. Middle East and Africa Intraoral Scanners Industry Analysis, Insights and Forecast, 2019-2031
- 13.1. Market Analysis, Insights and Forecast - By Country/Sub-region
- 13.1.1. undefined
- 14. South America Intraoral Scanners Industry Analysis, Insights and Forecast, 2019-2031
- 14.1. Market Analysis, Insights and Forecast - By Country/Sub-region
- 14.1.1. undefined
- 15. Competitive Analysis
- 15.1. Global Market Share Analysis 2024
- 15.2. Company Profiles
- 15.2.1 Medit Corp
- 15.2.1.1. Overview
- 15.2.1.2. Products
- 15.2.1.3. SWOT Analysis
- 15.2.1.4. Recent Developments
- 15.2.1.5. Financials (Based on Availability)
- 15.2.2 Planmeca Oy
- 15.2.2.1. Overview
- 15.2.2.2. Products
- 15.2.2.3. SWOT Analysis
- 15.2.2.4. Recent Developments
- 15.2.2.5. Financials (Based on Availability)
- 15.2.3 3Shape A/S
- 15.2.3.1. Overview
- 15.2.3.2. Products
- 15.2.3.3. SWOT Analysis
- 15.2.3.4. Recent Developments
- 15.2.3.5. Financials (Based on Availability)
- 15.2.4 BLZ Dental
- 15.2.4.1. Overview
- 15.2.4.2. Products
- 15.2.4.3. SWOT Analysis
- 15.2.4.4. Recent Developments
- 15.2.4.5. Financials (Based on Availability)
- 15.2.5 Guangdong Launca Medical Device Technology Co Ltd
- 15.2.5.1. Overview
- 15.2.5.2. Products
- 15.2.5.3. SWOT Analysis
- 15.2.5.4. Recent Developments
- 15.2.5.5. Financials (Based on Availability)
- 15.2.6 Densys Ltd
- 15.2.6.1. Overview
- 15.2.6.2. Products
- 15.2.6.3. SWOT Analysis
- 15.2.6.4. Recent Developments
- 15.2.6.5. Financials (Based on Availability)
- 15.2.7 Condor Technologies NV
- 15.2.7.1. Overview
- 15.2.7.2. Products
- 15.2.7.3. SWOT Analysis
- 15.2.7.4. Recent Developments
- 15.2.7.5. Financials (Based on Availability)
- 15.2.8 Dentsply Sirona Inc
- 15.2.8.1. Overview
- 15.2.8.2. Products
- 15.2.8.3. SWOT Analysis
- 15.2.8.4. Recent Developments
- 15.2.8.5. Financials (Based on Availability)
- 15.2.9 Align Technology Inc
- 15.2.9.1. Overview
- 15.2.9.2. Products
- 15.2.9.3. SWOT Analysis
- 15.2.9.4. Recent Developments
- 15.2.9.5. Financials (Based on Availability)
- 15.2.10 Institut Straumann AG
- 15.2.10.1. Overview
- 15.2.10.2. Products
- 15.2.10.3. SWOT Analysis
- 15.2.10.4. Recent Developments
- 15.2.10.5. Financials (Based on Availability)
- 15.2.1 Medit Corp
List of Figures
- Figure 1: Global Intraoral Scanners Industry Revenue Breakdown (Million, %) by Region 2024 & 2032
- Figure 2: Global Intraoral Scanners Industry Volume Breakdown (K Unit, %) by Region 2024 & 2032
- Figure 3: North America Intraoral Scanners Industry Revenue (Million), by Country 2024 & 2032
- Figure 4: North America Intraoral Scanners Industry Volume (K Unit), by Country 2024 & 2032
- Figure 5: North America Intraoral Scanners Industry Revenue Share (%), by Country 2024 & 2032
- Figure 6: North America Intraoral Scanners Industry Volume Share (%), by Country 2024 & 2032
- Figure 7: Europe Intraoral Scanners Industry Revenue (Million), by Country 2024 & 2032
- Figure 8: Europe Intraoral Scanners Industry Volume (K Unit), by Country 2024 & 2032
- Figure 9: Europe Intraoral Scanners Industry Revenue Share (%), by Country 2024 & 2032
- Figure 10: Europe Intraoral Scanners Industry Volume Share (%), by Country 2024 & 2032
- Figure 11: Middle East and Africa Intraoral Scanners Industry Revenue (Million), by Country 2024 & 2032
- Figure 12: Middle East and Africa Intraoral Scanners Industry Volume (K Unit), by Country 2024 & 2032
- Figure 13: Middle East and Africa Intraoral Scanners Industry Revenue Share (%), by Country 2024 & 2032
- Figure 14: Middle East and Africa Intraoral Scanners Industry Volume Share (%), by Country 2024 & 2032
- Figure 15: South America Intraoral Scanners Industry Revenue (Million), by Country 2024 & 2032
- Figure 16: South America Intraoral Scanners Industry Volume (K Unit), by Country 2024 & 2032
- Figure 17: South America Intraoral Scanners Industry Revenue Share (%), by Country 2024 & 2032
- Figure 18: South America Intraoral Scanners Industry Volume Share (%), by Country 2024 & 2032
- Figure 19: North America Intraoral Scanners Industry Revenue (Million), by Modality 2024 & 2032
- Figure 20: North America Intraoral Scanners Industry Volume (K Unit), by Modality 2024 & 2032
- Figure 21: North America Intraoral Scanners Industry Revenue Share (%), by Modality 2024 & 2032
- Figure 22: North America Intraoral Scanners Industry Volume Share (%), by Modality 2024 & 2032
- Figure 23: North America Intraoral Scanners Industry Revenue (Million), by End User 2024 & 2032
- Figure 24: North America Intraoral Scanners Industry Volume (K Unit), by End User 2024 & 2032
- Figure 25: North America Intraoral Scanners Industry Revenue Share (%), by End User 2024 & 2032
- Figure 26: North America Intraoral Scanners Industry Volume Share (%), by End User 2024 & 2032
- Figure 27: North America Intraoral Scanners Industry Revenue (Million), by Country 2024 & 2032
- Figure 28: North America Intraoral Scanners Industry Volume (K Unit), by Country 2024 & 2032
- Figure 29: North America Intraoral Scanners Industry Revenue Share (%), by Country 2024 & 2032
- Figure 30: North America Intraoral Scanners Industry Volume Share (%), by Country 2024 & 2032
- Figure 31: Europe Intraoral Scanners Industry Revenue (Million), by Modality 2024 & 2032
- Figure 32: Europe Intraoral Scanners Industry Volume (K Unit), by Modality 2024 & 2032
- Figure 33: Europe Intraoral Scanners Industry Revenue Share (%), by Modality 2024 & 2032
- Figure 34: Europe Intraoral Scanners Industry Volume Share (%), by Modality 2024 & 2032
- Figure 35: Europe Intraoral Scanners Industry Revenue (Million), by End User 2024 & 2032
- Figure 36: Europe Intraoral Scanners Industry Volume (K Unit), by End User 2024 & 2032
- Figure 37: Europe Intraoral Scanners Industry Revenue Share (%), by End User 2024 & 2032
- Figure 38: Europe Intraoral Scanners Industry Volume Share (%), by End User 2024 & 2032
- Figure 39: Europe Intraoral Scanners Industry Revenue (Million), by Country 2024 & 2032
- Figure 40: Europe Intraoral Scanners Industry Volume (K Unit), by Country 2024 & 2032
- Figure 41: Europe Intraoral Scanners Industry Revenue Share (%), by Country 2024 & 2032
- Figure 42: Europe Intraoral Scanners Industry Volume Share (%), by Country 2024 & 2032
- Figure 43: Asia Pacific Intraoral Scanners Industry Revenue (Million), by Modality 2024 & 2032
- Figure 44: Asia Pacific Intraoral Scanners Industry Volume (K Unit), by Modality 2024 & 2032
- Figure 45: Asia Pacific Intraoral Scanners Industry Revenue Share (%), by Modality 2024 & 2032
- Figure 46: Asia Pacific Intraoral Scanners Industry Volume Share (%), by Modality 2024 & 2032
- Figure 47: Asia Pacific Intraoral Scanners Industry Revenue (Million), by End User 2024 & 2032
- Figure 48: Asia Pacific Intraoral Scanners Industry Volume (K Unit), by End User 2024 & 2032
- Figure 49: Asia Pacific Intraoral Scanners Industry Revenue Share (%), by End User 2024 & 2032
- Figure 50: Asia Pacific Intraoral Scanners Industry Volume Share (%), by End User 2024 & 2032
- Figure 51: Asia Pacific Intraoral Scanners Industry Revenue (Million), by Country 2024 & 2032
- Figure 52: Asia Pacific Intraoral Scanners Industry Volume (K Unit), by Country 2024 & 2032
- Figure 53: Asia Pacific Intraoral Scanners Industry Revenue Share (%), by Country 2024 & 2032
- Figure 54: Asia Pacific Intraoral Scanners Industry Volume Share (%), by Country 2024 & 2032
- Figure 55: Middle East and Africa Intraoral Scanners Industry Revenue (Million), by Modality 2024 & 2032
- Figure 56: Middle East and Africa Intraoral Scanners Industry Volume (K Unit), by Modality 2024 & 2032
- Figure 57: Middle East and Africa Intraoral Scanners Industry Revenue Share (%), by Modality 2024 & 2032
- Figure 58: Middle East and Africa Intraoral Scanners Industry Volume Share (%), by Modality 2024 & 2032
- Figure 59: Middle East and Africa Intraoral Scanners Industry Revenue (Million), by End User 2024 & 2032
- Figure 60: Middle East and Africa Intraoral Scanners Industry Volume (K Unit), by End User 2024 & 2032
- Figure 61: Middle East and Africa Intraoral Scanners Industry Revenue Share (%), by End User 2024 & 2032
- Figure 62: Middle East and Africa Intraoral Scanners Industry Volume Share (%), by End User 2024 & 2032
- Figure 63: Middle East and Africa Intraoral Scanners Industry Revenue (Million), by Country 2024 & 2032
- Figure 64: Middle East and Africa Intraoral Scanners Industry Volume (K Unit), by Country 2024 & 2032
- Figure 65: Middle East and Africa Intraoral Scanners Industry Revenue Share (%), by Country 2024 & 2032
- Figure 66: Middle East and Africa Intraoral Scanners Industry Volume Share (%), by Country 2024 & 2032
- Figure 67: South America Intraoral Scanners Industry Revenue (Million), by Modality 2024 & 2032
- Figure 68: South America Intraoral Scanners Industry Volume (K Unit), by Modality 2024 & 2032
- Figure 69: South America Intraoral Scanners Industry Revenue Share (%), by Modality 2024 & 2032
- Figure 70: South America Intraoral Scanners Industry Volume Share (%), by Modality 2024 & 2032
- Figure 71: South America Intraoral Scanners Industry Revenue (Million), by End User 2024 & 2032
- Figure 72: South America Intraoral Scanners Industry Volume (K Unit), by End User 2024 & 2032
- Figure 73: South America Intraoral Scanners Industry Revenue Share (%), by End User 2024 & 2032
- Figure 74: South America Intraoral Scanners Industry Volume Share (%), by End User 2024 & 2032
- Figure 75: South America Intraoral Scanners Industry Revenue (Million), by Country 2024 & 2032
- Figure 76: South America Intraoral Scanners Industry Volume (K Unit), by Country 2024 & 2032
- Figure 77: South America Intraoral Scanners Industry Revenue Share (%), by Country 2024 & 2032
- Figure 78: South America Intraoral Scanners Industry Volume Share (%), by Country 2024 & 2032
List of Tables
- Table 1: Global Intraoral Scanners Industry Revenue Million Forecast, by Region 2019 & 2032
- Table 2: Global Intraoral Scanners Industry Volume K Unit Forecast, by Region 2019 & 2032
- Table 3: Global Intraoral Scanners Industry Revenue Million Forecast, by Modality 2019 & 2032
- Table 4: Global Intraoral Scanners Industry Volume K Unit Forecast, by Modality 2019 & 2032
- Table 5: Global Intraoral Scanners Industry Revenue Million Forecast, by End User 2019 & 2032
- Table 6: Global Intraoral Scanners Industry Volume K Unit Forecast, by End User 2019 & 2032
- Table 7: Global Intraoral Scanners Industry Revenue Million Forecast, by Region 2019 & 2032
- Table 8: Global Intraoral Scanners Industry Volume K Unit Forecast, by Region 2019 & 2032
- Table 9: Global Intraoral Scanners Industry Revenue Million Forecast, by Country 2019 & 2032
- Table 10: Global Intraoral Scanners Industry Volume K Unit Forecast, by Country 2019 & 2032
- Table 11: Global Intraoral Scanners Industry Revenue Million Forecast, by Country 2019 & 2032
- Table 12: Global Intraoral Scanners Industry Volume K Unit Forecast, by Country 2019 & 2032
- Table 13: Global Intraoral Scanners Industry Revenue Million Forecast, by Country 2019 & 2032
- Table 14: Global Intraoral Scanners Industry Volume K Unit Forecast, by Country 2019 & 2032
- Table 15: Global Intraoral Scanners Industry Revenue Million Forecast, by Country 2019 & 2032
- Table 16: Global Intraoral Scanners Industry Volume K Unit Forecast, by Country 2019 & 2032
- Table 17: Global Intraoral Scanners Industry Revenue Million Forecast, by Modality 2019 & 2032
- Table 18: Global Intraoral Scanners Industry Volume K Unit Forecast, by Modality 2019 & 2032
- Table 19: Global Intraoral Scanners Industry Revenue Million Forecast, by End User 2019 & 2032
- Table 20: Global Intraoral Scanners Industry Volume K Unit Forecast, by End User 2019 & 2032
- Table 21: Global Intraoral Scanners Industry Revenue Million Forecast, by Country 2019 & 2032
- Table 22: Global Intraoral Scanners Industry Volume K Unit Forecast, by Country 2019 & 2032
- Table 23: United States Intraoral Scanners Industry Revenue (Million) Forecast, by Application 2019 & 2032
- Table 24: United States Intraoral Scanners Industry Volume (K Unit) Forecast, by Application 2019 & 2032
- Table 25: Canada Intraoral Scanners Industry Revenue (Million) Forecast, by Application 2019 & 2032
- Table 26: Canada Intraoral Scanners Industry Volume (K Unit) Forecast, by Application 2019 & 2032
- Table 27: Mexico Intraoral Scanners Industry Revenue (Million) Forecast, by Application 2019 & 2032
- Table 28: Mexico Intraoral Scanners Industry Volume (K Unit) Forecast, by Application 2019 & 2032
- Table 29: Global Intraoral Scanners Industry Revenue Million Forecast, by Modality 2019 & 2032
- Table 30: Global Intraoral Scanners Industry Volume K Unit Forecast, by Modality 2019 & 2032
- Table 31: Global Intraoral Scanners Industry Revenue Million Forecast, by End User 2019 & 2032
- Table 32: Global Intraoral Scanners Industry Volume K Unit Forecast, by End User 2019 & 2032
- Table 33: Global Intraoral Scanners Industry Revenue Million Forecast, by Country 2019 & 2032
- Table 34: Global Intraoral Scanners Industry Volume K Unit Forecast, by Country 2019 & 2032
- Table 35: Germany Intraoral Scanners Industry Revenue (Million) Forecast, by Application 2019 & 2032
- Table 36: Germany Intraoral Scanners Industry Volume (K Unit) Forecast, by Application 2019 & 2032
- Table 37: United Kingdom Intraoral Scanners Industry Revenue (Million) Forecast, by Application 2019 & 2032
- Table 38: United Kingdom Intraoral Scanners Industry Volume (K Unit) Forecast, by Application 2019 & 2032
- Table 39: France Intraoral Scanners Industry Revenue (Million) Forecast, by Application 2019 & 2032
- Table 40: France Intraoral Scanners Industry Volume (K Unit) Forecast, by Application 2019 & 2032
- Table 41: Italy Intraoral Scanners Industry Revenue (Million) Forecast, by Application 2019 & 2032
- Table 42: Italy Intraoral Scanners Industry Volume (K Unit) Forecast, by Application 2019 & 2032
- Table 43: Spain Intraoral Scanners Industry Revenue (Million) Forecast, by Application 2019 & 2032
- Table 44: Spain Intraoral Scanners Industry Volume (K Unit) Forecast, by Application 2019 & 2032
- Table 45: Rest of Europe Intraoral Scanners Industry Revenue (Million) Forecast, by Application 2019 & 2032
- Table 46: Rest of Europe Intraoral Scanners Industry Volume (K Unit) Forecast, by Application 2019 & 2032
- Table 47: Global Intraoral Scanners Industry Revenue Million Forecast, by Modality 2019 & 2032
- Table 48: Global Intraoral Scanners Industry Volume K Unit Forecast, by Modality 2019 & 2032
- Table 49: Global Intraoral Scanners Industry Revenue Million Forecast, by End User 2019 & 2032
- Table 50: Global Intraoral Scanners Industry Volume K Unit Forecast, by End User 2019 & 2032
- Table 51: Global Intraoral Scanners Industry Revenue Million Forecast, by Country 2019 & 2032
- Table 52: Global Intraoral Scanners Industry Volume K Unit Forecast, by Country 2019 & 2032
- Table 53: China Intraoral Scanners Industry Revenue (Million) Forecast, by Application 2019 & 2032
- Table 54: China Intraoral Scanners Industry Volume (K Unit) Forecast, by Application 2019 & 2032
- Table 55: Japan Intraoral Scanners Industry Revenue (Million) Forecast, by Application 2019 & 2032
- Table 56: Japan Intraoral Scanners Industry Volume (K Unit) Forecast, by Application 2019 & 2032
- Table 57: India Intraoral Scanners Industry Revenue (Million) Forecast, by Application 2019 & 2032
- Table 58: India Intraoral Scanners Industry Volume (K Unit) Forecast, by Application 2019 & 2032
- Table 59: Australia Intraoral Scanners Industry Revenue (Million) Forecast, by Application 2019 & 2032
- Table 60: Australia Intraoral Scanners Industry Volume (K Unit) Forecast, by Application 2019 & 2032
- Table 61: South Korea Intraoral Scanners Industry Revenue (Million) Forecast, by Application 2019 & 2032
- Table 62: South Korea Intraoral Scanners Industry Volume (K Unit) Forecast, by Application 2019 & 2032
- Table 63: Rest of Asia Pacific Intraoral Scanners Industry Revenue (Million) Forecast, by Application 2019 & 2032
- Table 64: Rest of Asia Pacific Intraoral Scanners Industry Volume (K Unit) Forecast, by Application 2019 & 2032
- Table 65: Global Intraoral Scanners Industry Revenue Million Forecast, by Modality 2019 & 2032
- Table 66: Global Intraoral Scanners Industry Volume K Unit Forecast, by Modality 2019 & 2032
- Table 67: Global Intraoral Scanners Industry Revenue Million Forecast, by End User 2019 & 2032
- Table 68: Global Intraoral Scanners Industry Volume K Unit Forecast, by End User 2019 & 2032
- Table 69: Global Intraoral Scanners Industry Revenue Million Forecast, by Country 2019 & 2032
- Table 70: Global Intraoral Scanners Industry Volume K Unit Forecast, by Country 2019 & 2032
- Table 71: GCC Intraoral Scanners Industry Revenue (Million) Forecast, by Application 2019 & 2032
- Table 72: GCC Intraoral Scanners Industry Volume (K Unit) Forecast, by Application 2019 & 2032
- Table 73: South Africa Intraoral Scanners Industry Revenue (Million) Forecast, by Application 2019 & 2032
- Table 74: South Africa Intraoral Scanners Industry Volume (K Unit) Forecast, by Application 2019 & 2032
- Table 75: Rest of Middle East and Africa Intraoral Scanners Industry Revenue (Million) Forecast, by Application 2019 & 2032
- Table 76: Rest of Middle East and Africa Intraoral Scanners Industry Volume (K Unit) Forecast, by Application 2019 & 2032
- Table 77: Global Intraoral Scanners Industry Revenue Million Forecast, by Modality 2019 & 2032
- Table 78: Global Intraoral Scanners Industry Volume K Unit Forecast, by Modality 2019 & 2032
- Table 79: Global Intraoral Scanners Industry Revenue Million Forecast, by End User 2019 & 2032
- Table 80: Global Intraoral Scanners Industry Volume K Unit Forecast, by End User 2019 & 2032
- Table 81: Global Intraoral Scanners Industry Revenue Million Forecast, by Country 2019 & 2032
- Table 82: Global Intraoral Scanners Industry Volume K Unit Forecast, by Country 2019 & 2032
- Table 83: Brazil Intraoral Scanners Industry Revenue (Million) Forecast, by Application 2019 & 2032
- Table 84: Brazil Intraoral Scanners Industry Volume (K Unit) Forecast, by Application 2019 & 2032
- Table 85: Argentina Intraoral Scanners Industry Revenue (Million) Forecast, by Application 2019 & 2032
- Table 86: Argentina Intraoral Scanners Industry Volume (K Unit) Forecast, by Application 2019 & 2032
- Table 87: Rest of South America Intraoral Scanners Industry Revenue (Million) Forecast, by Application 2019 & 2032
- Table 88: Rest of South America Intraoral Scanners Industry Volume (K Unit) Forecast, by Application 2019 & 2032
Frequently Asked Questions
1. What is the projected Compound Annual Growth Rate (CAGR) of the Intraoral Scanners Industry?
The projected CAGR is approximately 2.51%.
2. Which companies are prominent players in the Intraoral Scanners Industry?
Key companies in the market include Medit Corp, Planmeca Oy, 3Shape A/S, BLZ Dental, Guangdong Launca Medical Device Technology Co Ltd, Densys Ltd, Condor Technologies NV, Dentsply Sirona Inc, Align Technology Inc, Institut Straumann AG.
3. What are the main segments of the Intraoral Scanners Industry?
The market segments include Modality, End User.
4. Can you provide details about the market size?
The market size is estimated to be USD 710.70 Million as of 2022.
5. What are some drivers contributing to market growth?
Rapid Technological Advancements; Increase in Geriatric Population; Rise in Dental Disorders.
6. What are the notable trends driving market growth?
Standalone Devices Segment is Expected to Witness Strong Growth in The Coming Years.
7. Are there any restraints impacting market growth?
Lack of Skilled Professionals; High Cost of Intraoral Scanners.
8. Can you provide examples of recent developments in the market?
March 2023: Freqty Technology, a Chinese high-tech enterprise in the field of digital dentistry, launched the latest and smallest PANDA intra-oral scanner, the PANDA Smart, at the International Dental Show (IDS) in Germany in 2023.
9. What pricing options are available for accessing the report?
Pricing options include single-user, multi-user, and enterprise licenses priced at USD 4750, USD 5250, and USD 8750 respectively.
10. Is the market size provided in terms of value or volume?
The market size is provided in terms of value, measured in Million and volume, measured in K Unit.
11. Are there any specific market keywords associated with the report?
Yes, the market keyword associated with the report is "Intraoral Scanners Industry," which aids in identifying and referencing the specific market segment covered.
12. How do I determine which pricing option suits my needs best?
The pricing options vary based on user requirements and access needs. Individual users may opt for single-user licenses, while businesses requiring broader access may choose multi-user or enterprise licenses for cost-effective access to the report.
13. Are there any additional resources or data provided in the Intraoral Scanners Industry report?
While the report offers comprehensive insights, it's advisable to review the specific contents or supplementary materials provided to ascertain if additional resources or data are available.
14. How can I stay updated on further developments or reports in the Intraoral Scanners Industry?
To stay informed about further developments, trends, and reports in the Intraoral Scanners Industry, consider subscribing to industry newsletters, following relevant companies and organizations, or regularly checking reputable industry news sources and publications.
Methodology
Step 1 - Identification of Relevant Samples Size from Population Database


Step 2 - Approaches for Defining Global Market Size (Value, Volume* & Price*)

Note*: In applicable scenarios
Step 3 - Data Sources
Primary Research
- Web Analytics
- Survey Reports
- Research Institute
- Latest Research Reports
- Opinion Leaders
Secondary Research
- Annual Reports
- White Paper
- Latest Press Release
- Industry Association
- Paid Database
- Investor Presentations

Step 4 - Data Triangulation
Involves using different sources of information in order to increase the validity of a study
These sources are likely to be stakeholders in a program - participants, other researchers, program staff, other community members, and so on.
Then we put all data in single framework & apply various statistical tools to find out the dynamic on the market.
During the analysis stage, feedback from the stakeholder groups would be compared to determine areas of agreement as well as areas of divergence
