

Key Insights
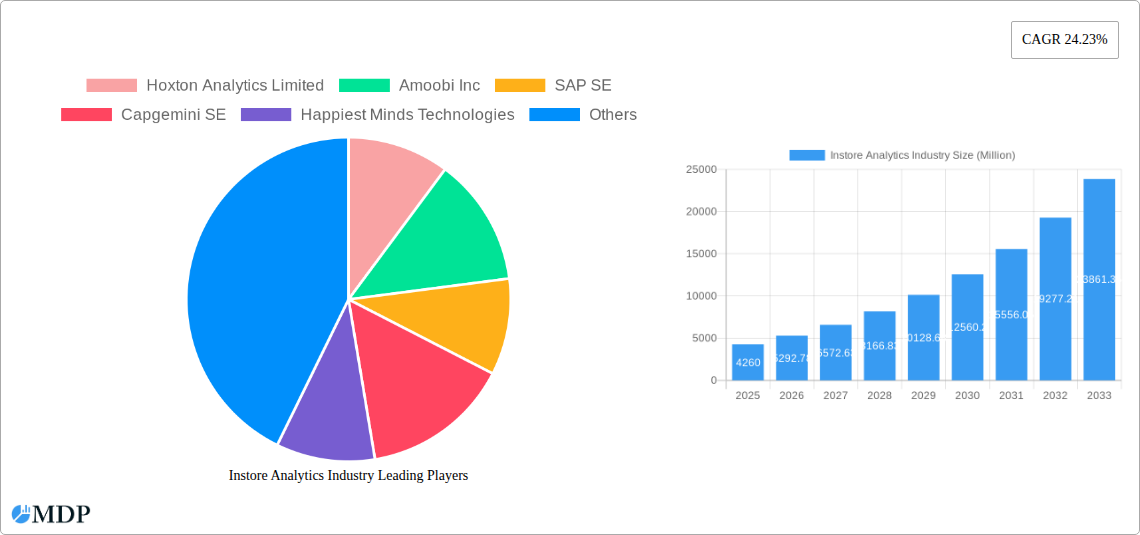
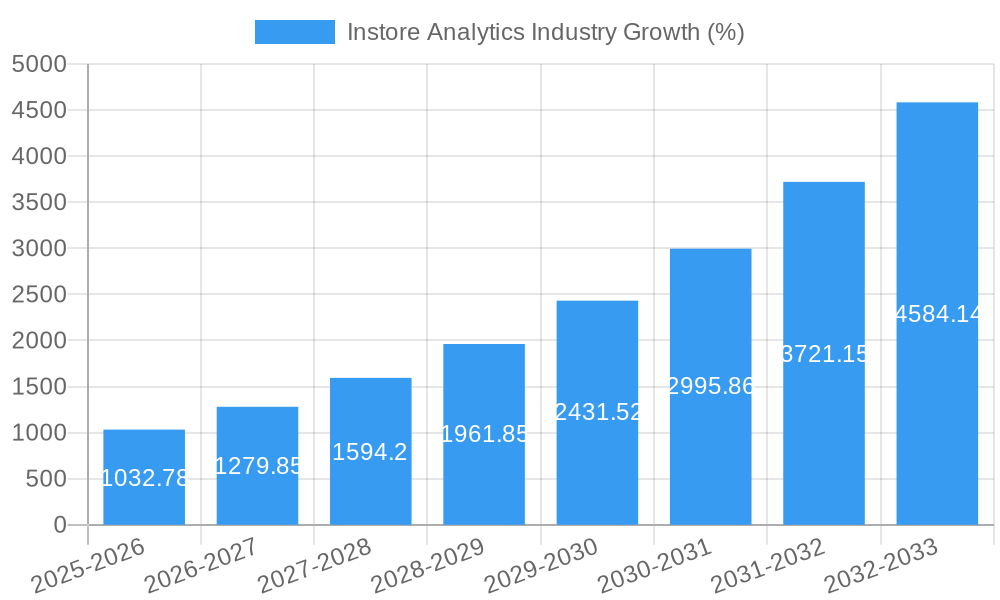
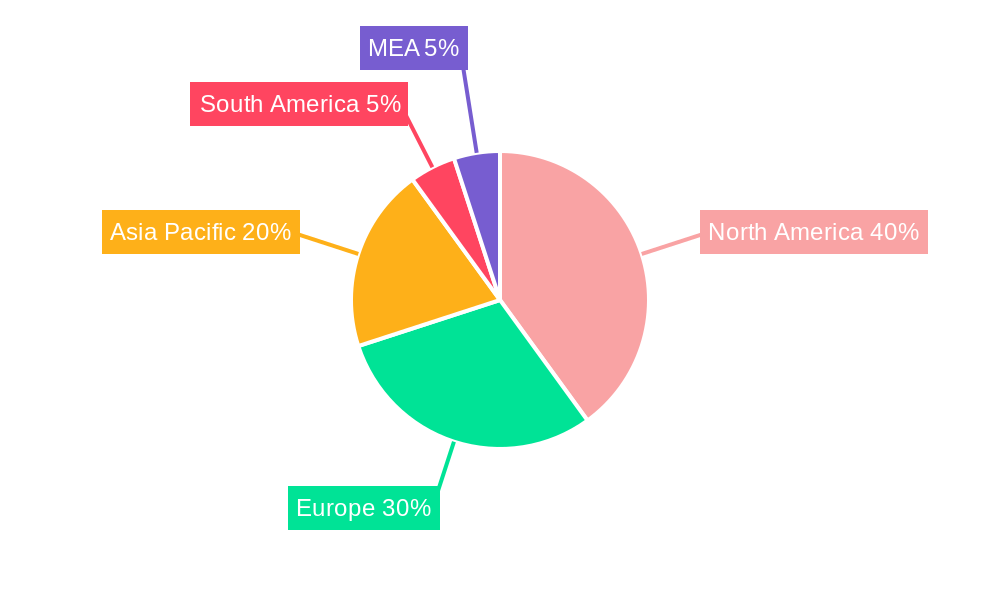
The Instore Analytics market is experiencing robust growth, projected to reach \$4.26 billion in 2025 and exhibiting a Compound Annual Growth Rate (CAGR) of 24.23% from 2025 to 2033. This expansion is fueled by several key drivers. Retailers are increasingly leveraging data-driven insights to optimize store operations, personalize customer experiences, and enhance overall profitability. The shift towards cloud-based solutions offers scalability and cost-effectiveness, further accelerating market adoption. Advancements in technologies like computer vision, AI, and IoT are enabling more sophisticated analytics, providing granular insights into shopper behavior, product placement effectiveness, and operational inefficiencies. Growing competition and the need for enhanced customer engagement are also compelling retailers to invest in instore analytics solutions. While data security concerns and the initial investment costs associated with implementation can pose challenges, the substantial return on investment (ROI) and the competitive advantage gained through data-driven decision-making are overriding these restraints. Segmentation reveals a strong preference for cloud deployment and significant demand from large enterprises, reflecting their greater capacity for technology investment and data management. Customer management and risk & compliance applications currently dominate, but growth is expected across all application segments as retailers seek comprehensive solutions. The geographic distribution showcases strong performance in North America and Europe, fueled by high levels of digitalization and strong retail sectors. However, Asia-Pacific presents significant future growth potential due to its rapidly expanding retail landscape and increasing adoption of advanced technologies.
The market's continued growth trajectory is expected to be driven by several factors. The rising adoption of omnichannel strategies will require more sophisticated analytics to integrate online and offline data for a unified view of the customer journey. Furthermore, the increasing focus on sustainability and supply chain optimization will necessitate more granular data analysis to minimize waste and improve efficiency. The emergence of new technologies, like augmented reality (AR) and virtual reality (VR) in retail, will create new opportunities for instore analytics to enhance the shopper experience and provide retailers with valuable insights into how customers interact with these technologies. Competitive pressures will also continue to drive innovation and investment in the instore analytics market, leading to more advanced and user-friendly solutions. Finally, regulations related to data privacy and security will influence the development and adoption of solutions that ensure responsible data handling and compliance.
Instore Analytics Industry Report: A Comprehensive Market Analysis (2019-2033)
This comprehensive report provides an in-depth analysis of the Instore Analytics industry, projecting a market value of $XX Million by 2033. The study covers the period from 2019 to 2033, with a base year of 2025 and a forecast period of 2025-2033. Leverage this detailed analysis to gain actionable insights, understand market dynamics, and make informed strategic decisions.
Instore Analytics Industry Market Dynamics & Concentration
The Instore Analytics market is characterized by moderate concentration, with several key players vying for market share. The market size reached $XX Million in 2024 and is poised for significant growth driven by increasing adoption of advanced technologies in retail. Innovation is a key driver, with companies constantly developing new solutions to enhance customer experience, optimize operations, and improve risk management. Regulatory frameworks, particularly concerning data privacy and security, are shaping the competitive landscape. Product substitutes, such as traditional market research methods, are facing increasing competition from the advanced data-driven capabilities of instore analytics. End-user trends towards personalized experiences and data-driven decision-making further fuel market growth. Mergers and acquisitions (M&A) activity is relatively high, with XX major deals recorded in the last five years, indicating a trend towards consolidation within the sector. Market share distribution is as follows (estimated 2025):
- Top 3 Players: XX% combined market share
- Next 7 Players: XX% combined market share
- Remaining Players: XX% combined market share
Instore Analytics Industry Industry Trends & Analysis
The Instore Analytics market exhibits a robust Compound Annual Growth Rate (CAGR) of XX% during the forecast period (2025-2033). This growth is propelled by several key factors:
- Technological Disruptions: The increasing adoption of Artificial Intelligence (AI), Machine Learning (ML), and Internet of Things (IoT) technologies is revolutionizing data collection and analysis, leading to more sophisticated and actionable insights.
- Evolving Consumer Preferences: Consumers demand personalized experiences and seamless shopping journeys, increasing the demand for instore analytics solutions that can deliver on these expectations.
- Competitive Dynamics: The market is highly competitive, with both established players and new entrants continually innovating to offer superior solutions and capture market share.
- Market Penetration: The market penetration rate is currently at XX% and is expected to reach XX% by 2033, indicating significant untapped potential.
Leading Markets & Segments in Instore Analytics Industry
The North American market currently dominates the global Instore Analytics landscape, driven by strong technological adoption and a mature retail sector. However, significant growth opportunities exist in the Asia-Pacific region.
Segment Dominance:
- By Component: Software holds the largest market share, followed by Services. This is due to the increasing demand for advanced software solutions capable of handling complex data analysis tasks.
- By Deployment: Cloud deployment is rapidly gaining traction, surpassing On-Premises due to its scalability, cost-effectiveness, and accessibility.
- By Organization Size: Large Enterprises currently dominate the market due to their higher budgets and greater need for comprehensive analytics solutions. However, the SME segment is showing promising growth potential.
- By Application: Customer Management is the leading application segment, driven by the need for personalized customer experiences and targeted marketing campaigns. Store Operations Management is also a significant segment, as retailers strive to optimize store layouts, staffing, and inventory management.
Key Drivers:
- Favorable Economic Policies: Government initiatives supporting digital transformation and technological advancements are fueling market growth in various regions.
- Robust Retail Infrastructure: Well-developed retail infrastructure in regions like North America and Europe supports the seamless integration and adoption of instore analytics solutions.
Instore Analytics Industry Product Developments
Recent product innovations focus on enhancing data visualization, predictive analytics capabilities, and seamless integration with existing retail systems. The market is seeing a move towards cloud-based, AI-powered solutions that offer greater scalability, flexibility, and real-time insights. These advancements help retailers optimize operations, personalize customer experiences, and manage risks effectively.
Key Drivers of Instore Analytics Industry Growth
The growth of the Instore Analytics industry is propelled by several key factors:
- Technological Advancements: AI, ML, and IoT technologies are enabling the development of increasingly sophisticated analytics solutions that offer richer insights.
- Economic Growth: The expansion of the global retail sector is a major driver of market demand.
- Regulatory Changes: Initiatives aimed at promoting data-driven decision-making in the retail sector are stimulating market growth.
Challenges in the Instore Analytics Industry Market
The Instore Analytics market faces several challenges:
- Data Privacy Concerns: Stringent data privacy regulations necessitate robust security measures, increasing implementation costs.
- Integration Complexity: Integrating instore analytics solutions with existing retail systems can be complex and time-consuming.
- Competitive Pressures: The market is highly competitive, making it challenging for new entrants to gain market share.
Emerging Opportunities in Instore Analytics Industry
Significant opportunities exist in the Instore Analytics market, fueled by:
- Advancements in AI/ML: Next-generation solutions leveraging AI and ML will offer even more precise predictive capabilities.
- Strategic Partnerships: Collaborations between analytics providers and retail technology companies are creating comprehensive solutions.
- Expansion into Emerging Markets: Untapped potential exists in developing economies where retail sectors are rapidly expanding.
Leading Players in the Instore Analytics Industry Sector
- Hoxton Analytics Limited
- Amoobi Inc
- SAP SE
- Capgemini SE
- Happiest Minds Technologies
- Cloud4Wi Inc
- Motionloft Inc
- Capillary Technologies
- Thinkinside SRL
- RetailNext Inc
- Trax Image Recognition
Key Milestones in Instore Analytics Industry Industry
- December 2022: JRNI partnered with Mad Mobiles to offer a complete solution for replicating in-store shopping experiences online. This significantly enhances the customer experience and provides valuable data insights.
- November 2022: A California-based retail firm acquired The Retail Performance Company, expanding its in-store analytics capabilities in Europe and Asia and accelerating growth. This highlights the increasing importance of instore analytics for large retailers.
Strategic Outlook for Instore Analytics Industry Market
The Instore Analytics market presents a significant growth trajectory, driven by continuous technological innovation, increasing demand for personalized retail experiences, and the expansion of the global retail sector. Strategic opportunities for businesses include investments in AI/ML-powered solutions, strategic partnerships to expand market reach, and focusing on developing solutions catering to the growing needs of SMEs. The market is poised for substantial expansion, offering considerable returns for companies that can effectively leverage technology and cater to evolving customer expectations.
Instore Analytics Industry Segmentation
-
1. Component
- 1.1. Software
- 1.2. Services
-
2. Deployment
- 2.1. Cloud
- 2.2. On-Premises
-
3. Organization Size
- 3.1. Large Enterprises
- 3.2. Small & Medium Enterprises
-
4. Application
- 4.1. Customer Management
- 4.2. Risk and Compliance Management
- 4.3. Store Operations Management
- 4.4. Merchandise Management
- 4.5. Other Applications
Instore Analytics Industry Segmentation By Geography
- 1. North America
- 2. Europe
- 3. Asia Pacific
- 4. Latin America
- 5. Middle East and Africa
Instore Analytics Industry REPORT HIGHLIGHTS
| Aspects | Details |
|---|---|
| Study Period | 2019-2033 |
| Base Year | 2024 |
| Estimated Year | 2025 |
| Forecast Period | 2025-2033 |
| Historical Period | 2019-2024 |
| Growth Rate | CAGR of 24.23% from 2019-2033 |
| Segmentation |
|
Table of Contents
- 1. Introduction
- 1.1. Research Scope
- 1.2. Market Segmentation
- 1.3. Research Methodology
- 1.4. Definitions and Assumptions
- 2. Executive Summary
- 2.1. Introduction
- 3. Market Dynamics
- 3.1. Introduction
- 3.2. Market Drivers
- 3.2.1. Increasing advantage of the Cloud; Need for Better Customer Service and Enhanced Shopping Experience; Customer Management Segment to Witness Significant Market Growth
- 3.3. Market Restrains
- 3.3.1. Lack of Personnel Skills
- 3.4. Market Trends
- 3.4.1. Customer Management Segment to Witness Significant Market Growth
- 4. Market Factor Analysis
- 4.1. Porters Five Forces
- 4.2. Supply/Value Chain
- 4.3. PESTEL analysis
- 4.4. Market Entropy
- 4.5. Patent/Trademark Analysis
- 5. Global Instore Analytics Industry Analysis, Insights and Forecast, 2019-2031
- 5.1. Market Analysis, Insights and Forecast - by Component
- 5.1.1. Software
- 5.1.2. Services
- 5.2. Market Analysis, Insights and Forecast - by Deployment
- 5.2.1. Cloud
- 5.2.2. On-Premises
- 5.3. Market Analysis, Insights and Forecast - by Organization Size
- 5.3.1. Large Enterprises
- 5.3.2. Small & Medium Enterprises
- 5.4. Market Analysis, Insights and Forecast - by Application
- 5.4.1. Customer Management
- 5.4.2. Risk and Compliance Management
- 5.4.3. Store Operations Management
- 5.4.4. Merchandise Management
- 5.4.5. Other Applications
- 5.5. Market Analysis, Insights and Forecast - by Region
- 5.5.1. North America
- 5.5.2. Europe
- 5.5.3. Asia Pacific
- 5.5.4. Latin America
- 5.5.5. Middle East and Africa
- 5.1. Market Analysis, Insights and Forecast - by Component
- 6. North America Instore Analytics Industry Analysis, Insights and Forecast, 2019-2031
- 6.1. Market Analysis, Insights and Forecast - by Component
- 6.1.1. Software
- 6.1.2. Services
- 6.2. Market Analysis, Insights and Forecast - by Deployment
- 6.2.1. Cloud
- 6.2.2. On-Premises
- 6.3. Market Analysis, Insights and Forecast - by Organization Size
- 6.3.1. Large Enterprises
- 6.3.2. Small & Medium Enterprises
- 6.4. Market Analysis, Insights and Forecast - by Application
- 6.4.1. Customer Management
- 6.4.2. Risk and Compliance Management
- 6.4.3. Store Operations Management
- 6.4.4. Merchandise Management
- 6.4.5. Other Applications
- 6.1. Market Analysis, Insights and Forecast - by Component
- 7. Europe Instore Analytics Industry Analysis, Insights and Forecast, 2019-2031
- 7.1. Market Analysis, Insights and Forecast - by Component
- 7.1.1. Software
- 7.1.2. Services
- 7.2. Market Analysis, Insights and Forecast - by Deployment
- 7.2.1. Cloud
- 7.2.2. On-Premises
- 7.3. Market Analysis, Insights and Forecast - by Organization Size
- 7.3.1. Large Enterprises
- 7.3.2. Small & Medium Enterprises
- 7.4. Market Analysis, Insights and Forecast - by Application
- 7.4.1. Customer Management
- 7.4.2. Risk and Compliance Management
- 7.4.3. Store Operations Management
- 7.4.4. Merchandise Management
- 7.4.5. Other Applications
- 7.1. Market Analysis, Insights and Forecast - by Component
- 8. Asia Pacific Instore Analytics Industry Analysis, Insights and Forecast, 2019-2031
- 8.1. Market Analysis, Insights and Forecast - by Component
- 8.1.1. Software
- 8.1.2. Services
- 8.2. Market Analysis, Insights and Forecast - by Deployment
- 8.2.1. Cloud
- 8.2.2. On-Premises
- 8.3. Market Analysis, Insights and Forecast - by Organization Size
- 8.3.1. Large Enterprises
- 8.3.2. Small & Medium Enterprises
- 8.4. Market Analysis, Insights and Forecast - by Application
- 8.4.1. Customer Management
- 8.4.2. Risk and Compliance Management
- 8.4.3. Store Operations Management
- 8.4.4. Merchandise Management
- 8.4.5. Other Applications
- 8.1. Market Analysis, Insights and Forecast - by Component
- 9. Latin America Instore Analytics Industry Analysis, Insights and Forecast, 2019-2031
- 9.1. Market Analysis, Insights and Forecast - by Component
- 9.1.1. Software
- 9.1.2. Services
- 9.2. Market Analysis, Insights and Forecast - by Deployment
- 9.2.1. Cloud
- 9.2.2. On-Premises
- 9.3. Market Analysis, Insights and Forecast - by Organization Size
- 9.3.1. Large Enterprises
- 9.3.2. Small & Medium Enterprises
- 9.4. Market Analysis, Insights and Forecast - by Application
- 9.4.1. Customer Management
- 9.4.2. Risk and Compliance Management
- 9.4.3. Store Operations Management
- 9.4.4. Merchandise Management
- 9.4.5. Other Applications
- 9.1. Market Analysis, Insights and Forecast - by Component
- 10. Middle East and Africa Instore Analytics Industry Analysis, Insights and Forecast, 2019-2031
- 10.1. Market Analysis, Insights and Forecast - by Component
- 10.1.1. Software
- 10.1.2. Services
- 10.2. Market Analysis, Insights and Forecast - by Deployment
- 10.2.1. Cloud
- 10.2.2. On-Premises
- 10.3. Market Analysis, Insights and Forecast - by Organization Size
- 10.3.1. Large Enterprises
- 10.3.2. Small & Medium Enterprises
- 10.4. Market Analysis, Insights and Forecast - by Application
- 10.4.1. Customer Management
- 10.4.2. Risk and Compliance Management
- 10.4.3. Store Operations Management
- 10.4.4. Merchandise Management
- 10.4.5. Other Applications
- 10.1. Market Analysis, Insights and Forecast - by Component
- 11. North America Instore Analytics Industry Analysis, Insights and Forecast, 2019-2031
- 11.1. Market Analysis, Insights and Forecast - By Country/Sub-region
- 11.1.1 United States
- 11.1.2 Canada
- 11.1.3 Mexico
- 12. Europe Instore Analytics Industry Analysis, Insights and Forecast, 2019-2031
- 12.1. Market Analysis, Insights and Forecast - By Country/Sub-region
- 12.1.1 Germany
- 12.1.2 United Kingdom
- 12.1.3 France
- 12.1.4 Spain
- 12.1.5 Italy
- 12.1.6 Spain
- 12.1.7 Belgium
- 12.1.8 Netherland
- 12.1.9 Nordics
- 12.1.10 Rest of Europe
- 13. Asia Pacific Instore Analytics Industry Analysis, Insights and Forecast, 2019-2031
- 13.1. Market Analysis, Insights and Forecast - By Country/Sub-region
- 13.1.1 China
- 13.1.2 Japan
- 13.1.3 India
- 13.1.4 South Korea
- 13.1.5 Southeast Asia
- 13.1.6 Australia
- 13.1.7 Indonesia
- 13.1.8 Phillipes
- 13.1.9 Singapore
- 13.1.10 Thailandc
- 13.1.11 Rest of Asia Pacific
- 14. South America Instore Analytics Industry Analysis, Insights and Forecast, 2019-2031
- 14.1. Market Analysis, Insights and Forecast - By Country/Sub-region
- 14.1.1 Brazil
- 14.1.2 Argentina
- 14.1.3 Peru
- 14.1.4 Chile
- 14.1.5 Colombia
- 14.1.6 Ecuador
- 14.1.7 Venezuela
- 14.1.8 Rest of South America
- 15. North America Instore Analytics Industry Analysis, Insights and Forecast, 2019-2031
- 15.1. Market Analysis, Insights and Forecast - By Country/Sub-region
- 15.1.1 United States
- 15.1.2 Canada
- 15.1.3 Mexico
- 16. MEA Instore Analytics Industry Analysis, Insights and Forecast, 2019-2031
- 16.1. Market Analysis, Insights and Forecast - By Country/Sub-region
- 16.1.1 United Arab Emirates
- 16.1.2 Saudi Arabia
- 16.1.3 South Africa
- 16.1.4 Rest of Middle East and Africa
- 17. Competitive Analysis
- 17.1. Global Market Share Analysis 2024
- 17.2. Company Profiles
- 17.2.1 Hoxton Analytics Limited
- 17.2.1.1. Overview
- 17.2.1.2. Products
- 17.2.1.3. SWOT Analysis
- 17.2.1.4. Recent Developments
- 17.2.1.5. Financials (Based on Availability)
- 17.2.2 Amoobi Inc
- 17.2.2.1. Overview
- 17.2.2.2. Products
- 17.2.2.3. SWOT Analysis
- 17.2.2.4. Recent Developments
- 17.2.2.5. Financials (Based on Availability)
- 17.2.3 SAP SE
- 17.2.3.1. Overview
- 17.2.3.2. Products
- 17.2.3.3. SWOT Analysis
- 17.2.3.4. Recent Developments
- 17.2.3.5. Financials (Based on Availability)
- 17.2.4 Capgemini SE
- 17.2.4.1. Overview
- 17.2.4.2. Products
- 17.2.4.3. SWOT Analysis
- 17.2.4.4. Recent Developments
- 17.2.4.5. Financials (Based on Availability)
- 17.2.5 Happiest Minds Technologies
- 17.2.5.1. Overview
- 17.2.5.2. Products
- 17.2.5.3. SWOT Analysis
- 17.2.5.4. Recent Developments
- 17.2.5.5. Financials (Based on Availability)
- 17.2.6 Cloud4Wi Inc
- 17.2.6.1. Overview
- 17.2.6.2. Products
- 17.2.6.3. SWOT Analysis
- 17.2.6.4. Recent Developments
- 17.2.6.5. Financials (Based on Availability)
- 17.2.7 Motionloft Inc
- 17.2.7.1. Overview
- 17.2.7.2. Products
- 17.2.7.3. SWOT Analysis
- 17.2.7.4. Recent Developments
- 17.2.7.5. Financials (Based on Availability)
- 17.2.8 Capillary Technologies
- 17.2.8.1. Overview
- 17.2.8.2. Products
- 17.2.8.3. SWOT Analysis
- 17.2.8.4. Recent Developments
- 17.2.8.5. Financials (Based on Availability)
- 17.2.9 Thinkinside SRL
- 17.2.9.1. Overview
- 17.2.9.2. Products
- 17.2.9.3. SWOT Analysis
- 17.2.9.4. Recent Developments
- 17.2.9.5. Financials (Based on Availability)
- 17.2.10 RetailNext Inc
- 17.2.10.1. Overview
- 17.2.10.2. Products
- 17.2.10.3. SWOT Analysis
- 17.2.10.4. Recent Developments
- 17.2.10.5. Financials (Based on Availability)
- 17.2.11 Trax Image Recognition
- 17.2.11.1. Overview
- 17.2.11.2. Products
- 17.2.11.3. SWOT Analysis
- 17.2.11.4. Recent Developments
- 17.2.11.5. Financials (Based on Availability)
- 17.2.1 Hoxton Analytics Limited
List of Figures
- Figure 1: Global Instore Analytics Industry Revenue Breakdown (Million, %) by Region 2024 & 2032
- Figure 2: North America Instore Analytics Industry Revenue (Million), by Country 2024 & 2032
- Figure 3: North America Instore Analytics Industry Revenue Share (%), by Country 2024 & 2032
- Figure 4: Europe Instore Analytics Industry Revenue (Million), by Country 2024 & 2032
- Figure 5: Europe Instore Analytics Industry Revenue Share (%), by Country 2024 & 2032
- Figure 6: Asia Pacific Instore Analytics Industry Revenue (Million), by Country 2024 & 2032
- Figure 7: Asia Pacific Instore Analytics Industry Revenue Share (%), by Country 2024 & 2032
- Figure 8: South America Instore Analytics Industry Revenue (Million), by Country 2024 & 2032
- Figure 9: South America Instore Analytics Industry Revenue Share (%), by Country 2024 & 2032
- Figure 10: North America Instore Analytics Industry Revenue (Million), by Country 2024 & 2032
- Figure 11: North America Instore Analytics Industry Revenue Share (%), by Country 2024 & 2032
- Figure 12: MEA Instore Analytics Industry Revenue (Million), by Country 2024 & 2032
- Figure 13: MEA Instore Analytics Industry Revenue Share (%), by Country 2024 & 2032
- Figure 14: North America Instore Analytics Industry Revenue (Million), by Component 2024 & 2032
- Figure 15: North America Instore Analytics Industry Revenue Share (%), by Component 2024 & 2032
- Figure 16: North America Instore Analytics Industry Revenue (Million), by Deployment 2024 & 2032
- Figure 17: North America Instore Analytics Industry Revenue Share (%), by Deployment 2024 & 2032
- Figure 18: North America Instore Analytics Industry Revenue (Million), by Organization Size 2024 & 2032
- Figure 19: North America Instore Analytics Industry Revenue Share (%), by Organization Size 2024 & 2032
- Figure 20: North America Instore Analytics Industry Revenue (Million), by Application 2024 & 2032
- Figure 21: North America Instore Analytics Industry Revenue Share (%), by Application 2024 & 2032
- Figure 22: North America Instore Analytics Industry Revenue (Million), by Country 2024 & 2032
- Figure 23: North America Instore Analytics Industry Revenue Share (%), by Country 2024 & 2032
- Figure 24: Europe Instore Analytics Industry Revenue (Million), by Component 2024 & 2032
- Figure 25: Europe Instore Analytics Industry Revenue Share (%), by Component 2024 & 2032
- Figure 26: Europe Instore Analytics Industry Revenue (Million), by Deployment 2024 & 2032
- Figure 27: Europe Instore Analytics Industry Revenue Share (%), by Deployment 2024 & 2032
- Figure 28: Europe Instore Analytics Industry Revenue (Million), by Organization Size 2024 & 2032
- Figure 29: Europe Instore Analytics Industry Revenue Share (%), by Organization Size 2024 & 2032
- Figure 30: Europe Instore Analytics Industry Revenue (Million), by Application 2024 & 2032
- Figure 31: Europe Instore Analytics Industry Revenue Share (%), by Application 2024 & 2032
- Figure 32: Europe Instore Analytics Industry Revenue (Million), by Country 2024 & 2032
- Figure 33: Europe Instore Analytics Industry Revenue Share (%), by Country 2024 & 2032
- Figure 34: Asia Pacific Instore Analytics Industry Revenue (Million), by Component 2024 & 2032
- Figure 35: Asia Pacific Instore Analytics Industry Revenue Share (%), by Component 2024 & 2032
- Figure 36: Asia Pacific Instore Analytics Industry Revenue (Million), by Deployment 2024 & 2032
- Figure 37: Asia Pacific Instore Analytics Industry Revenue Share (%), by Deployment 2024 & 2032
- Figure 38: Asia Pacific Instore Analytics Industry Revenue (Million), by Organization Size 2024 & 2032
- Figure 39: Asia Pacific Instore Analytics Industry Revenue Share (%), by Organization Size 2024 & 2032
- Figure 40: Asia Pacific Instore Analytics Industry Revenue (Million), by Application 2024 & 2032
- Figure 41: Asia Pacific Instore Analytics Industry Revenue Share (%), by Application 2024 & 2032
- Figure 42: Asia Pacific Instore Analytics Industry Revenue (Million), by Country 2024 & 2032
- Figure 43: Asia Pacific Instore Analytics Industry Revenue Share (%), by Country 2024 & 2032
- Figure 44: Latin America Instore Analytics Industry Revenue (Million), by Component 2024 & 2032
- Figure 45: Latin America Instore Analytics Industry Revenue Share (%), by Component 2024 & 2032
- Figure 46: Latin America Instore Analytics Industry Revenue (Million), by Deployment 2024 & 2032
- Figure 47: Latin America Instore Analytics Industry Revenue Share (%), by Deployment 2024 & 2032
- Figure 48: Latin America Instore Analytics Industry Revenue (Million), by Organization Size 2024 & 2032
- Figure 49: Latin America Instore Analytics Industry Revenue Share (%), by Organization Size 2024 & 2032
- Figure 50: Latin America Instore Analytics Industry Revenue (Million), by Application 2024 & 2032
- Figure 51: Latin America Instore Analytics Industry Revenue Share (%), by Application 2024 & 2032
- Figure 52: Latin America Instore Analytics Industry Revenue (Million), by Country 2024 & 2032
- Figure 53: Latin America Instore Analytics Industry Revenue Share (%), by Country 2024 & 2032
- Figure 54: Middle East and Africa Instore Analytics Industry Revenue (Million), by Component 2024 & 2032
- Figure 55: Middle East and Africa Instore Analytics Industry Revenue Share (%), by Component 2024 & 2032
- Figure 56: Middle East and Africa Instore Analytics Industry Revenue (Million), by Deployment 2024 & 2032
- Figure 57: Middle East and Africa Instore Analytics Industry Revenue Share (%), by Deployment 2024 & 2032
- Figure 58: Middle East and Africa Instore Analytics Industry Revenue (Million), by Organization Size 2024 & 2032
- Figure 59: Middle East and Africa Instore Analytics Industry Revenue Share (%), by Organization Size 2024 & 2032
- Figure 60: Middle East and Africa Instore Analytics Industry Revenue (Million), by Application 2024 & 2032
- Figure 61: Middle East and Africa Instore Analytics Industry Revenue Share (%), by Application 2024 & 2032
- Figure 62: Middle East and Africa Instore Analytics Industry Revenue (Million), by Country 2024 & 2032
- Figure 63: Middle East and Africa Instore Analytics Industry Revenue Share (%), by Country 2024 & 2032
List of Tables
- Table 1: Global Instore Analytics Industry Revenue Million Forecast, by Region 2019 & 2032
- Table 2: Global Instore Analytics Industry Revenue Million Forecast, by Component 2019 & 2032
- Table 3: Global Instore Analytics Industry Revenue Million Forecast, by Deployment 2019 & 2032
- Table 4: Global Instore Analytics Industry Revenue Million Forecast, by Organization Size 2019 & 2032
- Table 5: Global Instore Analytics Industry Revenue Million Forecast, by Application 2019 & 2032
- Table 6: Global Instore Analytics Industry Revenue Million Forecast, by Region 2019 & 2032
- Table 7: Global Instore Analytics Industry Revenue Million Forecast, by Country 2019 & 2032
- Table 8: United States Instore Analytics Industry Revenue (Million) Forecast, by Application 2019 & 2032
- Table 9: Canada Instore Analytics Industry Revenue (Million) Forecast, by Application 2019 & 2032
- Table 10: Mexico Instore Analytics Industry Revenue (Million) Forecast, by Application 2019 & 2032
- Table 11: Global Instore Analytics Industry Revenue Million Forecast, by Country 2019 & 2032
- Table 12: Germany Instore Analytics Industry Revenue (Million) Forecast, by Application 2019 & 2032
- Table 13: United Kingdom Instore Analytics Industry Revenue (Million) Forecast, by Application 2019 & 2032
- Table 14: France Instore Analytics Industry Revenue (Million) Forecast, by Application 2019 & 2032
- Table 15: Spain Instore Analytics Industry Revenue (Million) Forecast, by Application 2019 & 2032
- Table 16: Italy Instore Analytics Industry Revenue (Million) Forecast, by Application 2019 & 2032
- Table 17: Spain Instore Analytics Industry Revenue (Million) Forecast, by Application 2019 & 2032
- Table 18: Belgium Instore Analytics Industry Revenue (Million) Forecast, by Application 2019 & 2032
- Table 19: Netherland Instore Analytics Industry Revenue (Million) Forecast, by Application 2019 & 2032
- Table 20: Nordics Instore Analytics Industry Revenue (Million) Forecast, by Application 2019 & 2032
- Table 21: Rest of Europe Instore Analytics Industry Revenue (Million) Forecast, by Application 2019 & 2032
- Table 22: Global Instore Analytics Industry Revenue Million Forecast, by Country 2019 & 2032
- Table 23: China Instore Analytics Industry Revenue (Million) Forecast, by Application 2019 & 2032
- Table 24: Japan Instore Analytics Industry Revenue (Million) Forecast, by Application 2019 & 2032
- Table 25: India Instore Analytics Industry Revenue (Million) Forecast, by Application 2019 & 2032
- Table 26: South Korea Instore Analytics Industry Revenue (Million) Forecast, by Application 2019 & 2032
- Table 27: Southeast Asia Instore Analytics Industry Revenue (Million) Forecast, by Application 2019 & 2032
- Table 28: Australia Instore Analytics Industry Revenue (Million) Forecast, by Application 2019 & 2032
- Table 29: Indonesia Instore Analytics Industry Revenue (Million) Forecast, by Application 2019 & 2032
- Table 30: Phillipes Instore Analytics Industry Revenue (Million) Forecast, by Application 2019 & 2032
- Table 31: Singapore Instore Analytics Industry Revenue (Million) Forecast, by Application 2019 & 2032
- Table 32: Thailandc Instore Analytics Industry Revenue (Million) Forecast, by Application 2019 & 2032
- Table 33: Rest of Asia Pacific Instore Analytics Industry Revenue (Million) Forecast, by Application 2019 & 2032
- Table 34: Global Instore Analytics Industry Revenue Million Forecast, by Country 2019 & 2032
- Table 35: Brazil Instore Analytics Industry Revenue (Million) Forecast, by Application 2019 & 2032
- Table 36: Argentina Instore Analytics Industry Revenue (Million) Forecast, by Application 2019 & 2032
- Table 37: Peru Instore Analytics Industry Revenue (Million) Forecast, by Application 2019 & 2032
- Table 38: Chile Instore Analytics Industry Revenue (Million) Forecast, by Application 2019 & 2032
- Table 39: Colombia Instore Analytics Industry Revenue (Million) Forecast, by Application 2019 & 2032
- Table 40: Ecuador Instore Analytics Industry Revenue (Million) Forecast, by Application 2019 & 2032
- Table 41: Venezuela Instore Analytics Industry Revenue (Million) Forecast, by Application 2019 & 2032
- Table 42: Rest of South America Instore Analytics Industry Revenue (Million) Forecast, by Application 2019 & 2032
- Table 43: Global Instore Analytics Industry Revenue Million Forecast, by Country 2019 & 2032
- Table 44: United States Instore Analytics Industry Revenue (Million) Forecast, by Application 2019 & 2032
- Table 45: Canada Instore Analytics Industry Revenue (Million) Forecast, by Application 2019 & 2032
- Table 46: Mexico Instore Analytics Industry Revenue (Million) Forecast, by Application 2019 & 2032
- Table 47: Global Instore Analytics Industry Revenue Million Forecast, by Country 2019 & 2032
- Table 48: United Arab Emirates Instore Analytics Industry Revenue (Million) Forecast, by Application 2019 & 2032
- Table 49: Saudi Arabia Instore Analytics Industry Revenue (Million) Forecast, by Application 2019 & 2032
- Table 50: South Africa Instore Analytics Industry Revenue (Million) Forecast, by Application 2019 & 2032
- Table 51: Rest of Middle East and Africa Instore Analytics Industry Revenue (Million) Forecast, by Application 2019 & 2032
- Table 52: Global Instore Analytics Industry Revenue Million Forecast, by Component 2019 & 2032
- Table 53: Global Instore Analytics Industry Revenue Million Forecast, by Deployment 2019 & 2032
- Table 54: Global Instore Analytics Industry Revenue Million Forecast, by Organization Size 2019 & 2032
- Table 55: Global Instore Analytics Industry Revenue Million Forecast, by Application 2019 & 2032
- Table 56: Global Instore Analytics Industry Revenue Million Forecast, by Country 2019 & 2032
- Table 57: Global Instore Analytics Industry Revenue Million Forecast, by Component 2019 & 2032
- Table 58: Global Instore Analytics Industry Revenue Million Forecast, by Deployment 2019 & 2032
- Table 59: Global Instore Analytics Industry Revenue Million Forecast, by Organization Size 2019 & 2032
- Table 60: Global Instore Analytics Industry Revenue Million Forecast, by Application 2019 & 2032
- Table 61: Global Instore Analytics Industry Revenue Million Forecast, by Country 2019 & 2032
- Table 62: Global Instore Analytics Industry Revenue Million Forecast, by Component 2019 & 2032
- Table 63: Global Instore Analytics Industry Revenue Million Forecast, by Deployment 2019 & 2032
- Table 64: Global Instore Analytics Industry Revenue Million Forecast, by Organization Size 2019 & 2032
- Table 65: Global Instore Analytics Industry Revenue Million Forecast, by Application 2019 & 2032
- Table 66: Global Instore Analytics Industry Revenue Million Forecast, by Country 2019 & 2032
- Table 67: Global Instore Analytics Industry Revenue Million Forecast, by Component 2019 & 2032
- Table 68: Global Instore Analytics Industry Revenue Million Forecast, by Deployment 2019 & 2032
- Table 69: Global Instore Analytics Industry Revenue Million Forecast, by Organization Size 2019 & 2032
- Table 70: Global Instore Analytics Industry Revenue Million Forecast, by Application 2019 & 2032
- Table 71: Global Instore Analytics Industry Revenue Million Forecast, by Country 2019 & 2032
- Table 72: Global Instore Analytics Industry Revenue Million Forecast, by Component 2019 & 2032
- Table 73: Global Instore Analytics Industry Revenue Million Forecast, by Deployment 2019 & 2032
- Table 74: Global Instore Analytics Industry Revenue Million Forecast, by Organization Size 2019 & 2032
- Table 75: Global Instore Analytics Industry Revenue Million Forecast, by Application 2019 & 2032
- Table 76: Global Instore Analytics Industry Revenue Million Forecast, by Country 2019 & 2032
Frequently Asked Questions
1. What is the projected Compound Annual Growth Rate (CAGR) of the Instore Analytics Industry?
The projected CAGR is approximately 24.23%.
2. Which companies are prominent players in the Instore Analytics Industry?
Key companies in the market include Hoxton Analytics Limited, Amoobi Inc, SAP SE, Capgemini SE, Happiest Minds Technologies, Cloud4Wi Inc, Motionloft Inc, Capillary Technologies, Thinkinside SRL, RetailNext Inc, Trax Image Recognition.
3. What are the main segments of the Instore Analytics Industry?
The market segments include Component, Deployment, Organization Size, Application.
4. Can you provide details about the market size?
The market size is estimated to be USD 4.26 Million as of 2022.
5. What are some drivers contributing to market growth?
Increasing advantage of the Cloud; Need for Better Customer Service and Enhanced Shopping Experience; Customer Management Segment to Witness Significant Market Growth.
6. What are the notable trends driving market growth?
Customer Management Segment to Witness Significant Market Growth.
7. Are there any restraints impacting market growth?
Lack of Personnel Skills.
8. Can you provide examples of recent developments in the market?
December 2022 - JRNI, a leading customer engagement platform, partnered with Mad Mobiles, a Retail associate platform for managing online and in-store customer shopping experiences. This integration would provide clients with a complete solution to replicate an in-person, in-store shopping experience from anywhere.
9. What pricing options are available for accessing the report?
Pricing options include single-user, multi-user, and enterprise licenses priced at USD 4750, USD 5250, and USD 8750 respectively.
10. Is the market size provided in terms of value or volume?
The market size is provided in terms of value, measured in Million.
11. Are there any specific market keywords associated with the report?
Yes, the market keyword associated with the report is "Instore Analytics Industry," which aids in identifying and referencing the specific market segment covered.
12. How do I determine which pricing option suits my needs best?
The pricing options vary based on user requirements and access needs. Individual users may opt for single-user licenses, while businesses requiring broader access may choose multi-user or enterprise licenses for cost-effective access to the report.
13. Are there any additional resources or data provided in the Instore Analytics Industry report?
While the report offers comprehensive insights, it's advisable to review the specific contents or supplementary materials provided to ascertain if additional resources or data are available.
14. How can I stay updated on further developments or reports in the Instore Analytics Industry?
To stay informed about further developments, trends, and reports in the Instore Analytics Industry, consider subscribing to industry newsletters, following relevant companies and organizations, or regularly checking reputable industry news sources and publications.
Methodology
Step 1 - Identification of Relevant Samples Size from Population Database


Step 2 - Approaches for Defining Global Market Size (Value, Volume* & Price*)

Note*: In applicable scenarios
Step 3 - Data Sources
Primary Research
- Web Analytics
- Survey Reports
- Research Institute
- Latest Research Reports
- Opinion Leaders
Secondary Research
- Annual Reports
- White Paper
- Latest Press Release
- Industry Association
- Paid Database
- Investor Presentations

Step 4 - Data Triangulation
Involves using different sources of information in order to increase the validity of a study
These sources are likely to be stakeholders in a program - participants, other researchers, program staff, other community members, and so on.
Then we put all data in single framework & apply various statistical tools to find out the dynamic on the market.
During the analysis stage, feedback from the stakeholder groups would be compared to determine areas of agreement as well as areas of divergence
