

Key Insights
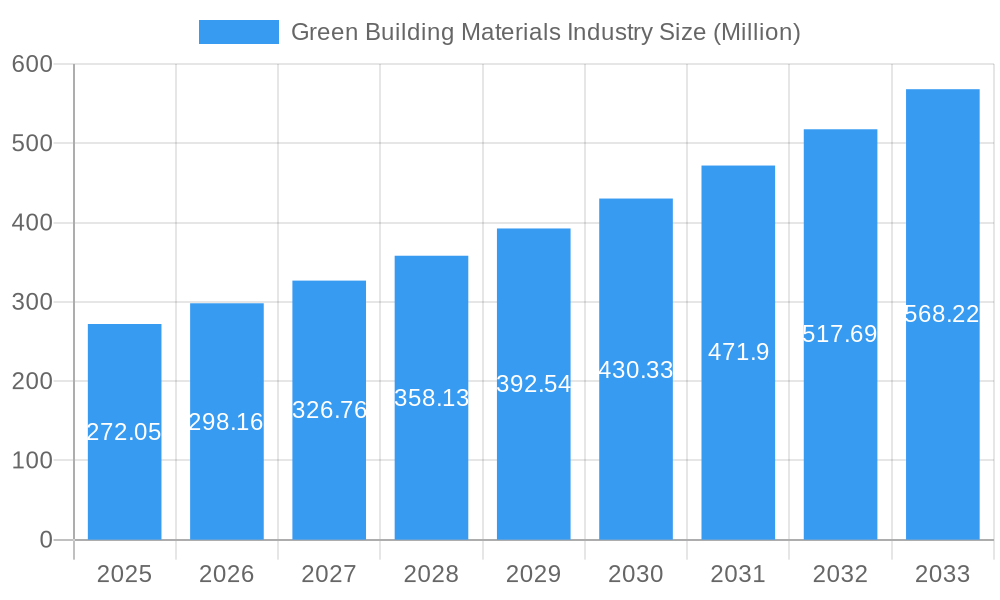
The global green building materials market, valued at $272.05 million in 2025, is experiencing robust growth, projected to expand at a compound annual growth rate (CAGR) of 9.73% from 2025 to 2033. This surge is driven by several key factors. Increasing environmental awareness and stricter building regulations promoting sustainable construction practices are major catalysts. The rising demand for energy-efficient buildings, coupled with government incentives and subsidies for green construction, further fuels market expansion. Significant growth is observed across various segments, including framing materials using sustainably sourced timber, eco-friendly insulation solutions, and recycled content roofing materials. The residential sector currently dominates the market, followed by commercial and industrial applications, with infrastructure projects increasingly adopting green building materials. Key players like Holcim, DuPont, and Owens Corning are leading the innovation and adoption of sustainable materials, fostering competition and driving further market growth. Technological advancements, such as the development of bio-based materials and improved recycling processes, are contributing to the market’s expansion and enhanced product performance. However, challenges remain, including higher initial costs compared to conventional materials and the need for standardized certification and quality control measures across diverse regions.
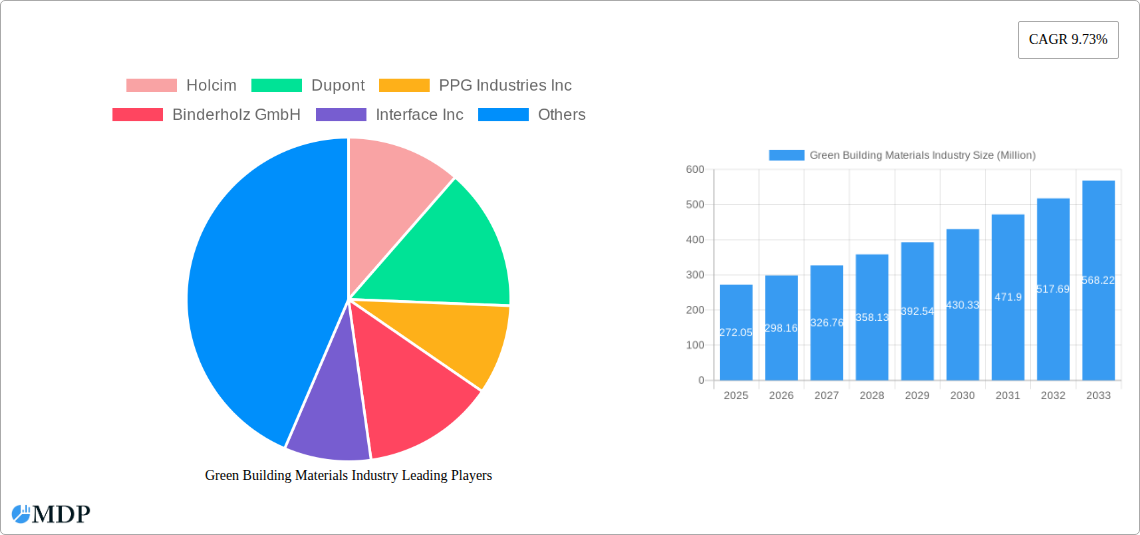
Green Building Materials Industry Market Size (In Million)
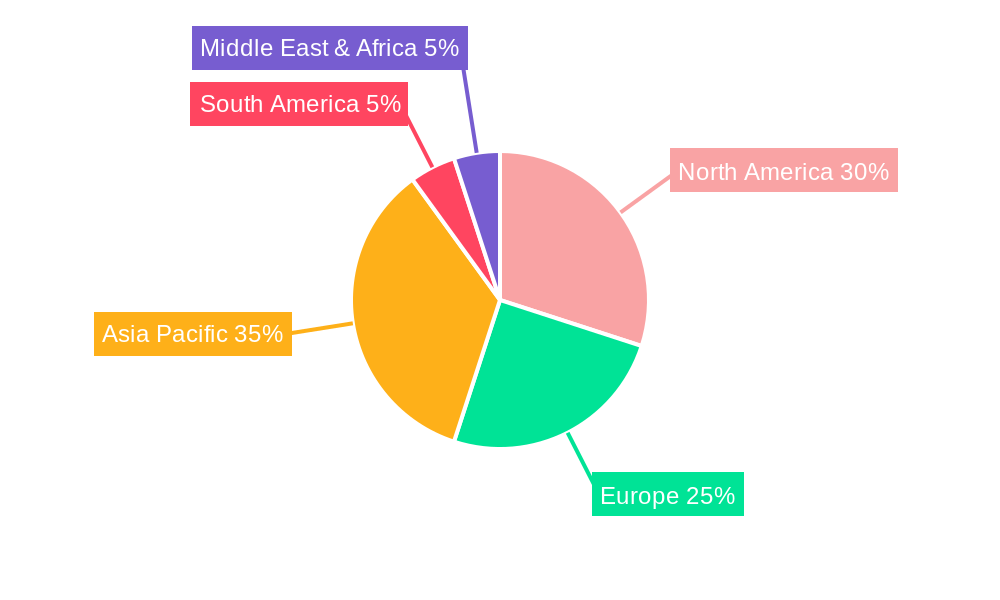
The Asia-Pacific region, particularly China and India, is anticipated to witness the most significant growth due to rapid urbanization and infrastructure development. North America and Europe also represent substantial market segments, driven by mature green building policies and a strong focus on sustainability. However, regional disparities in adoption rates exist, influenced by economic conditions, regulatory frameworks, and consumer awareness. Further growth is expected from ongoing innovations in materials science, leading to improved performance characteristics and reduced environmental impact. The market's future hinges on sustained policy support, technological breakthroughs, and increased consumer demand for environmentally responsible building practices. Companies will need to focus on developing cost-effective, high-performance solutions to overcome price barriers and ensure widespread market penetration.
Green Building Materials Industry Company Market Share
Green Building Materials Industry Market Report: 2019-2033
This comprehensive report provides an in-depth analysis of the global green building materials industry, projecting a market valuation exceeding $XX Million by 2033. It examines market dynamics, trends, leading players, and future opportunities, offering actionable insights for stakeholders across the value chain. The report covers the period 2019-2033, with a focus on the forecast period 2025-2033 and a base year of 2025. This analysis incorporates data from the historical period (2019-2024) and considers key industry developments.
Green Building Materials Industry Market Dynamics & Concentration
The green building materials market is experiencing a dynamic evolution, characterized by a moderate yet consolidating concentration. While established multinational corporations continue to hold substantial market share, a vibrant ecosystem of smaller, innovative firms is actively contributing to niche product development and driving advancements in eco-friendly alternatives. Current market share for the top 5 players is estimated at **[Insert Specific Percentage Here]%**, with a projected increase to **[Insert Specific Percentage Here]%** by 2033, signaling ongoing consolidation. This growth is primarily fueled by increasingly stringent environmental regulations worldwide, a heightened consumer and corporate consciousness regarding sustainability, and significant leaps in material science that enable the creation of more efficient and environmentally benign construction components. Product substitution is a pivotal force, as novel, sustainable materials consistently outperform and displace traditional, less eco-conscious options. The industry landscape is further shaped by frequent mergers and acquisitions (M&A), a testament to the pursuit of economies of scale, access to cutting-edge technologies, and market dominance. The historical period from 2019-2024 saw an average of **[Insert Specific Number Here]** M&A deals annually, a figure anticipated to rise to **[Insert Specific Number Here]** per year during the forecast period. Key overarching trends shaping the industry include:
- Escalating Demand for Sustainable Building Materials: Propelled by proactive government mandates, ambitious environmental targets, and a strong preference from end-users seeking to reduce their ecological footprint.
- Pioneering Technological Advancements: Continuous innovation in material science and manufacturing processes is yielding higher-performing, more durable, and significantly less environmentally impactful building materials.
- Strategic Alliances and Collaborative Ventures: The formation of partnerships and joint initiatives is proving instrumental in fostering cross-industry innovation, accelerating market penetration, and sharing best practices.
- Embracing Circular Economy Principles: A fundamental shift towards designing and utilizing materials with a focus on their entire lifecycle, emphasizing reuse, extensive recycling, and the minimization of construction and demolition waste.
Green Building Materials Industry Industry Trends & Analysis
The green building materials market is experiencing robust growth, with a projected Compound Annual Growth Rate (CAGR) of xx% from 2025 to 2033. This growth is fueled by several key factors. Firstly, increasing government regulations and incentives aimed at promoting sustainable construction are driving adoption. Secondly, rising consumer awareness of environmental issues and a preference for eco-friendly products are further boosting demand. Thirdly, technological innovations are continually improving the performance and affordability of green building materials, increasing their market penetration. Competitive dynamics are intense, with established players investing heavily in research and development to maintain their market positions and new entrants seeking to capitalize on market opportunities. The market penetration of green building materials in the residential sector is currently estimated at xx%, with significant growth potential in the commercial and infrastructure segments.
Leading Markets & Segments in Green Building Materials Industry
North America and Europe currently lead the global green building materials market, underpinned by stringent environmental legislation, substantial public and private investment in sustainable infrastructure, and a mature construction industry with a strong appetite for eco-friendly solutions. Within these leading regions, countries such as the United States, Canada, Germany, and the United Kingdom are at the forefront of market adoption and growth. While the residential sector remains a significant consumer, substantial growth is anticipated across the commercial, industrial, and burgeoning infrastructure segments. Key segment-specific growth drivers include:
- Framing Solutions: A rising demand for engineered wood products, sustainably sourced timber, and innovative structural systems that offer reduced embodied carbon.
- Insulation Technologies: Accelerated adoption of high-performance insulation materials, including natural fibers, recycled content, and advanced foam technologies, that significantly enhance energy efficiency and minimize environmental impact.
- Roofing Systems: A discernible shift towards cool roofing, green roofing, and roofing materials incorporating a high percentage of recycled content, contributing to energy savings and stormwater management.
- Exterior Cladding: Sustained high demand for durable, low-maintenance, and aesthetically pleasing sustainable siding options such as fiber cement, engineered wood, and reclaimed materials.
- Interior Finishes: Increased specification of low-VOC (Volatile Organic Compound) paints, natural and recycled content flooring, sustainable wall coverings, and finishes that promote healthy indoor air quality.
- Infrastructure Development: Significant governmental investments in sustainable infrastructure projects, including renewable energy installations, resilient transportation networks, and water management systems, are creating substantial new market opportunities for green building materials.
The dominance and growth within specific segments are further influenced by supportive economic policies that champion sustainable construction practices, targeted government funding for infrastructure modernization, and the overall vitality and responsiveness of the global construction sector to emerging environmental imperatives.
Green Building Materials Industry Product Developments
Recent years have witnessed significant innovation in green building materials, focusing on improved performance, reduced environmental footprint, and enhanced aesthetics. Developments include bio-based materials, recycled content products, and advanced manufacturing techniques. These innovations are improving the competitiveness of green building materials, broadening their applications, and creating new market opportunities, especially in areas like energy efficiency and carbon sequestration.
Key Drivers of Green Building Materials Industry Growth
The robust and accelerating growth of the green building materials industry is a direct consequence of a confluence of powerful, interconnected drivers:
- Stringent Environmental Regulations: Governments worldwide are enacting and enforcing more rigorous building codes, environmental impact assessments, and carbon emission targets, making the adoption of sustainable building materials not just an option, but a necessity.
- Heightened Consumer and Corporate Awareness: An informed populace and increasingly socially responsible corporations are actively seeking out and prioritizing building materials that align with their values for environmental stewardship and a healthier planet.
- Transformative Technological Advancements: Ongoing research and development in material science are yielding innovative, high-performance, and increasingly cost-competitive green building materials that offer superior functionality and reduced ecological footprints.
- Proactive Government Incentives and Support: Financial incentives, tax credits, subsidies, and green building certification programs are actively encouraging and rewarding the adoption of sustainable building technologies and materials, thereby accelerating market penetration.
Challenges in the Green Building Materials Industry Market
Despite significant growth potential, the green building materials industry faces several challenges:
- High initial costs: Green building materials can be more expensive upfront compared to traditional options, hindering wider adoption.
- Supply chain disruptions: Global supply chains can be vulnerable to disruptions, impacting material availability and prices.
- Lack of standardized testing and certification: Inconsistencies in testing and certification procedures create uncertainty for consumers and developers.
- Competition from traditional materials: Established traditional materials continue to represent a strong competitive pressure.
Emerging Opportunities in Green Building Materials Industry
The future trajectory of the green building materials market is exceptionally promising, with substantial long-term growth potential driven by a variety of emerging opportunities. Technological breakthroughs in areas such as bio-based composites, advanced recycled material processing, and low-carbon alternatives are poised to redefine the industry. Strategic partnerships and collaborative ventures between material manufacturers, construction firms, and research institutions will unlock new efficiencies and accelerate innovation. Furthermore, expanding market penetration into developing economies, where the urgency for sustainable development is rapidly growing, presents significant untapped potential. The industry is uniquely positioned to capitalize on advancements in:
- Bio-based and Renewable Materials: The development and widespread adoption of materials derived from plant-based sources, agricultural waste, and other renewable resources.
- Advanced Circular Economy Models: Implementing sophisticated systems for material recovery, upcycling, and the creation of closed-loop supply chains within the construction sector.
- Digitalization and Building Information Modeling (BIM): Leveraging BIM tools to integrate sustainability considerations from the earliest design stages, optimizing material selection, minimizing waste, and improving building performance throughout its lifecycle.
Leading Players in the Green Building Materials Industry Sector
- Holcim
- Dupont
- PPG Industries Inc
- Binderholz GmbH
- Interface Inc
- Owens Corning
- Kingspan Group
- BASF SE
- Soben International (Asia-Pacific) Ltd
- Saint- Gobain (Certainteed) (Saint-Gobain)
- Sika AG
Key Milestones in Green Building Materials Industry Industry
- October 2022: Holcim's strategic acquisition of Wiltshire Heavy Building Materials significantly bolstered its market presence and product portfolio in the UK, reinforcing its commitment to sustainable construction solutions.
- August 2022: Saint-Gobain's acquisition of Kaycan marked a key expansion of its siding and vinyl offerings across North America, aligning with growing demand for durable and sustainable exterior building products.
- January 2022: Binderholz GmbH's acquisition of BSW Timber Ltd solidified its position as Europe's largest sawmill company, highlighting the growing importance of sustainably managed forestry and advanced timber construction solutions.
Strategic Outlook for Green Building Materials Industry Market
The green building materials market is poised for continued expansion, driven by a confluence of factors including increasing environmental awareness, supportive government policies, and ongoing technological advancements. Strategic opportunities lie in developing innovative materials with enhanced performance and lower environmental impact, expanding into new geographical markets, and forging strategic partnerships to enhance supply chain efficiency and market reach. The focus on circular economy principles and sustainable construction practices will continue to shape the industry's trajectory in the coming years.
Green Building Materials Industry Segmentation
-
1. Application
- 1.1. Framing
- 1.2. Insulation
- 1.3. Roofing
- 1.4. Exterior Siding
- 1.5. Interior Finishing
- 1.6. Other Applications
-
2. End-use Industry
- 2.1. Residential
- 2.2. Commercial
- 2.3. Industrial and Institutional
- 2.4. Infrastructure
Green Building Materials Industry Segmentation By Geography
-
1. Asia Pacific
- 1.1. China
- 1.2. India
- 1.3. Japan
- 1.4. South Korea
- 1.5. Rest of Asia Pacific
-
2. North America
- 2.1. United States
- 2.2. Canada
- 2.3. Mexico
-
3. Europe
- 3.1. Germany
- 3.2. United Kingdom
- 3.3. Italy
- 3.4. France
- 3.5. Rest of Europe
-
4. South America
- 4.1. Brazil
- 4.2. Argentina
- 4.3. Rest of South America
- 5. Middle East
-
6. Saudi Arabia
- 6.1. South Africa
- 6.2. Rest of Middle East
Green Building Materials Industry Regional Market Share
Geographic Coverage of Green Building Materials Industry
Green Building Materials Industry REPORT HIGHLIGHTS
| Aspects | Details |
|---|---|
| Study Period | 2020-2034 |
| Base Year | 2025 |
| Estimated Year | 2026 |
| Forecast Period | 2026-2034 |
| Historical Period | 2020-2025 |
| Growth Rate | CAGR of 9.73% from 2020-2034 |
| Segmentation |
|
Table of Contents
- 1. Introduction
- 1.1. Research Scope
- 1.2. Market Segmentation
- 1.3. Research Objective
- 1.4. Definitions and Assumptions
- 2. Executive Summary
- 2.1. Market Snapshot
- 3. Market Dynamics
- 3.1. Market Drivers
- 3.2. Market Restrains
- 3.3. Market Trends
- 3.4. Market Opportunities
- 4. Market Factor Analysis
- 4.1. Porters Five Forces
- 4.1.1. Bargaining Power of Suppliers
- 4.1.2. Bargaining Power of Buyers
- 4.1.3. Threat of New Entrants
- 4.1.4. Threat of Substitutes
- 4.1.5. Competitive Rivalry
- 4.2. PESTEL analysis
- 4.3. BCG Analysis
- 4.3.1. Stars (High Growth, High Market Share)
- 4.3.2. Cash Cows (Low Growth, High Market Share)
- 4.3.3. Question Mark (High Growth, Low Market Share)
- 4.3.4. Dogs (Low Growth, Low Market Share)
- 4.4. Ansoff Matrix Analysis
- 4.5. Supply Chain Analysis
- 4.6. Regulatory Landscape
- 4.7. Current Market Potential and Opportunity Assessment (TAM–SAM–SOM Framework)
- 4.8. MDP Analyst Note
- 4.1. Porters Five Forces
- 5. Market Analysis, Insights and Forecast 2021-2033
- 5.1. Market Analysis, Insights and Forecast - by Application
- 5.1.1. Framing
- 5.1.2. Insulation
- 5.1.3. Roofing
- 5.1.4. Exterior Siding
- 5.1.5. Interior Finishing
- 5.1.6. Other Applications
- 5.2. Market Analysis, Insights and Forecast - by End-use Industry
- 5.2.1. Residential
- 5.2.2. Commercial
- 5.2.3. Industrial and Institutional
- 5.2.4. Infrastructure
- 5.3. Market Analysis, Insights and Forecast - by Region
- 5.3.1. Asia Pacific
- 5.3.2. North America
- 5.3.3. Europe
- 5.3.4. South America
- 5.3.5. Middle East
- 5.3.6. Saudi Arabia
- 5.1. Market Analysis, Insights and Forecast - by Application
- 6. Global Green Building Materials Industry Analysis, Insights and Forecast, 2021-2033
- 6.1. Market Analysis, Insights and Forecast - by Application
- 6.1.1. Framing
- 6.1.2. Insulation
- 6.1.3. Roofing
- 6.1.4. Exterior Siding
- 6.1.5. Interior Finishing
- 6.1.6. Other Applications
- 6.2. Market Analysis, Insights and Forecast - by End-use Industry
- 6.2.1. Residential
- 6.2.2. Commercial
- 6.2.3. Industrial and Institutional
- 6.2.4. Infrastructure
- 6.1. Market Analysis, Insights and Forecast - by Application
- 7. Asia Pacific Green Building Materials Industry Analysis, Insights and Forecast, 2020-2032
- 7.1. Market Analysis, Insights and Forecast - by Application
- 7.1.1. Framing
- 7.1.2. Insulation
- 7.1.3. Roofing
- 7.1.4. Exterior Siding
- 7.1.5. Interior Finishing
- 7.1.6. Other Applications
- 7.2. Market Analysis, Insights and Forecast - by End-use Industry
- 7.2.1. Residential
- 7.2.2. Commercial
- 7.2.3. Industrial and Institutional
- 7.2.4. Infrastructure
- 7.1. Market Analysis, Insights and Forecast - by Application
- 8. North America Green Building Materials Industry Analysis, Insights and Forecast, 2020-2032
- 8.1. Market Analysis, Insights and Forecast - by Application
- 8.1.1. Framing
- 8.1.2. Insulation
- 8.1.3. Roofing
- 8.1.4. Exterior Siding
- 8.1.5. Interior Finishing
- 8.1.6. Other Applications
- 8.2. Market Analysis, Insights and Forecast - by End-use Industry
- 8.2.1. Residential
- 8.2.2. Commercial
- 8.2.3. Industrial and Institutional
- 8.2.4. Infrastructure
- 8.1. Market Analysis, Insights and Forecast - by Application
- 9. Europe Green Building Materials Industry Analysis, Insights and Forecast, 2020-2032
- 9.1. Market Analysis, Insights and Forecast - by Application
- 9.1.1. Framing
- 9.1.2. Insulation
- 9.1.3. Roofing
- 9.1.4. Exterior Siding
- 9.1.5. Interior Finishing
- 9.1.6. Other Applications
- 9.2. Market Analysis, Insights and Forecast - by End-use Industry
- 9.2.1. Residential
- 9.2.2. Commercial
- 9.2.3. Industrial and Institutional
- 9.2.4. Infrastructure
- 9.1. Market Analysis, Insights and Forecast - by Application
- 10. South America Green Building Materials Industry Analysis, Insights and Forecast, 2020-2032
- 10.1. Market Analysis, Insights and Forecast - by Application
- 10.1.1. Framing
- 10.1.2. Insulation
- 10.1.3. Roofing
- 10.1.4. Exterior Siding
- 10.1.5. Interior Finishing
- 10.1.6. Other Applications
- 10.2. Market Analysis, Insights and Forecast - by End-use Industry
- 10.2.1. Residential
- 10.2.2. Commercial
- 10.2.3. Industrial and Institutional
- 10.2.4. Infrastructure
- 10.1. Market Analysis, Insights and Forecast - by Application
- 11. Middle East Green Building Materials Industry Analysis, Insights and Forecast, 2020-2032
- 11.1. Market Analysis, Insights and Forecast - by Application
- 11.1.1. Framing
- 11.1.2. Insulation
- 11.1.3. Roofing
- 11.1.4. Exterior Siding
- 11.1.5. Interior Finishing
- 11.1.6. Other Applications
- 11.2. Market Analysis, Insights and Forecast - by End-use Industry
- 11.2.1. Residential
- 11.2.2. Commercial
- 11.2.3. Industrial and Institutional
- 11.2.4. Infrastructure
- 11.1. Market Analysis, Insights and Forecast - by Application
- 12. Saudi Arabia Green Building Materials Industry Analysis, Insights and Forecast, 2020-2032
- 12.1. Market Analysis, Insights and Forecast - by Application
- 12.1.1. Framing
- 12.1.2. Insulation
- 12.1.3. Roofing
- 12.1.4. Exterior Siding
- 12.1.5. Interior Finishing
- 12.1.6. Other Applications
- 12.2. Market Analysis, Insights and Forecast - by End-use Industry
- 12.2.1. Residential
- 12.2.2. Commercial
- 12.2.3. Industrial and Institutional
- 12.2.4. Infrastructure
- 12.1. Market Analysis, Insights and Forecast - by Application
- 13. Competitive Analysis
- 13.1. Company Profiles
- 13.1.1 Holcim
- 13.1.1.1. Company Overview
- 13.1.1.2. Products
- 13.1.1.3. Company Financials
- 13.1.1.4. SWOT Analysis
- 13.1.2 Dupont
- 13.1.2.1. Company Overview
- 13.1.2.2. Products
- 13.1.2.3. Company Financials
- 13.1.2.4. SWOT Analysis
- 13.1.3 PPG Industries Inc
- 13.1.3.1. Company Overview
- 13.1.3.2. Products
- 13.1.3.3. Company Financials
- 13.1.3.4. SWOT Analysis
- 13.1.4 Binderholz GmbH
- 13.1.4.1. Company Overview
- 13.1.4.2. Products
- 13.1.4.3. Company Financials
- 13.1.4.4. SWOT Analysis
- 13.1.5 Interface Inc
- 13.1.5.1. Company Overview
- 13.1.5.2. Products
- 13.1.5.3. Company Financials
- 13.1.5.4. SWOT Analysis
- 13.1.6 Owens Corning
- 13.1.6.1. Company Overview
- 13.1.6.2. Products
- 13.1.6.3. Company Financials
- 13.1.6.4. SWOT Analysis
- 13.1.7 Kingspan Group
- 13.1.7.1. Company Overview
- 13.1.7.2. Products
- 13.1.7.3. Company Financials
- 13.1.7.4. SWOT Analysis
- 13.1.8 BASF SE
- 13.1.8.1. Company Overview
- 13.1.8.2. Products
- 13.1.8.3. Company Financials
- 13.1.8.4. SWOT Analysis
- 13.1.9 Soben International (Asia-Pacific) Ltd*List Not Exhaustive
- 13.1.9.1. Company Overview
- 13.1.9.2. Products
- 13.1.9.3. Company Financials
- 13.1.9.4. SWOT Analysis
- 13.1.10 Saint- Gobain (Certainteed)
- 13.1.10.1. Company Overview
- 13.1.10.2. Products
- 13.1.10.3. Company Financials
- 13.1.10.4. SWOT Analysis
- 13.1.11 Sika AG
- 13.1.11.1. Company Overview
- 13.1.11.2. Products
- 13.1.11.3. Company Financials
- 13.1.11.4. SWOT Analysis
- 13.1.1 Holcim
- 13.2. Market Entropy
- 13.2.1 Company's Key Areas Served
- 13.2.2 Recent Developments
- 13.3. Company Market Share Analysis 2025
- 13.3.1 Top 5 Companies Market Share Analysis
- 13.3.2 Top 3 Companies Market Share Analysis
- 13.4. List of Potential Customers
- 14. Research Methodology
List of Figures
- Figure 1: Global Green Building Materials Industry Revenue Breakdown (Million, %) by Region 2025 & 2033
- Figure 2: Asia Pacific Green Building Materials Industry Revenue (Million), by Application 2025 & 2033
- Figure 3: Asia Pacific Green Building Materials Industry Revenue Share (%), by Application 2025 & 2033
- Figure 4: Asia Pacific Green Building Materials Industry Revenue (Million), by End-use Industry 2025 & 2033
- Figure 5: Asia Pacific Green Building Materials Industry Revenue Share (%), by End-use Industry 2025 & 2033
- Figure 6: Asia Pacific Green Building Materials Industry Revenue (Million), by Country 2025 & 2033
- Figure 7: Asia Pacific Green Building Materials Industry Revenue Share (%), by Country 2025 & 2033
- Figure 8: North America Green Building Materials Industry Revenue (Million), by Application 2025 & 2033
- Figure 9: North America Green Building Materials Industry Revenue Share (%), by Application 2025 & 2033
- Figure 10: North America Green Building Materials Industry Revenue (Million), by End-use Industry 2025 & 2033
- Figure 11: North America Green Building Materials Industry Revenue Share (%), by End-use Industry 2025 & 2033
- Figure 12: North America Green Building Materials Industry Revenue (Million), by Country 2025 & 2033
- Figure 13: North America Green Building Materials Industry Revenue Share (%), by Country 2025 & 2033
- Figure 14: Europe Green Building Materials Industry Revenue (Million), by Application 2025 & 2033
- Figure 15: Europe Green Building Materials Industry Revenue Share (%), by Application 2025 & 2033
- Figure 16: Europe Green Building Materials Industry Revenue (Million), by End-use Industry 2025 & 2033
- Figure 17: Europe Green Building Materials Industry Revenue Share (%), by End-use Industry 2025 & 2033
- Figure 18: Europe Green Building Materials Industry Revenue (Million), by Country 2025 & 2033
- Figure 19: Europe Green Building Materials Industry Revenue Share (%), by Country 2025 & 2033
- Figure 20: South America Green Building Materials Industry Revenue (Million), by Application 2025 & 2033
- Figure 21: South America Green Building Materials Industry Revenue Share (%), by Application 2025 & 2033
- Figure 22: South America Green Building Materials Industry Revenue (Million), by End-use Industry 2025 & 2033
- Figure 23: South America Green Building Materials Industry Revenue Share (%), by End-use Industry 2025 & 2033
- Figure 24: South America Green Building Materials Industry Revenue (Million), by Country 2025 & 2033
- Figure 25: South America Green Building Materials Industry Revenue Share (%), by Country 2025 & 2033
- Figure 26: Middle East Green Building Materials Industry Revenue (Million), by Application 2025 & 2033
- Figure 27: Middle East Green Building Materials Industry Revenue Share (%), by Application 2025 & 2033
- Figure 28: Middle East Green Building Materials Industry Revenue (Million), by End-use Industry 2025 & 2033
- Figure 29: Middle East Green Building Materials Industry Revenue Share (%), by End-use Industry 2025 & 2033
- Figure 30: Middle East Green Building Materials Industry Revenue (Million), by Country 2025 & 2033
- Figure 31: Middle East Green Building Materials Industry Revenue Share (%), by Country 2025 & 2033
- Figure 32: Saudi Arabia Green Building Materials Industry Revenue (Million), by Application 2025 & 2033
- Figure 33: Saudi Arabia Green Building Materials Industry Revenue Share (%), by Application 2025 & 2033
- Figure 34: Saudi Arabia Green Building Materials Industry Revenue (Million), by End-use Industry 2025 & 2033
- Figure 35: Saudi Arabia Green Building Materials Industry Revenue Share (%), by End-use Industry 2025 & 2033
- Figure 36: Saudi Arabia Green Building Materials Industry Revenue (Million), by Country 2025 & 2033
- Figure 37: Saudi Arabia Green Building Materials Industry Revenue Share (%), by Country 2025 & 2033
List of Tables
- Table 1: Global Green Building Materials Industry Revenue Million Forecast, by Application 2020 & 2033
- Table 2: Global Green Building Materials Industry Revenue Million Forecast, by End-use Industry 2020 & 2033
- Table 3: Global Green Building Materials Industry Revenue Million Forecast, by Region 2020 & 2033
- Table 4: Global Green Building Materials Industry Revenue Million Forecast, by Application 2020 & 2033
- Table 5: Global Green Building Materials Industry Revenue Million Forecast, by End-use Industry 2020 & 2033
- Table 6: Global Green Building Materials Industry Revenue Million Forecast, by Country 2020 & 2033
- Table 7: China Green Building Materials Industry Revenue (Million) Forecast, by Application 2020 & 2033
- Table 8: India Green Building Materials Industry Revenue (Million) Forecast, by Application 2020 & 2033
- Table 9: Japan Green Building Materials Industry Revenue (Million) Forecast, by Application 2020 & 2033
- Table 10: South Korea Green Building Materials Industry Revenue (Million) Forecast, by Application 2020 & 2033
- Table 11: Rest of Asia Pacific Green Building Materials Industry Revenue (Million) Forecast, by Application 2020 & 2033
- Table 12: Global Green Building Materials Industry Revenue Million Forecast, by Application 2020 & 2033
- Table 13: Global Green Building Materials Industry Revenue Million Forecast, by End-use Industry 2020 & 2033
- Table 14: Global Green Building Materials Industry Revenue Million Forecast, by Country 2020 & 2033
- Table 15: United States Green Building Materials Industry Revenue (Million) Forecast, by Application 2020 & 2033
- Table 16: Canada Green Building Materials Industry Revenue (Million) Forecast, by Application 2020 & 2033
- Table 17: Mexico Green Building Materials Industry Revenue (Million) Forecast, by Application 2020 & 2033
- Table 18: Global Green Building Materials Industry Revenue Million Forecast, by Application 2020 & 2033
- Table 19: Global Green Building Materials Industry Revenue Million Forecast, by End-use Industry 2020 & 2033
- Table 20: Global Green Building Materials Industry Revenue Million Forecast, by Country 2020 & 2033
- Table 21: Germany Green Building Materials Industry Revenue (Million) Forecast, by Application 2020 & 2033
- Table 22: United Kingdom Green Building Materials Industry Revenue (Million) Forecast, by Application 2020 & 2033
- Table 23: Italy Green Building Materials Industry Revenue (Million) Forecast, by Application 2020 & 2033
- Table 24: France Green Building Materials Industry Revenue (Million) Forecast, by Application 2020 & 2033
- Table 25: Rest of Europe Green Building Materials Industry Revenue (Million) Forecast, by Application 2020 & 2033
- Table 26: Global Green Building Materials Industry Revenue Million Forecast, by Application 2020 & 2033
- Table 27: Global Green Building Materials Industry Revenue Million Forecast, by End-use Industry 2020 & 2033
- Table 28: Global Green Building Materials Industry Revenue Million Forecast, by Country 2020 & 2033
- Table 29: Brazil Green Building Materials Industry Revenue (Million) Forecast, by Application 2020 & 2033
- Table 30: Argentina Green Building Materials Industry Revenue (Million) Forecast, by Application 2020 & 2033
- Table 31: Rest of South America Green Building Materials Industry Revenue (Million) Forecast, by Application 2020 & 2033
- Table 32: Global Green Building Materials Industry Revenue Million Forecast, by Application 2020 & 2033
- Table 33: Global Green Building Materials Industry Revenue Million Forecast, by End-use Industry 2020 & 2033
- Table 34: Global Green Building Materials Industry Revenue Million Forecast, by Country 2020 & 2033
- Table 35: Global Green Building Materials Industry Revenue Million Forecast, by Application 2020 & 2033
- Table 36: Global Green Building Materials Industry Revenue Million Forecast, by End-use Industry 2020 & 2033
- Table 37: Global Green Building Materials Industry Revenue Million Forecast, by Country 2020 & 2033
- Table 38: South Africa Green Building Materials Industry Revenue (Million) Forecast, by Application 2020 & 2033
- Table 39: Rest of Middle East Green Building Materials Industry Revenue (Million) Forecast, by Application 2020 & 2033
Frequently Asked Questions
1. What is the projected Compound Annual Growth Rate (CAGR) of the Green Building Materials Industry?
The projected CAGR is approximately 9.73%.
2. Which companies are prominent players in the Green Building Materials Industry?
Key companies in the market include Holcim, Dupont, PPG Industries Inc, Binderholz GmbH, Interface Inc, Owens Corning, Kingspan Group, BASF SE, Soben International (Asia-Pacific) Ltd*List Not Exhaustive, Saint- Gobain (Certainteed), Sika AG.
3. What are the main segments of the Green Building Materials Industry?
The market segments include Application, End-use Industry.
4. Can you provide details about the market size?
The market size is estimated to be USD 272.05 Million as of 2022.
5. What are some drivers contributing to market growth?
Increasing Demand for Insulation and Energy-efficient Buildings; Favorable Government Policies for Green Buildings.
6. What are the notable trends driving market growth?
Increasing Consumption of Green Building Materials in the Residential End-use Industry.
7. Are there any restraints impacting market growth?
High Initial Capital Investment Compared to Conventional Buildings.
8. Can you provide examples of recent developments in the market?
October 2022: Holcim acquired Wiltshire Heavy Building Materials, one of the leading companies providing building solutions and material circularity in the United Kingdom. This acquisition will strengthen Holcim's market presence in the United Kingdom's green building materials market.
9. What pricing options are available for accessing the report?
Pricing options include single-user, multi-user, and enterprise licenses priced at USD 4750, USD 5250, and USD 8750 respectively.
10. Is the market size provided in terms of value or volume?
The market size is provided in terms of value, measured in Million.
11. Are there any specific market keywords associated with the report?
Yes, the market keyword associated with the report is "Green Building Materials Industry," which aids in identifying and referencing the specific market segment covered.
12. How do I determine which pricing option suits my needs best?
The pricing options vary based on user requirements and access needs. Individual users may opt for single-user licenses, while businesses requiring broader access may choose multi-user or enterprise licenses for cost-effective access to the report.
13. Are there any additional resources or data provided in the Green Building Materials Industry report?
While the report offers comprehensive insights, it's advisable to review the specific contents or supplementary materials provided to ascertain if additional resources or data are available.
14. How can I stay updated on further developments or reports in the Green Building Materials Industry?
To stay informed about further developments, trends, and reports in the Green Building Materials Industry, consider subscribing to industry newsletters, following relevant companies and organizations, or regularly checking reputable industry news sources and publications.
Methodology
Step 1 - Identification of Relevant Samples Size from Population Database


Step 2 - Approaches for Defining Global Market Size (Value, Volume* & Price*)

Note*: In applicable scenarios
Step 3 - Data Sources
Primary Research
- Web Analytics
- Survey Reports
- Research Institute
- Latest Research Reports
- Opinion Leaders
Secondary Research
- Annual Reports
- White Paper
- Latest Press Release
- Industry Association
- Paid Database
- Investor Presentations

Step 4 - Data Triangulation
Involves using different sources of information in order to increase the validity of a study
These sources are likely to be stakeholders in a program - participants, other researchers, program staff, other community members, and so on.
Then we put all data in single framework & apply various statistical tools to find out the dynamic on the market.
During the analysis stage, feedback from the stakeholder groups would be compared to determine areas of agreement as well as areas of divergence