

Key Insights
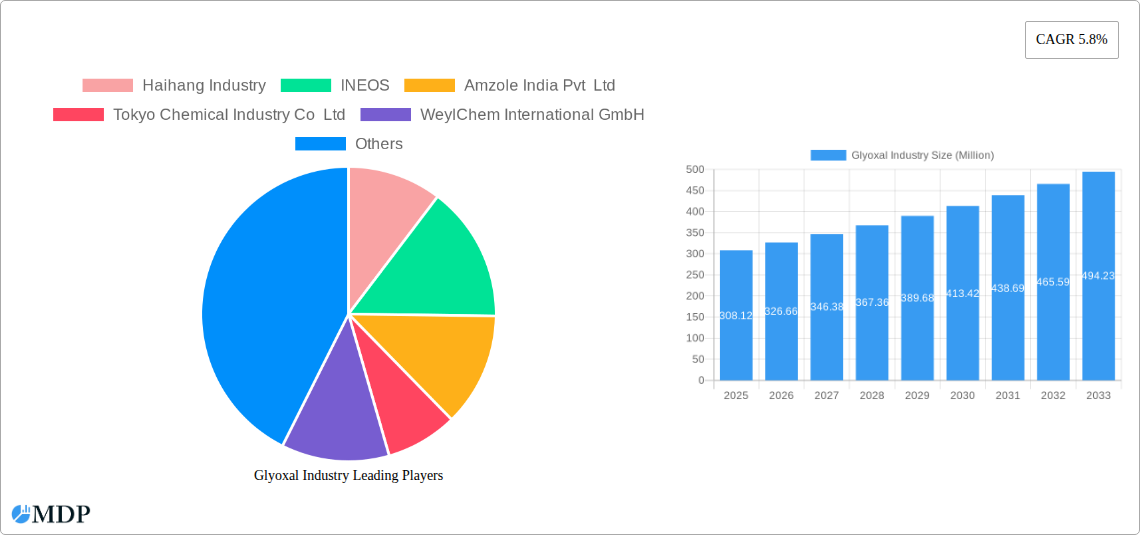
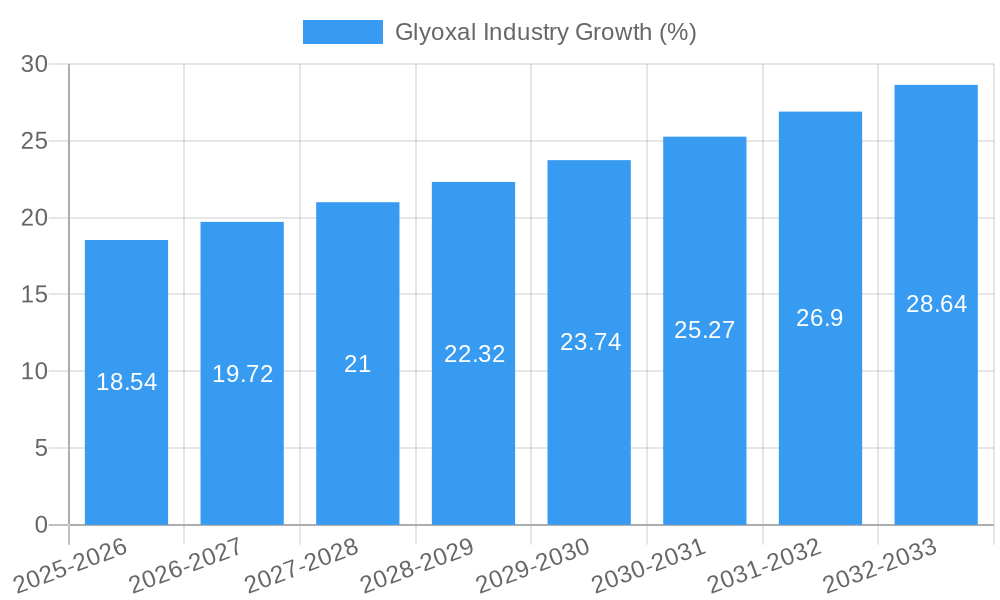
The global glyoxal market, valued at $308.12 million in 2025, is projected to experience robust growth, driven by increasing demand across diverse applications. The 5.8% CAGR from 2025 to 2033 signifies a significant expansion, primarily fueled by the burgeoning textile and resin & polymer industries. The adhesives and sealants application segment holds a substantial market share, owing to glyoxal's unique properties as a cross-linking agent, providing enhanced durability and performance. Growth within the textile sector is linked to the rising demand for high-performance fabrics, while the resin & polymer industry leverages glyoxal for improved material properties. The Asia-Pacific region, especially China and India, is expected to be a key growth driver due to rapid industrialization and increasing manufacturing activities. While the market faces some restraints, such as stringent environmental regulations and the availability of alternative chemicals, the overall positive outlook is maintained by the consistent growth across key end-use sectors and the continuous innovation in glyoxal-based applications. The direct sales channel currently dominates the market, but the indirect sales channel is also exhibiting growth, indicating a diversification in the distribution network.
The competitive landscape is marked by a mix of established global players and regional manufacturers. Companies like BASF SE and INEOS hold significant market share, owing to their established production capacity and global distribution networks. However, smaller regional players are also gaining traction, particularly in emerging economies, driven by the localized demand and favorable manufacturing costs. Future market growth will likely depend on technological advancements focusing on sustainable production methods, increased investment in R&D for novel applications, and successful navigation of environmental regulations. The continued exploration of glyoxal's potential in emerging applications, such as in bio-based materials and advanced coatings, will further contribute to the market's expansion throughout the forecast period. A deeper understanding of regional variations in demand, alongside tailored product development strategies, will be crucial for companies to capitalize on the expanding opportunities within the glyoxal market.
Glyoxal Industry Market Report: 2019-2033 Forecast
This comprehensive report provides an in-depth analysis of the global glyoxal industry, offering invaluable insights for stakeholders, investors, and industry professionals. Covering the period from 2019 to 2033, with a focus on 2025, this report unveils the market dynamics, competitive landscape, and future growth trajectory of this vital chemical sector.
Glyoxal Industry Market Dynamics & Concentration
The global glyoxal market, valued at $XX Million in 2024, is experiencing [Growth Rate]% CAGR, projected to reach $XX Million by 2033. Market concentration is moderate, with key players like BASF SE, INEOS, and Haihang Industry holding significant market share. However, several smaller players contribute significantly, creating a dynamic competitive environment.
Market Concentration Metrics:
- Top 5 Players Market Share: xx% (2024)
- Number of M&A Deals (2019-2024): xx
Driving Forces:
- Innovation in glyoxal-based technologies for adhesives, resins, and textiles drives market growth.
- Stringent environmental regulations are shaping the market, pushing for sustainable production methods.
- Product substitution with bio-based glyoxal alternatives presents both opportunities and challenges.
- End-user trends, particularly in the textile and paper packaging industries, are influencing demand.
- Strategic mergers and acquisitions are reshaping the competitive landscape, leading to increased consolidation.
Glyoxal Industry Industry Trends & Analysis
The glyoxal market is witnessing robust growth driven by increasing demand from various end-use industries. The textile industry's reliance on glyoxal as a cross-linking agent and its use in paper packaging for enhanced strength and durability are major factors contributing to market expansion. Technological advancements in glyoxal production, such as the adoption of more efficient and sustainable processes, are further propelling growth. Consumer preference for eco-friendly products is also impacting the market, driving demand for bio-based alternatives. Intense competition among major players fosters innovation and price optimization.
Key Metrics:
- CAGR (2025-2033): xx%
- Market Penetration in Key Segments: [Provide specific penetration data for major segments, e.g., Textile sector penetration at xx%]
Leading Markets & Segments in Glyoxal Industry
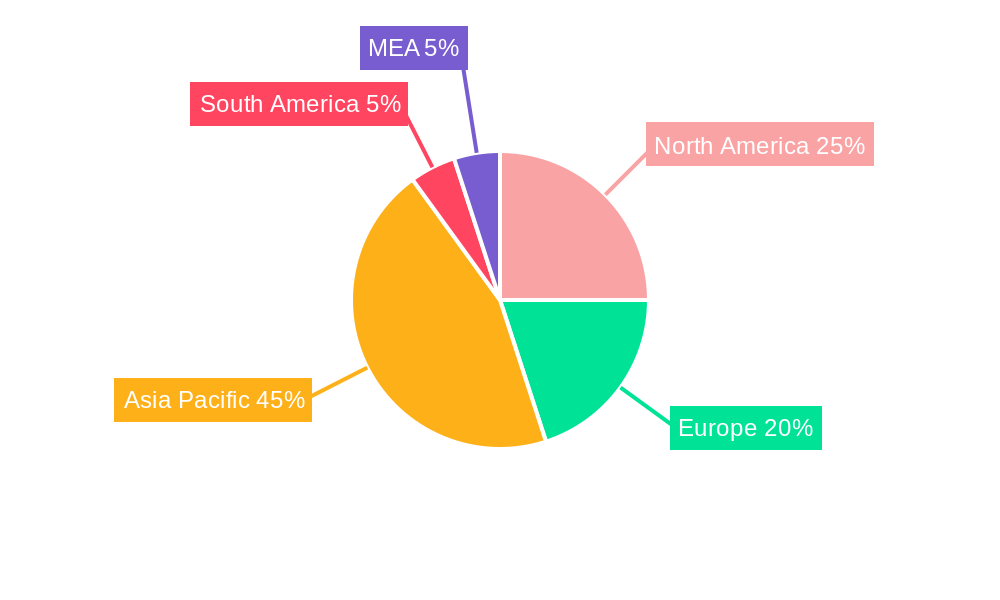
The Asia-Pacific region dominates the glyoxal market, driven by robust economic growth, expanding industrial sectors, and increasing demand from countries like China and India. Within applications, Adhesives & Sealants and Resin & Polymers are the largest segments, while Direct Sales remain the dominant sales channel.
Key Drivers by Segment:
- Adhesives & Sealants: Growing construction and automotive industries.
- Resin & Polymers: Expanding plastics and composites market.
- Textile: Increased demand for high-performance textiles.
- Asia-Pacific Region: Rapid industrialization and economic growth.
Dominance Analysis: The Asia-Pacific region's dominance stems from its substantial manufacturing base, rapidly growing infrastructure development, and expanding end-use industries. The high demand from the textile and paper packaging sectors further strengthens the region's position as the leading market.
Glyoxal Industry Product Developments
Recent product innovations focus on developing more environmentally friendly and efficient glyoxal formulations. These include bio-based glyoxals and formulations designed to reduce emissions and improve overall sustainability. The focus is on enhancing performance characteristics like improved adhesion, cross-linking efficiency, and durability while minimizing environmental impact. This aligns with growing consumer and regulatory pressure towards sustainable solutions.
Key Drivers of Glyoxal Industry Growth
Several factors fuel glyoxal market growth: expanding applications in various industries (especially textiles, resins, and adhesives); technological advancements leading to more efficient and sustainable production methods; and favorable government policies promoting industrial growth in key regions. The increasing demand for high-performance materials further boosts the market.
Challenges in the Glyoxal Industry Market
The glyoxal industry faces challenges including fluctuating raw material prices, stringent environmental regulations requiring costly compliance measures, and intense competition from substitute materials and emerging technologies. Supply chain disruptions and geopolitical uncertainties also pose significant risks. These factors can impact production costs and profitability.
Emerging Opportunities in Glyoxal Industry
The glyoxal market presents significant opportunities. The development of bio-based glyoxal offers a sustainable alternative, aligning with environmental concerns. Strategic collaborations and partnerships to expand into new markets and applications can also unlock substantial growth. Furthermore, technological innovations focusing on improving efficiency and reducing environmental impact can create new market niches.
Leading Players in the Glyoxal Industry Sector
- BASF SE
- INEOS
- Haihang Industry
- Amzole India Pvt Ltd
- Tokyo Chemical Industry Co Ltd
- WeylChem International GmbH
- Hubei Hongyuan Pharmaceutical Technology Co Ltd
- Toronto Research Chemicals
- Zhonglan Industry Co Ltd
- Thermo Fisher Scientific
Key Milestones in Glyoxal Industry Industry
- 2020: BASF SE launched a new, more sustainable glyoxal production process.
- 2022: INEOS acquired a smaller glyoxal producer, expanding its market share.
- 2023: A major technological breakthrough improved the efficiency of glyoxal cross-linking in textiles.
- [Add more milestones with specific dates and impacts]
Strategic Outlook for Glyoxal Industry Market
The glyoxal market is poised for continued growth, driven by technological advancements, increasing demand from key industries, and the emergence of sustainable alternatives. Strategic investments in research and development, expansion into new markets, and strategic partnerships will be crucial for companies seeking to capitalize on future growth opportunities. The focus on sustainability and eco-friendly solutions will be a key differentiator in the coming years.
Glyoxal Industry Segmentation
-
1. Application
- 1.1. Adhesives and Sealants
- 1.2. Intermediates
- 1.3. Oil and Gas Exploration
- 1.4. Paints and Coatings
- 1.5. Textile
- 1.6. Other Applications
Glyoxal Industry Segmentation By Geography
-
1. Asia Pacific
- 1.1. China
- 1.2. India
- 1.3. Japan
- 1.4. South Korea
- 1.5. Rest of Asia Pacific
-
2. North America
- 2.1. United States
- 2.2. Canada
- 2.3. Mexico
-
3. Europe
- 3.1. Germany
- 3.2. United Kingdom
- 3.3. Italy
- 3.4. France
- 3.5. Rest of Europe
-
4. South America
- 4.1. Brazil
- 4.2. Argentina
- 4.3. Rest of South America
- 5. Middle East
-
6. Saudi Arabia
- 6.1. South Africa
- 6.2. Rest of Middle East
Glyoxal Industry REPORT HIGHLIGHTS
| Aspects | Details |
|---|---|
| Study Period | 2019-2033 |
| Base Year | 2024 |
| Estimated Year | 2025 |
| Forecast Period | 2025-2033 |
| Historical Period | 2019-2024 |
| Growth Rate | CAGR of 5.8% from 2019-2033 |
| Segmentation |
|
Table of Contents
- 1. Introduction
- 1.1. Research Scope
- 1.2. Market Segmentation
- 1.3. Research Methodology
- 1.4. Definitions and Assumptions
- 2. Executive Summary
- 2.1. Introduction
- 3. Market Dynamics
- 3.1. Introduction
- 3.2. Market Drivers
- 3.2.1. ; Increasing Applications of Glyoxal in Fabrics; Growing Demand for Glyoxal as an Intermediate
- 3.3. Market Restrains
- 3.3.1. ; Associated Health Issues; Unfavorable Conditions Arising due to the Impact of COVID-19; Other Restraints
- 3.4. Market Trends
- 3.4.1. Increasing Demand for Glyoxal as an Intermediate and Crosslinkers
- 4. Market Factor Analysis
- 4.1. Porters Five Forces
- 4.2. Supply/Value Chain
- 4.3. PESTEL analysis
- 4.4. Market Entropy
- 4.5. Patent/Trademark Analysis
- 5. Global Glyoxal Industry Analysis, Insights and Forecast, 2019-2031
- 5.1. Market Analysis, Insights and Forecast - by Application
- 5.1.1. Adhesives and Sealants
- 5.1.2. Intermediates
- 5.1.3. Oil and Gas Exploration
- 5.1.4. Paints and Coatings
- 5.1.5. Textile
- 5.1.6. Other Applications
- 5.2. Market Analysis, Insights and Forecast - by Region
- 5.2.1. Asia Pacific
- 5.2.2. North America
- 5.2.3. Europe
- 5.2.4. South America
- 5.2.5. Middle East
- 5.2.6. Saudi Arabia
- 5.1. Market Analysis, Insights and Forecast - by Application
- 6. Asia Pacific Glyoxal Industry Analysis, Insights and Forecast, 2019-2031
- 6.1. Market Analysis, Insights and Forecast - by Application
- 6.1.1. Adhesives and Sealants
- 6.1.2. Intermediates
- 6.1.3. Oil and Gas Exploration
- 6.1.4. Paints and Coatings
- 6.1.5. Textile
- 6.1.6. Other Applications
- 6.1. Market Analysis, Insights and Forecast - by Application
- 7. North America Glyoxal Industry Analysis, Insights and Forecast, 2019-2031
- 7.1. Market Analysis, Insights and Forecast - by Application
- 7.1.1. Adhesives and Sealants
- 7.1.2. Intermediates
- 7.1.3. Oil and Gas Exploration
- 7.1.4. Paints and Coatings
- 7.1.5. Textile
- 7.1.6. Other Applications
- 7.1. Market Analysis, Insights and Forecast - by Application
- 8. Europe Glyoxal Industry Analysis, Insights and Forecast, 2019-2031
- 8.1. Market Analysis, Insights and Forecast - by Application
- 8.1.1. Adhesives and Sealants
- 8.1.2. Intermediates
- 8.1.3. Oil and Gas Exploration
- 8.1.4. Paints and Coatings
- 8.1.5. Textile
- 8.1.6. Other Applications
- 8.1. Market Analysis, Insights and Forecast - by Application
- 9. South America Glyoxal Industry Analysis, Insights and Forecast, 2019-2031
- 9.1. Market Analysis, Insights and Forecast - by Application
- 9.1.1. Adhesives and Sealants
- 9.1.2. Intermediates
- 9.1.3. Oil and Gas Exploration
- 9.1.4. Paints and Coatings
- 9.1.5. Textile
- 9.1.6. Other Applications
- 9.1. Market Analysis, Insights and Forecast - by Application
- 10. Middle East Glyoxal Industry Analysis, Insights and Forecast, 2019-2031
- 10.1. Market Analysis, Insights and Forecast - by Application
- 10.1.1. Adhesives and Sealants
- 10.1.2. Intermediates
- 10.1.3. Oil and Gas Exploration
- 10.1.4. Paints and Coatings
- 10.1.5. Textile
- 10.1.6. Other Applications
- 10.1. Market Analysis, Insights and Forecast - by Application
- 11. Saudi Arabia Glyoxal Industry Analysis, Insights and Forecast, 2019-2031
- 11.1. Market Analysis, Insights and Forecast - by Application
- 11.1.1. Adhesives and Sealants
- 11.1.2. Intermediates
- 11.1.3. Oil and Gas Exploration
- 11.1.4. Paints and Coatings
- 11.1.5. Textile
- 11.1.6. Other Applications
- 11.1. Market Analysis, Insights and Forecast - by Application
- 12. North America Glyoxal Industry Analysis, Insights and Forecast, 2019-2031
- 12.1. Market Analysis, Insights and Forecast - By Country/Sub-region
- 12.1.1 United States
- 12.1.2 Canada
- 12.1.3 Mexico
- 13. Europe Glyoxal Industry Analysis, Insights and Forecast, 2019-2031
- 13.1. Market Analysis, Insights and Forecast - By Country/Sub-region
- 13.1.1 Germany
- 13.1.2 France
- 13.1.3 Italy
- 13.1.4 United Kingdom
- 13.1.5 Netherlands
- 13.1.6 Rest of Europe
- 14. Asia Pacific Glyoxal Industry Analysis, Insights and Forecast, 2019-2031
- 14.1. Market Analysis, Insights and Forecast - By Country/Sub-region
- 14.1.1 China
- 14.1.2 Japan
- 14.1.3 India
- 14.1.4 South Korea
- 14.1.5 Taiwan
- 14.1.6 Australia
- 14.1.7 Rest of Asia-Pacific
- 15. South America Glyoxal Industry Analysis, Insights and Forecast, 2019-2031
- 15.1. Market Analysis, Insights and Forecast - By Country/Sub-region
- 15.1.1 Brazil
- 15.1.2 Argentina
- 15.1.3 Rest of South America
- 16. MEA Glyoxal Industry Analysis, Insights and Forecast, 2019-2031
- 16.1. Market Analysis, Insights and Forecast - By Country/Sub-region
- 16.1.1 Middle East
- 16.1.2 Africa
- 17. Competitive Analysis
- 17.1. Global Market Share Analysis 2024
- 17.2. Company Profiles
- 17.2.1 Haihang Industry
- 17.2.1.1. Overview
- 17.2.1.2. Products
- 17.2.1.3. SWOT Analysis
- 17.2.1.4. Recent Developments
- 17.2.1.5. Financials (Based on Availability)
- 17.2.2 INEOS
- 17.2.2.1. Overview
- 17.2.2.2. Products
- 17.2.2.3. SWOT Analysis
- 17.2.2.4. Recent Developments
- 17.2.2.5. Financials (Based on Availability)
- 17.2.3 Amzole India Pvt Ltd
- 17.2.3.1. Overview
- 17.2.3.2. Products
- 17.2.3.3. SWOT Analysis
- 17.2.3.4. Recent Developments
- 17.2.3.5. Financials (Based on Availability)
- 17.2.4 Tokyo Chemical Industry Co Ltd
- 17.2.4.1. Overview
- 17.2.4.2. Products
- 17.2.4.3. SWOT Analysis
- 17.2.4.4. Recent Developments
- 17.2.4.5. Financials (Based on Availability)
- 17.2.5 WeylChem International GmbH
- 17.2.5.1. Overview
- 17.2.5.2. Products
- 17.2.5.3. SWOT Analysis
- 17.2.5.4. Recent Developments
- 17.2.5.5. Financials (Based on Availability)
- 17.2.6 BASF SE
- 17.2.6.1. Overview
- 17.2.6.2. Products
- 17.2.6.3. SWOT Analysis
- 17.2.6.4. Recent Developments
- 17.2.6.5. Financials (Based on Availability)
- 17.2.7 Hubei Hongyuan Pharmaceutical Technology Co Ltd
- 17.2.7.1. Overview
- 17.2.7.2. Products
- 17.2.7.3. SWOT Analysis
- 17.2.7.4. Recent Developments
- 17.2.7.5. Financials (Based on Availability)
- 17.2.8 Toronto Research Chemicals
- 17.2.8.1. Overview
- 17.2.8.2. Products
- 17.2.8.3. SWOT Analysis
- 17.2.8.4. Recent Developments
- 17.2.8.5. Financials (Based on Availability)
- 17.2.9 Zhonglan Industry Co Ltd
- 17.2.9.1. Overview
- 17.2.9.2. Products
- 17.2.9.3. SWOT Analysis
- 17.2.9.4. Recent Developments
- 17.2.9.5. Financials (Based on Availability)
- 17.2.10 Thermo Fisher Scientific
- 17.2.10.1. Overview
- 17.2.10.2. Products
- 17.2.10.3. SWOT Analysis
- 17.2.10.4. Recent Developments
- 17.2.10.5. Financials (Based on Availability)
- 17.2.1 Haihang Industry
List of Figures
- Figure 1: Global Glyoxal Industry Revenue Breakdown (Million, %) by Region 2024 & 2032
- Figure 2: Global Glyoxal Industry Volume Breakdown (K Tons, %) by Region 2024 & 2032
- Figure 3: North America Glyoxal Industry Revenue (Million), by Country 2024 & 2032
- Figure 4: North America Glyoxal Industry Volume (K Tons), by Country 2024 & 2032
- Figure 5: North America Glyoxal Industry Revenue Share (%), by Country 2024 & 2032
- Figure 6: North America Glyoxal Industry Volume Share (%), by Country 2024 & 2032
- Figure 7: Europe Glyoxal Industry Revenue (Million), by Country 2024 & 2032
- Figure 8: Europe Glyoxal Industry Volume (K Tons), by Country 2024 & 2032
- Figure 9: Europe Glyoxal Industry Revenue Share (%), by Country 2024 & 2032
- Figure 10: Europe Glyoxal Industry Volume Share (%), by Country 2024 & 2032
- Figure 11: Asia Pacific Glyoxal Industry Revenue (Million), by Country 2024 & 2032
- Figure 12: Asia Pacific Glyoxal Industry Volume (K Tons), by Country 2024 & 2032
- Figure 13: Asia Pacific Glyoxal Industry Revenue Share (%), by Country 2024 & 2032
- Figure 14: Asia Pacific Glyoxal Industry Volume Share (%), by Country 2024 & 2032
- Figure 15: South America Glyoxal Industry Revenue (Million), by Country 2024 & 2032
- Figure 16: South America Glyoxal Industry Volume (K Tons), by Country 2024 & 2032
- Figure 17: South America Glyoxal Industry Revenue Share (%), by Country 2024 & 2032
- Figure 18: South America Glyoxal Industry Volume Share (%), by Country 2024 & 2032
- Figure 19: MEA Glyoxal Industry Revenue (Million), by Country 2024 & 2032
- Figure 20: MEA Glyoxal Industry Volume (K Tons), by Country 2024 & 2032
- Figure 21: MEA Glyoxal Industry Revenue Share (%), by Country 2024 & 2032
- Figure 22: MEA Glyoxal Industry Volume Share (%), by Country 2024 & 2032
- Figure 23: Asia Pacific Glyoxal Industry Revenue (Million), by Application 2024 & 2032
- Figure 24: Asia Pacific Glyoxal Industry Volume (K Tons), by Application 2024 & 2032
- Figure 25: Asia Pacific Glyoxal Industry Revenue Share (%), by Application 2024 & 2032
- Figure 26: Asia Pacific Glyoxal Industry Volume Share (%), by Application 2024 & 2032
- Figure 27: Asia Pacific Glyoxal Industry Revenue (Million), by Country 2024 & 2032
- Figure 28: Asia Pacific Glyoxal Industry Volume (K Tons), by Country 2024 & 2032
- Figure 29: Asia Pacific Glyoxal Industry Revenue Share (%), by Country 2024 & 2032
- Figure 30: Asia Pacific Glyoxal Industry Volume Share (%), by Country 2024 & 2032
- Figure 31: North America Glyoxal Industry Revenue (Million), by Application 2024 & 2032
- Figure 32: North America Glyoxal Industry Volume (K Tons), by Application 2024 & 2032
- Figure 33: North America Glyoxal Industry Revenue Share (%), by Application 2024 & 2032
- Figure 34: North America Glyoxal Industry Volume Share (%), by Application 2024 & 2032
- Figure 35: North America Glyoxal Industry Revenue (Million), by Country 2024 & 2032
- Figure 36: North America Glyoxal Industry Volume (K Tons), by Country 2024 & 2032
- Figure 37: North America Glyoxal Industry Revenue Share (%), by Country 2024 & 2032
- Figure 38: North America Glyoxal Industry Volume Share (%), by Country 2024 & 2032
- Figure 39: Europe Glyoxal Industry Revenue (Million), by Application 2024 & 2032
- Figure 40: Europe Glyoxal Industry Volume (K Tons), by Application 2024 & 2032
- Figure 41: Europe Glyoxal Industry Revenue Share (%), by Application 2024 & 2032
- Figure 42: Europe Glyoxal Industry Volume Share (%), by Application 2024 & 2032
- Figure 43: Europe Glyoxal Industry Revenue (Million), by Country 2024 & 2032
- Figure 44: Europe Glyoxal Industry Volume (K Tons), by Country 2024 & 2032
- Figure 45: Europe Glyoxal Industry Revenue Share (%), by Country 2024 & 2032
- Figure 46: Europe Glyoxal Industry Volume Share (%), by Country 2024 & 2032
- Figure 47: South America Glyoxal Industry Revenue (Million), by Application 2024 & 2032
- Figure 48: South America Glyoxal Industry Volume (K Tons), by Application 2024 & 2032
- Figure 49: South America Glyoxal Industry Revenue Share (%), by Application 2024 & 2032
- Figure 50: South America Glyoxal Industry Volume Share (%), by Application 2024 & 2032
- Figure 51: South America Glyoxal Industry Revenue (Million), by Country 2024 & 2032
- Figure 52: South America Glyoxal Industry Volume (K Tons), by Country 2024 & 2032
- Figure 53: South America Glyoxal Industry Revenue Share (%), by Country 2024 & 2032
- Figure 54: South America Glyoxal Industry Volume Share (%), by Country 2024 & 2032
- Figure 55: Middle East Glyoxal Industry Revenue (Million), by Application 2024 & 2032
- Figure 56: Middle East Glyoxal Industry Volume (K Tons), by Application 2024 & 2032
- Figure 57: Middle East Glyoxal Industry Revenue Share (%), by Application 2024 & 2032
- Figure 58: Middle East Glyoxal Industry Volume Share (%), by Application 2024 & 2032
- Figure 59: Middle East Glyoxal Industry Revenue (Million), by Country 2024 & 2032
- Figure 60: Middle East Glyoxal Industry Volume (K Tons), by Country 2024 & 2032
- Figure 61: Middle East Glyoxal Industry Revenue Share (%), by Country 2024 & 2032
- Figure 62: Middle East Glyoxal Industry Volume Share (%), by Country 2024 & 2032
- Figure 63: Saudi Arabia Glyoxal Industry Revenue (Million), by Application 2024 & 2032
- Figure 64: Saudi Arabia Glyoxal Industry Volume (K Tons), by Application 2024 & 2032
- Figure 65: Saudi Arabia Glyoxal Industry Revenue Share (%), by Application 2024 & 2032
- Figure 66: Saudi Arabia Glyoxal Industry Volume Share (%), by Application 2024 & 2032
- Figure 67: Saudi Arabia Glyoxal Industry Revenue (Million), by Country 2024 & 2032
- Figure 68: Saudi Arabia Glyoxal Industry Volume (K Tons), by Country 2024 & 2032
- Figure 69: Saudi Arabia Glyoxal Industry Revenue Share (%), by Country 2024 & 2032
- Figure 70: Saudi Arabia Glyoxal Industry Volume Share (%), by Country 2024 & 2032
List of Tables
- Table 1: Global Glyoxal Industry Revenue Million Forecast, by Region 2019 & 2032
- Table 2: Global Glyoxal Industry Volume K Tons Forecast, by Region 2019 & 2032
- Table 3: Global Glyoxal Industry Revenue Million Forecast, by Application 2019 & 2032
- Table 4: Global Glyoxal Industry Volume K Tons Forecast, by Application 2019 & 2032
- Table 5: Global Glyoxal Industry Revenue Million Forecast, by Region 2019 & 2032
- Table 6: Global Glyoxal Industry Volume K Tons Forecast, by Region 2019 & 2032
- Table 7: Global Glyoxal Industry Revenue Million Forecast, by Country 2019 & 2032
- Table 8: Global Glyoxal Industry Volume K Tons Forecast, by Country 2019 & 2032
- Table 9: United States Glyoxal Industry Revenue (Million) Forecast, by Application 2019 & 2032
- Table 10: United States Glyoxal Industry Volume (K Tons) Forecast, by Application 2019 & 2032
- Table 11: Canada Glyoxal Industry Revenue (Million) Forecast, by Application 2019 & 2032
- Table 12: Canada Glyoxal Industry Volume (K Tons) Forecast, by Application 2019 & 2032
- Table 13: Mexico Glyoxal Industry Revenue (Million) Forecast, by Application 2019 & 2032
- Table 14: Mexico Glyoxal Industry Volume (K Tons) Forecast, by Application 2019 & 2032
- Table 15: Global Glyoxal Industry Revenue Million Forecast, by Country 2019 & 2032
- Table 16: Global Glyoxal Industry Volume K Tons Forecast, by Country 2019 & 2032
- Table 17: Germany Glyoxal Industry Revenue (Million) Forecast, by Application 2019 & 2032
- Table 18: Germany Glyoxal Industry Volume (K Tons) Forecast, by Application 2019 & 2032
- Table 19: France Glyoxal Industry Revenue (Million) Forecast, by Application 2019 & 2032
- Table 20: France Glyoxal Industry Volume (K Tons) Forecast, by Application 2019 & 2032
- Table 21: Italy Glyoxal Industry Revenue (Million) Forecast, by Application 2019 & 2032
- Table 22: Italy Glyoxal Industry Volume (K Tons) Forecast, by Application 2019 & 2032
- Table 23: United Kingdom Glyoxal Industry Revenue (Million) Forecast, by Application 2019 & 2032
- Table 24: United Kingdom Glyoxal Industry Volume (K Tons) Forecast, by Application 2019 & 2032
- Table 25: Netherlands Glyoxal Industry Revenue (Million) Forecast, by Application 2019 & 2032
- Table 26: Netherlands Glyoxal Industry Volume (K Tons) Forecast, by Application 2019 & 2032
- Table 27: Rest of Europe Glyoxal Industry Revenue (Million) Forecast, by Application 2019 & 2032
- Table 28: Rest of Europe Glyoxal Industry Volume (K Tons) Forecast, by Application 2019 & 2032
- Table 29: Global Glyoxal Industry Revenue Million Forecast, by Country 2019 & 2032
- Table 30: Global Glyoxal Industry Volume K Tons Forecast, by Country 2019 & 2032
- Table 31: China Glyoxal Industry Revenue (Million) Forecast, by Application 2019 & 2032
- Table 32: China Glyoxal Industry Volume (K Tons) Forecast, by Application 2019 & 2032
- Table 33: Japan Glyoxal Industry Revenue (Million) Forecast, by Application 2019 & 2032
- Table 34: Japan Glyoxal Industry Volume (K Tons) Forecast, by Application 2019 & 2032
- Table 35: India Glyoxal Industry Revenue (Million) Forecast, by Application 2019 & 2032
- Table 36: India Glyoxal Industry Volume (K Tons) Forecast, by Application 2019 & 2032
- Table 37: South Korea Glyoxal Industry Revenue (Million) Forecast, by Application 2019 & 2032
- Table 38: South Korea Glyoxal Industry Volume (K Tons) Forecast, by Application 2019 & 2032
- Table 39: Taiwan Glyoxal Industry Revenue (Million) Forecast, by Application 2019 & 2032
- Table 40: Taiwan Glyoxal Industry Volume (K Tons) Forecast, by Application 2019 & 2032
- Table 41: Australia Glyoxal Industry Revenue (Million) Forecast, by Application 2019 & 2032
- Table 42: Australia Glyoxal Industry Volume (K Tons) Forecast, by Application 2019 & 2032
- Table 43: Rest of Asia-Pacific Glyoxal Industry Revenue (Million) Forecast, by Application 2019 & 2032
- Table 44: Rest of Asia-Pacific Glyoxal Industry Volume (K Tons) Forecast, by Application 2019 & 2032
- Table 45: Global Glyoxal Industry Revenue Million Forecast, by Country 2019 & 2032
- Table 46: Global Glyoxal Industry Volume K Tons Forecast, by Country 2019 & 2032
- Table 47: Brazil Glyoxal Industry Revenue (Million) Forecast, by Application 2019 & 2032
- Table 48: Brazil Glyoxal Industry Volume (K Tons) Forecast, by Application 2019 & 2032
- Table 49: Argentina Glyoxal Industry Revenue (Million) Forecast, by Application 2019 & 2032
- Table 50: Argentina Glyoxal Industry Volume (K Tons) Forecast, by Application 2019 & 2032
- Table 51: Rest of South America Glyoxal Industry Revenue (Million) Forecast, by Application 2019 & 2032
- Table 52: Rest of South America Glyoxal Industry Volume (K Tons) Forecast, by Application 2019 & 2032
- Table 53: Global Glyoxal Industry Revenue Million Forecast, by Country 2019 & 2032
- Table 54: Global Glyoxal Industry Volume K Tons Forecast, by Country 2019 & 2032
- Table 55: Middle East Glyoxal Industry Revenue (Million) Forecast, by Application 2019 & 2032
- Table 56: Middle East Glyoxal Industry Volume (K Tons) Forecast, by Application 2019 & 2032
- Table 57: Africa Glyoxal Industry Revenue (Million) Forecast, by Application 2019 & 2032
- Table 58: Africa Glyoxal Industry Volume (K Tons) Forecast, by Application 2019 & 2032
- Table 59: Global Glyoxal Industry Revenue Million Forecast, by Application 2019 & 2032
- Table 60: Global Glyoxal Industry Volume K Tons Forecast, by Application 2019 & 2032
- Table 61: Global Glyoxal Industry Revenue Million Forecast, by Country 2019 & 2032
- Table 62: Global Glyoxal Industry Volume K Tons Forecast, by Country 2019 & 2032
- Table 63: China Glyoxal Industry Revenue (Million) Forecast, by Application 2019 & 2032
- Table 64: China Glyoxal Industry Volume (K Tons) Forecast, by Application 2019 & 2032
- Table 65: India Glyoxal Industry Revenue (Million) Forecast, by Application 2019 & 2032
- Table 66: India Glyoxal Industry Volume (K Tons) Forecast, by Application 2019 & 2032
- Table 67: Japan Glyoxal Industry Revenue (Million) Forecast, by Application 2019 & 2032
- Table 68: Japan Glyoxal Industry Volume (K Tons) Forecast, by Application 2019 & 2032
- Table 69: South Korea Glyoxal Industry Revenue (Million) Forecast, by Application 2019 & 2032
- Table 70: South Korea Glyoxal Industry Volume (K Tons) Forecast, by Application 2019 & 2032
- Table 71: Rest of Asia Pacific Glyoxal Industry Revenue (Million) Forecast, by Application 2019 & 2032
- Table 72: Rest of Asia Pacific Glyoxal Industry Volume (K Tons) Forecast, by Application 2019 & 2032
- Table 73: Global Glyoxal Industry Revenue Million Forecast, by Application 2019 & 2032
- Table 74: Global Glyoxal Industry Volume K Tons Forecast, by Application 2019 & 2032
- Table 75: Global Glyoxal Industry Revenue Million Forecast, by Country 2019 & 2032
- Table 76: Global Glyoxal Industry Volume K Tons Forecast, by Country 2019 & 2032
- Table 77: United States Glyoxal Industry Revenue (Million) Forecast, by Application 2019 & 2032
- Table 78: United States Glyoxal Industry Volume (K Tons) Forecast, by Application 2019 & 2032
- Table 79: Canada Glyoxal Industry Revenue (Million) Forecast, by Application 2019 & 2032
- Table 80: Canada Glyoxal Industry Volume (K Tons) Forecast, by Application 2019 & 2032
- Table 81: Mexico Glyoxal Industry Revenue (Million) Forecast, by Application 2019 & 2032
- Table 82: Mexico Glyoxal Industry Volume (K Tons) Forecast, by Application 2019 & 2032
- Table 83: Global Glyoxal Industry Revenue Million Forecast, by Application 2019 & 2032
- Table 84: Global Glyoxal Industry Volume K Tons Forecast, by Application 2019 & 2032
- Table 85: Global Glyoxal Industry Revenue Million Forecast, by Country 2019 & 2032
- Table 86: Global Glyoxal Industry Volume K Tons Forecast, by Country 2019 & 2032
- Table 87: Germany Glyoxal Industry Revenue (Million) Forecast, by Application 2019 & 2032
- Table 88: Germany Glyoxal Industry Volume (K Tons) Forecast, by Application 2019 & 2032
- Table 89: United Kingdom Glyoxal Industry Revenue (Million) Forecast, by Application 2019 & 2032
- Table 90: United Kingdom Glyoxal Industry Volume (K Tons) Forecast, by Application 2019 & 2032
- Table 91: Italy Glyoxal Industry Revenue (Million) Forecast, by Application 2019 & 2032
- Table 92: Italy Glyoxal Industry Volume (K Tons) Forecast, by Application 2019 & 2032
- Table 93: France Glyoxal Industry Revenue (Million) Forecast, by Application 2019 & 2032
- Table 94: France Glyoxal Industry Volume (K Tons) Forecast, by Application 2019 & 2032
- Table 95: Rest of Europe Glyoxal Industry Revenue (Million) Forecast, by Application 2019 & 2032
- Table 96: Rest of Europe Glyoxal Industry Volume (K Tons) Forecast, by Application 2019 & 2032
- Table 97: Global Glyoxal Industry Revenue Million Forecast, by Application 2019 & 2032
- Table 98: Global Glyoxal Industry Volume K Tons Forecast, by Application 2019 & 2032
- Table 99: Global Glyoxal Industry Revenue Million Forecast, by Country 2019 & 2032
- Table 100: Global Glyoxal Industry Volume K Tons Forecast, by Country 2019 & 2032
- Table 101: Brazil Glyoxal Industry Revenue (Million) Forecast, by Application 2019 & 2032
- Table 102: Brazil Glyoxal Industry Volume (K Tons) Forecast, by Application 2019 & 2032
- Table 103: Argentina Glyoxal Industry Revenue (Million) Forecast, by Application 2019 & 2032
- Table 104: Argentina Glyoxal Industry Volume (K Tons) Forecast, by Application 2019 & 2032
- Table 105: Rest of South America Glyoxal Industry Revenue (Million) Forecast, by Application 2019 & 2032
- Table 106: Rest of South America Glyoxal Industry Volume (K Tons) Forecast, by Application 2019 & 2032
- Table 107: Global Glyoxal Industry Revenue Million Forecast, by Application 2019 & 2032
- Table 108: Global Glyoxal Industry Volume K Tons Forecast, by Application 2019 & 2032
- Table 109: Global Glyoxal Industry Revenue Million Forecast, by Country 2019 & 2032
- Table 110: Global Glyoxal Industry Volume K Tons Forecast, by Country 2019 & 2032
- Table 111: Global Glyoxal Industry Revenue Million Forecast, by Application 2019 & 2032
- Table 112: Global Glyoxal Industry Volume K Tons Forecast, by Application 2019 & 2032
- Table 113: Global Glyoxal Industry Revenue Million Forecast, by Country 2019 & 2032
- Table 114: Global Glyoxal Industry Volume K Tons Forecast, by Country 2019 & 2032
- Table 115: South Africa Glyoxal Industry Revenue (Million) Forecast, by Application 2019 & 2032
- Table 116: South Africa Glyoxal Industry Volume (K Tons) Forecast, by Application 2019 & 2032
- Table 117: Rest of Middle East Glyoxal Industry Revenue (Million) Forecast, by Application 2019 & 2032
- Table 118: Rest of Middle East Glyoxal Industry Volume (K Tons) Forecast, by Application 2019 & 2032
Frequently Asked Questions
1. What is the projected Compound Annual Growth Rate (CAGR) of the Glyoxal Industry?
The projected CAGR is approximately 5.8%.
2. Which companies are prominent players in the Glyoxal Industry?
Key companies in the market include Haihang Industry, INEOS, Amzole India Pvt Ltd, Tokyo Chemical Industry Co Ltd, WeylChem International GmbH, BASF SE, Hubei Hongyuan Pharmaceutical Technology Co Ltd, Toronto Research Chemicals, Zhonglan Industry Co Ltd, Thermo Fisher Scientific.
3. What are the main segments of the Glyoxal Industry?
The market segments include Application.
4. Can you provide details about the market size?
The market size is estimated to be USD 308.12 Million as of 2022.
5. What are some drivers contributing to market growth?
; Increasing Applications of Glyoxal in Fabrics; Growing Demand for Glyoxal as an Intermediate.
6. What are the notable trends driving market growth?
Increasing Demand for Glyoxal as an Intermediate and Crosslinkers.
7. Are there any restraints impacting market growth?
; Associated Health Issues; Unfavorable Conditions Arising due to the Impact of COVID-19; Other Restraints.
8. Can you provide examples of recent developments in the market?
N/A
9. What pricing options are available for accessing the report?
Pricing options include single-user, multi-user, and enterprise licenses priced at USD 4750, USD 5250, and USD 8750 respectively.
10. Is the market size provided in terms of value or volume?
The market size is provided in terms of value, measured in Million and volume, measured in K Tons.
11. Are there any specific market keywords associated with the report?
Yes, the market keyword associated with the report is "Glyoxal Industry," which aids in identifying and referencing the specific market segment covered.
12. How do I determine which pricing option suits my needs best?
The pricing options vary based on user requirements and access needs. Individual users may opt for single-user licenses, while businesses requiring broader access may choose multi-user or enterprise licenses for cost-effective access to the report.
13. Are there any additional resources or data provided in the Glyoxal Industry report?
While the report offers comprehensive insights, it's advisable to review the specific contents or supplementary materials provided to ascertain if additional resources or data are available.
14. How can I stay updated on further developments or reports in the Glyoxal Industry?
To stay informed about further developments, trends, and reports in the Glyoxal Industry, consider subscribing to industry newsletters, following relevant companies and organizations, or regularly checking reputable industry news sources and publications.
Methodology
Step 1 - Identification of Relevant Samples Size from Population Database


Step 2 - Approaches for Defining Global Market Size (Value, Volume* & Price*)

Note*: In applicable scenarios
Step 3 - Data Sources
Primary Research
- Web Analytics
- Survey Reports
- Research Institute
- Latest Research Reports
- Opinion Leaders
Secondary Research
- Annual Reports
- White Paper
- Latest Press Release
- Industry Association
- Paid Database
- Investor Presentations

Step 4 - Data Triangulation
Involves using different sources of information in order to increase the validity of a study
These sources are likely to be stakeholders in a program - participants, other researchers, program staff, other community members, and so on.
Then we put all data in single framework & apply various statistical tools to find out the dynamic on the market.
During the analysis stage, feedback from the stakeholder groups would be compared to determine areas of agreement as well as areas of divergence
