

Key Insights
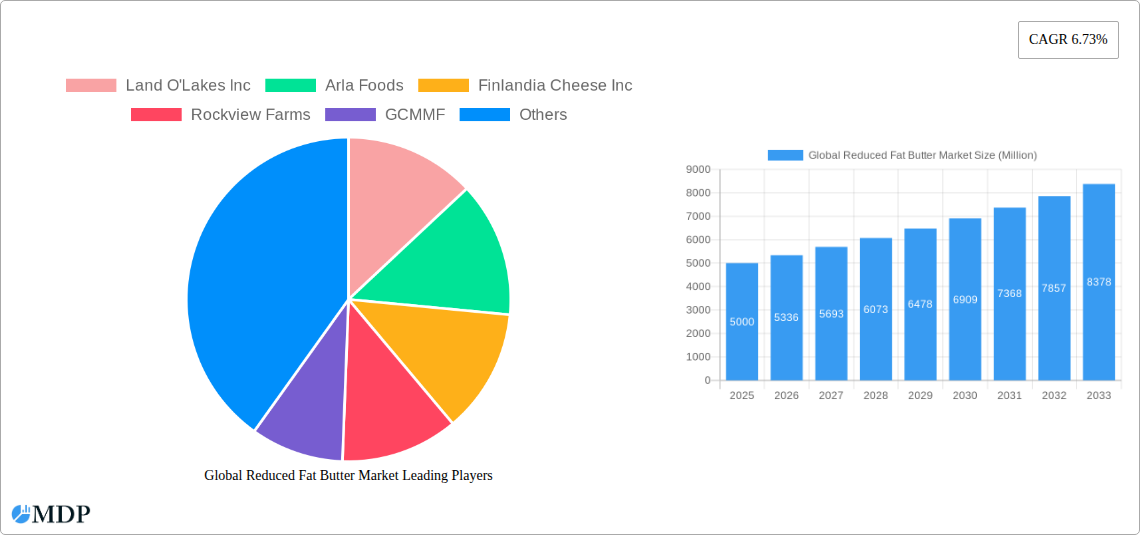
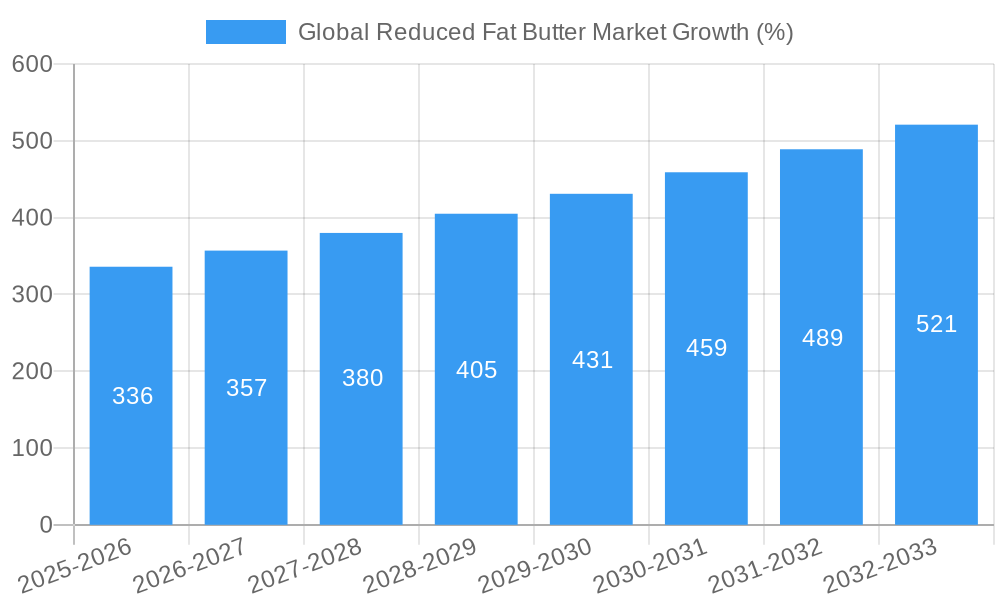
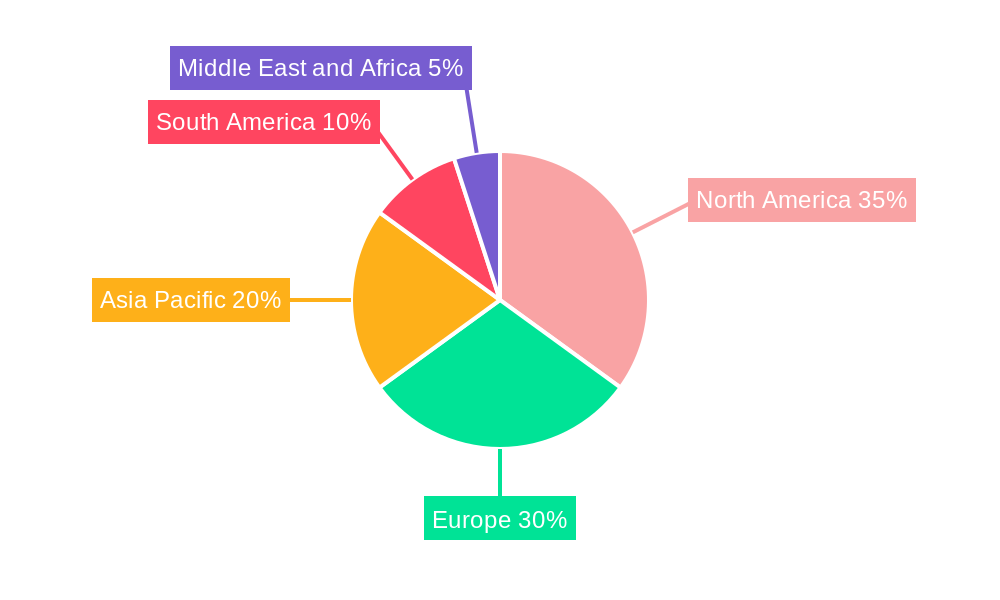
The global reduced-fat butter market, valued at approximately $5 billion in 2025, is projected to experience robust growth, driven by increasing health consciousness among consumers and a rising preference for healthier alternatives to full-fat butter. A Compound Annual Growth Rate (CAGR) of 6.73% from 2025 to 2033 indicates a substantial market expansion. Key drivers include the growing prevalence of obesity and related health issues, leading consumers to seek lower-fat dairy options. Furthermore, increasing awareness of the link between saturated fat intake and cardiovascular disease fuels demand for reduced-fat butter. Market trends reflect innovation in product formulations, with manufacturers focusing on improved taste and texture to enhance consumer acceptance. The rise of online retail channels also contributes to market expansion, offering greater convenience and access to a wider variety of products. However, the market faces certain restraints, such as the perception that reduced-fat butter compromises taste and the competition from alternative spreads like margarine and plant-based butters. Segmentation reveals that spreadable reduced-fat butter holds a larger market share compared to its non-spreadable counterpart, driven by convenience. Supermarkets and hypermarkets remain dominant distribution channels, although online retailers are witnessing significant growth. Salted reduced-fat butter is currently the preferred type, but unsalted variants are gaining traction due to their versatility in culinary applications. Major players like Land O'Lakes, Arla Foods, and Unilever are actively involved in product development and market expansion, fostering competition and innovation. Regional analysis suggests North America and Europe currently dominate the market, but Asia-Pacific is projected to witness significant growth in the coming years, driven by rising disposable incomes and changing dietary habits.
The continued growth of the reduced-fat butter market hinges on sustained consumer demand for healthier alternatives and further innovation in product development. Manufacturers are focusing on addressing consumer concerns regarding taste and texture through improved formulations and technological advancements. The successful integration of sustainable sourcing practices and eco-friendly packaging also plays a crucial role in maintaining market appeal. Emerging markets in Asia-Pacific and other developing regions offer considerable growth potential, requiring strategic expansion efforts by established players. Competition from alternative spreads will continue to shape market dynamics, making it essential for manufacturers to differentiate their products through unique value propositions and targeted marketing strategies. The successful navigation of these factors will determine the long-term trajectory of the global reduced-fat butter market.
Unlock the Potential of the Global Reduced Fat Butter Market: A Comprehensive Report (2019-2033)
This in-depth report provides a comprehensive analysis of the global reduced fat butter market, offering invaluable insights for industry stakeholders, investors, and businesses seeking to navigate this dynamic landscape. With a focus on market dynamics, leading players, and future trends, this report is your essential guide to understanding and capitalizing on the opportunities within the reduced fat butter sector. The study period covers 2019-2033, with a base year of 2025 and a forecast period of 2025-2033. The report leverages data from the historical period of 2019-2024 to project future market trends accurately. The global market size in 2025 is estimated at xx Million.
Global Reduced Fat Butter Market Market Dynamics & Concentration
The global reduced fat butter market exhibits a moderately concentrated landscape, with key players like Land O'Lakes Inc, Arla Foods, Finlandia Cheese Inc, Rockview Farms, GCMMF, Ornua Co-operative Limited, Raisio Group plc, Unilever (Upfield), SAVENCIA SA, and Saputo Inc. holding significant market share. However, the market is also characterized by the presence of several smaller regional players and emerging brands. Market concentration is further influenced by factors such as mergers and acquisitions (M&A) activities, which have seen approximately xx deals in the last five years, resulting in a xx% increase in market consolidation. Innovation is a key driver, with companies focusing on developing products with improved taste and texture, while adhering to health-conscious consumer preferences. Stringent regulatory frameworks governing food safety and labeling standards influence the market dynamics and create opportunities for manufacturers meeting these requirements. The market also faces competitive pressure from product substitutes such as margarine and plant-based butter alternatives. Shifting consumer trends towards healthier eating habits, increasing awareness of health benefits (reduced fat), and changing lifestyles drive demand.
- Market Share: The top 5 players hold approximately xx% of the global market share (2025).
- M&A Activity: An average of xx M&A deals annually between 2020 and 2024.
- Innovation: Focus on improved taste, texture, and healthier formulations.
- Regulatory Landscape: Stringent food safety and labeling regulations.
Global Reduced Fat Butter Market Industry Trends & Analysis
The global reduced fat butter market is projected to experience robust growth, with a Compound Annual Growth Rate (CAGR) of xx% during the forecast period (2025-2033). This growth is primarily driven by increasing consumer demand for healthier food options, rising disposable incomes in developing economies, and a growing preference for convenient and ready-to-eat products. The market penetration of reduced-fat butter is increasing steadily, particularly in developed countries where awareness of health benefits is higher. Technological advancements in food processing and packaging enhance product quality and shelf life. The competitive landscape is intensifying, with major players focusing on product differentiation, brand building, and strategic partnerships to maintain market share. Consumer preferences are also shifting towards organic and sustainably sourced products, creating opportunities for companies that can meet these demands.
Leading Markets & Segments in Global Reduced Fat Butter Market
The North American region is currently the leading market for reduced-fat butter, driven by factors such as high consumer spending power, strong preference for convenience foods, and established distribution networks. Within this region, the United States dominates due to its large population and robust food retail sector.
Segment Dominance:
- By Form: Spreadable reduced-fat butter holds a larger market share compared to non-spreadable butter due to convenience and ease of use.
- By Distribution Channel: Supermarkets/hypermarkets are the primary distribution channel, owing to their extensive reach and established presence.
- By Type: Salted reduced-fat butter has a slightly higher market share than unsalted due to consumer preference.
Key Drivers for North American Market Dominance:
- Strong consumer demand for convenient and healthy food products.
- Well-established retail infrastructure and distribution networks.
- High disposable income levels among consumers.
Growth in other Regions: While North America leads, significant growth opportunities exist in Asia-Pacific, driven by rising incomes and changing dietary habits.
Global Reduced Fat Butter Market Product Developments
Recent product innovations focus on enhancing the taste and texture of reduced-fat butter to match or exceed that of full-fat options. This includes the utilization of advanced processing techniques and the incorporation of natural flavor enhancers. Manufacturers are also increasingly focusing on producing organic and sustainably sourced reduced-fat butter to cater to the growing demand for environmentally friendly products. These innovations, coupled with attractive packaging and branding strategies, improve market acceptance.
Key Drivers of Global Reduced Fat Butter Market Growth
The growth of the global reduced-fat butter market is driven by several factors:
- Health-conscious Consumers: Increasing awareness of the health benefits of reduced-fat diets fuels demand.
- Technological Advancements: Improved processing techniques enhance taste and texture of reduced-fat butter.
- Expanding Retail Channels: Online sales and convenient store distribution increase accessibility.
Challenges in the Global Reduced Fat Butter Market Market
The market faces challenges such as fluctuations in raw material prices (e.g., milk), impacting profitability. Stringent food safety and labeling regulations necessitate compliance costs. Competition from other spreadable fats and plant-based alternatives puts pressure on market share. These factors are estimated to collectively reduce the market growth by approximately xx% by 2033.
Emerging Opportunities in Global Reduced Fat Butter Market
Emerging opportunities lie in the expansion into developing markets with rising disposable incomes and changing consumer preferences. The market also has potential in innovations like functional reduced-fat butter enriched with added nutrients. Strategic partnerships and investments in sustainable sourcing practices enhance brand image and attract health-conscious buyers.
Leading Players in the Global Reduced Fat Butter Market Sector
- Land O'Lakes Inc
- Arla Foods
- Finlandia Cheese Inc
- Rockview Farms
- GCMMF
- Ornua Co-operative Limited
- Raisio Group plc
- Unilever (Upfield)
- SAVENCIA SA
- Saputo Inc
Key Milestones in Global Reduced Fat Butter Industry
- 2020: Unilever launches a new range of sustainably sourced reduced-fat butter.
- 2022: Arla Foods invests in advanced processing technology to improve the texture of its reduced-fat butter.
- 2023: A major merger between two mid-sized reduced-fat butter producers leads to increased market consolidation.
Strategic Outlook for Global Reduced Fat Butter Market Market
The future of the global reduced-fat butter market looks promising, with continued growth driven by health consciousness and innovation. Companies adopting sustainable practices, focusing on product differentiation, and expanding into new markets will be well-positioned for success. Strategic partnerships and investments in research and development will be crucial for maintaining competitiveness and capitalizing on long-term growth opportunities. The market is expected to reach xx Million by 2033.
Global Reduced Fat Butter Market Segmentation
-
1. Type
- 1.1. Salted
- 1.2. Unsalted
-
2. Form
- 2.1. Spreadable
- 2.2. Non-spreadable
-
3. Distribution Channel
- 3.1. Supermarkets/Hypermarkets
- 3.2. Convenience Stores
- 3.3. Online Retailers
- 3.4. Other Distribution Channels
Global Reduced Fat Butter Market Segmentation By Geography
-
1. North America
- 1.1. United States
- 1.2. Canada
- 1.3. Mexico
- 1.4. Rest of North America
-
2. Europe
- 2.1. Spain
- 2.2. United Kingdom
- 2.3. Germany
- 2.4. France
- 2.5. Italy
- 2.6. Russia
- 2.7. Rest of Europe
-
3. Asia Pacific
- 3.1. China
- 3.2. Japan
- 3.3. India
- 3.4. Australia
- 3.5. Rest of Asia Pacific
-
4. South America
- 4.1. Brazil
- 4.2. Argentina
- 4.3. Rest of South America
-
5. Middle East and Africa
- 5.1. South Africa
- 5.2. Saudi Arabia
- 5.3. Rest of Middle East and Africa
Global Reduced Fat Butter Market REPORT HIGHLIGHTS
| Aspects | Details |
|---|---|
| Study Period | 2019-2033 |
| Base Year | 2024 |
| Estimated Year | 2025 |
| Forecast Period | 2025-2033 |
| Historical Period | 2019-2024 |
| Growth Rate | CAGR of 6.73% from 2019-2033 |
| Segmentation |
|
Table of Contents
- 1. Introduction
- 1.1. Research Scope
- 1.2. Market Segmentation
- 1.3. Research Methodology
- 1.4. Definitions and Assumptions
- 2. Executive Summary
- 2.1. Introduction
- 3. Market Dynamics
- 3.1. Introduction
- 3.2. Market Drivers
- 3.2.1. Increasing application of Gelatin in healthcare and pharmaceutical sector
- 3.3. Market Restrains
- 3.3.1. Rising demand for clean label products
- 3.4. Market Trends
- 3.4.1. Surge in Demand for Low Fat and Low Calorie Food Products
- 4. Market Factor Analysis
- 4.1. Porters Five Forces
- 4.2. Supply/Value Chain
- 4.3. PESTEL analysis
- 4.4. Market Entropy
- 4.5. Patent/Trademark Analysis
- 5. Global Reduced Fat Butter Market Analysis, Insights and Forecast, 2019-2031
- 5.1. Market Analysis, Insights and Forecast - by Type
- 5.1.1. Salted
- 5.1.2. Unsalted
- 5.2. Market Analysis, Insights and Forecast - by Form
- 5.2.1. Spreadable
- 5.2.2. Non-spreadable
- 5.3. Market Analysis, Insights and Forecast - by Distribution Channel
- 5.3.1. Supermarkets/Hypermarkets
- 5.3.2. Convenience Stores
- 5.3.3. Online Retailers
- 5.3.4. Other Distribution Channels
- 5.4. Market Analysis, Insights and Forecast - by Region
- 5.4.1. North America
- 5.4.2. Europe
- 5.4.3. Asia Pacific
- 5.4.4. South America
- 5.4.5. Middle East and Africa
- 5.1. Market Analysis, Insights and Forecast - by Type
- 6. North America Global Reduced Fat Butter Market Analysis, Insights and Forecast, 2019-2031
- 6.1. Market Analysis, Insights and Forecast - by Type
- 6.1.1. Salted
- 6.1.2. Unsalted
- 6.2. Market Analysis, Insights and Forecast - by Form
- 6.2.1. Spreadable
- 6.2.2. Non-spreadable
- 6.3. Market Analysis, Insights and Forecast - by Distribution Channel
- 6.3.1. Supermarkets/Hypermarkets
- 6.3.2. Convenience Stores
- 6.3.3. Online Retailers
- 6.3.4. Other Distribution Channels
- 6.1. Market Analysis, Insights and Forecast - by Type
- 7. Europe Global Reduced Fat Butter Market Analysis, Insights and Forecast, 2019-2031
- 7.1. Market Analysis, Insights and Forecast - by Type
- 7.1.1. Salted
- 7.1.2. Unsalted
- 7.2. Market Analysis, Insights and Forecast - by Form
- 7.2.1. Spreadable
- 7.2.2. Non-spreadable
- 7.3. Market Analysis, Insights and Forecast - by Distribution Channel
- 7.3.1. Supermarkets/Hypermarkets
- 7.3.2. Convenience Stores
- 7.3.3. Online Retailers
- 7.3.4. Other Distribution Channels
- 7.1. Market Analysis, Insights and Forecast - by Type
- 8. Asia Pacific Global Reduced Fat Butter Market Analysis, Insights and Forecast, 2019-2031
- 8.1. Market Analysis, Insights and Forecast - by Type
- 8.1.1. Salted
- 8.1.2. Unsalted
- 8.2. Market Analysis, Insights and Forecast - by Form
- 8.2.1. Spreadable
- 8.2.2. Non-spreadable
- 8.3. Market Analysis, Insights and Forecast - by Distribution Channel
- 8.3.1. Supermarkets/Hypermarkets
- 8.3.2. Convenience Stores
- 8.3.3. Online Retailers
- 8.3.4. Other Distribution Channels
- 8.1. Market Analysis, Insights and Forecast - by Type
- 9. South America Global Reduced Fat Butter Market Analysis, Insights and Forecast, 2019-2031
- 9.1. Market Analysis, Insights and Forecast - by Type
- 9.1.1. Salted
- 9.1.2. Unsalted
- 9.2. Market Analysis, Insights and Forecast - by Form
- 9.2.1. Spreadable
- 9.2.2. Non-spreadable
- 9.3. Market Analysis, Insights and Forecast - by Distribution Channel
- 9.3.1. Supermarkets/Hypermarkets
- 9.3.2. Convenience Stores
- 9.3.3. Online Retailers
- 9.3.4. Other Distribution Channels
- 9.1. Market Analysis, Insights and Forecast - by Type
- 10. Middle East and Africa Global Reduced Fat Butter Market Analysis, Insights and Forecast, 2019-2031
- 10.1. Market Analysis, Insights and Forecast - by Type
- 10.1.1. Salted
- 10.1.2. Unsalted
- 10.2. Market Analysis, Insights and Forecast - by Form
- 10.2.1. Spreadable
- 10.2.2. Non-spreadable
- 10.3. Market Analysis, Insights and Forecast - by Distribution Channel
- 10.3.1. Supermarkets/Hypermarkets
- 10.3.2. Convenience Stores
- 10.3.3. Online Retailers
- 10.3.4. Other Distribution Channels
- 10.1. Market Analysis, Insights and Forecast - by Type
- 11. North America Global Reduced Fat Butter Market Analysis, Insights and Forecast, 2019-2031
- 11.1. Market Analysis, Insights and Forecast - By Country/Sub-region
- 11.1.1 United States
- 11.1.2 Canada
- 11.1.3 Mexico
- 11.1.4 Rest of North America
- 12. Europe Global Reduced Fat Butter Market Analysis, Insights and Forecast, 2019-2031
- 12.1. Market Analysis, Insights and Forecast - By Country/Sub-region
- 12.1.1 Spain
- 12.1.2 United Kingdom
- 12.1.3 Germany
- 12.1.4 France
- 12.1.5 Italy
- 12.1.6 Russia
- 12.1.7 Rest of Europe
- 13. Asia Pacific Global Reduced Fat Butter Market Analysis, Insights and Forecast, 2019-2031
- 13.1. Market Analysis, Insights and Forecast - By Country/Sub-region
- 13.1.1 China
- 13.1.2 Japan
- 13.1.3 India
- 13.1.4 Australia
- 13.1.5 Rest of Asia Pacific
- 14. South America Global Reduced Fat Butter Market Analysis, Insights and Forecast, 2019-2031
- 14.1. Market Analysis, Insights and Forecast - By Country/Sub-region
- 14.1.1 Brazil
- 14.1.2 Argentina
- 14.1.3 Rest of South America
- 15. Middle East and Africa Global Reduced Fat Butter Market Analysis, Insights and Forecast, 2019-2031
- 15.1. Market Analysis, Insights and Forecast - By Country/Sub-region
- 15.1.1 South Africa
- 15.1.2 Saudi Arabia
- 15.1.3 Rest of Middle East and Africa
- 16. Competitive Analysis
- 16.1. Market Share Analysis 2024
- 16.2. Company Profiles
- 16.2.1 Land O'Lakes Inc
- 16.2.1.1. Overview
- 16.2.1.2. Products
- 16.2.1.3. SWOT Analysis
- 16.2.1.4. Recent Developments
- 16.2.1.5. Financials (Based on Availability)
- 16.2.2 Arla Foods
- 16.2.2.1. Overview
- 16.2.2.2. Products
- 16.2.2.3. SWOT Analysis
- 16.2.2.4. Recent Developments
- 16.2.2.5. Financials (Based on Availability)
- 16.2.3 Finlandia Cheese Inc
- 16.2.3.1. Overview
- 16.2.3.2. Products
- 16.2.3.3. SWOT Analysis
- 16.2.3.4. Recent Developments
- 16.2.3.5. Financials (Based on Availability)
- 16.2.4 Rockview Farms
- 16.2.4.1. Overview
- 16.2.4.2. Products
- 16.2.4.3. SWOT Analysis
- 16.2.4.4. Recent Developments
- 16.2.4.5. Financials (Based on Availability)
- 16.2.5 GCMMF
- 16.2.5.1. Overview
- 16.2.5.2. Products
- 16.2.5.3. SWOT Analysis
- 16.2.5.4. Recent Developments
- 16.2.5.5. Financials (Based on Availability)
- 16.2.6 Ornua Co-operative Limited
- 16.2.6.1. Overview
- 16.2.6.2. Products
- 16.2.6.3. SWOT Analysis
- 16.2.6.4. Recent Developments
- 16.2.6.5. Financials (Based on Availability)
- 16.2.7 Raisio Group plc*List Not Exhaustive
- 16.2.7.1. Overview
- 16.2.7.2. Products
- 16.2.7.3. SWOT Analysis
- 16.2.7.4. Recent Developments
- 16.2.7.5. Financials (Based on Availability)
- 16.2.8 Unilever (Upfield)
- 16.2.8.1. Overview
- 16.2.8.2. Products
- 16.2.8.3. SWOT Analysis
- 16.2.8.4. Recent Developments
- 16.2.8.5. Financials (Based on Availability)
- 16.2.9 SAVENCIA SA
- 16.2.9.1. Overview
- 16.2.9.2. Products
- 16.2.9.3. SWOT Analysis
- 16.2.9.4. Recent Developments
- 16.2.9.5. Financials (Based on Availability)
- 16.2.10 Saputo Inc
- 16.2.10.1. Overview
- 16.2.10.2. Products
- 16.2.10.3. SWOT Analysis
- 16.2.10.4. Recent Developments
- 16.2.10.5. Financials (Based on Availability)
- 16.2.1 Land O'Lakes Inc
List of Figures
- Figure 1: Global Global Reduced Fat Butter Market Revenue Breakdown (Million, %) by Region 2024 & 2032
- Figure 2: Global Global Reduced Fat Butter Market Volume Breakdown (K Units, %) by Region 2024 & 2032
- Figure 3: North America Global Reduced Fat Butter Market Revenue (Million), by Country 2024 & 2032
- Figure 4: North America Global Reduced Fat Butter Market Volume (K Units), by Country 2024 & 2032
- Figure 5: North America Global Reduced Fat Butter Market Revenue Share (%), by Country 2024 & 2032
- Figure 6: North America Global Reduced Fat Butter Market Volume Share (%), by Country 2024 & 2032
- Figure 7: Europe Global Reduced Fat Butter Market Revenue (Million), by Country 2024 & 2032
- Figure 8: Europe Global Reduced Fat Butter Market Volume (K Units), by Country 2024 & 2032
- Figure 9: Europe Global Reduced Fat Butter Market Revenue Share (%), by Country 2024 & 2032
- Figure 10: Europe Global Reduced Fat Butter Market Volume Share (%), by Country 2024 & 2032
- Figure 11: Asia Pacific Global Reduced Fat Butter Market Revenue (Million), by Country 2024 & 2032
- Figure 12: Asia Pacific Global Reduced Fat Butter Market Volume (K Units), by Country 2024 & 2032
- Figure 13: Asia Pacific Global Reduced Fat Butter Market Revenue Share (%), by Country 2024 & 2032
- Figure 14: Asia Pacific Global Reduced Fat Butter Market Volume Share (%), by Country 2024 & 2032
- Figure 15: South America Global Reduced Fat Butter Market Revenue (Million), by Country 2024 & 2032
- Figure 16: South America Global Reduced Fat Butter Market Volume (K Units), by Country 2024 & 2032
- Figure 17: South America Global Reduced Fat Butter Market Revenue Share (%), by Country 2024 & 2032
- Figure 18: South America Global Reduced Fat Butter Market Volume Share (%), by Country 2024 & 2032
- Figure 19: Middle East and Africa Global Reduced Fat Butter Market Revenue (Million), by Country 2024 & 2032
- Figure 20: Middle East and Africa Global Reduced Fat Butter Market Volume (K Units), by Country 2024 & 2032
- Figure 21: Middle East and Africa Global Reduced Fat Butter Market Revenue Share (%), by Country 2024 & 2032
- Figure 22: Middle East and Africa Global Reduced Fat Butter Market Volume Share (%), by Country 2024 & 2032
- Figure 23: North America Global Reduced Fat Butter Market Revenue (Million), by Type 2024 & 2032
- Figure 24: North America Global Reduced Fat Butter Market Volume (K Units), by Type 2024 & 2032
- Figure 25: North America Global Reduced Fat Butter Market Revenue Share (%), by Type 2024 & 2032
- Figure 26: North America Global Reduced Fat Butter Market Volume Share (%), by Type 2024 & 2032
- Figure 27: North America Global Reduced Fat Butter Market Revenue (Million), by Form 2024 & 2032
- Figure 28: North America Global Reduced Fat Butter Market Volume (K Units), by Form 2024 & 2032
- Figure 29: North America Global Reduced Fat Butter Market Revenue Share (%), by Form 2024 & 2032
- Figure 30: North America Global Reduced Fat Butter Market Volume Share (%), by Form 2024 & 2032
- Figure 31: North America Global Reduced Fat Butter Market Revenue (Million), by Distribution Channel 2024 & 2032
- Figure 32: North America Global Reduced Fat Butter Market Volume (K Units), by Distribution Channel 2024 & 2032
- Figure 33: North America Global Reduced Fat Butter Market Revenue Share (%), by Distribution Channel 2024 & 2032
- Figure 34: North America Global Reduced Fat Butter Market Volume Share (%), by Distribution Channel 2024 & 2032
- Figure 35: North America Global Reduced Fat Butter Market Revenue (Million), by Country 2024 & 2032
- Figure 36: North America Global Reduced Fat Butter Market Volume (K Units), by Country 2024 & 2032
- Figure 37: North America Global Reduced Fat Butter Market Revenue Share (%), by Country 2024 & 2032
- Figure 38: North America Global Reduced Fat Butter Market Volume Share (%), by Country 2024 & 2032
- Figure 39: Europe Global Reduced Fat Butter Market Revenue (Million), by Type 2024 & 2032
- Figure 40: Europe Global Reduced Fat Butter Market Volume (K Units), by Type 2024 & 2032
- Figure 41: Europe Global Reduced Fat Butter Market Revenue Share (%), by Type 2024 & 2032
- Figure 42: Europe Global Reduced Fat Butter Market Volume Share (%), by Type 2024 & 2032
- Figure 43: Europe Global Reduced Fat Butter Market Revenue (Million), by Form 2024 & 2032
- Figure 44: Europe Global Reduced Fat Butter Market Volume (K Units), by Form 2024 & 2032
- Figure 45: Europe Global Reduced Fat Butter Market Revenue Share (%), by Form 2024 & 2032
- Figure 46: Europe Global Reduced Fat Butter Market Volume Share (%), by Form 2024 & 2032
- Figure 47: Europe Global Reduced Fat Butter Market Revenue (Million), by Distribution Channel 2024 & 2032
- Figure 48: Europe Global Reduced Fat Butter Market Volume (K Units), by Distribution Channel 2024 & 2032
- Figure 49: Europe Global Reduced Fat Butter Market Revenue Share (%), by Distribution Channel 2024 & 2032
- Figure 50: Europe Global Reduced Fat Butter Market Volume Share (%), by Distribution Channel 2024 & 2032
- Figure 51: Europe Global Reduced Fat Butter Market Revenue (Million), by Country 2024 & 2032
- Figure 52: Europe Global Reduced Fat Butter Market Volume (K Units), by Country 2024 & 2032
- Figure 53: Europe Global Reduced Fat Butter Market Revenue Share (%), by Country 2024 & 2032
- Figure 54: Europe Global Reduced Fat Butter Market Volume Share (%), by Country 2024 & 2032
- Figure 55: Asia Pacific Global Reduced Fat Butter Market Revenue (Million), by Type 2024 & 2032
- Figure 56: Asia Pacific Global Reduced Fat Butter Market Volume (K Units), by Type 2024 & 2032
- Figure 57: Asia Pacific Global Reduced Fat Butter Market Revenue Share (%), by Type 2024 & 2032
- Figure 58: Asia Pacific Global Reduced Fat Butter Market Volume Share (%), by Type 2024 & 2032
- Figure 59: Asia Pacific Global Reduced Fat Butter Market Revenue (Million), by Form 2024 & 2032
- Figure 60: Asia Pacific Global Reduced Fat Butter Market Volume (K Units), by Form 2024 & 2032
- Figure 61: Asia Pacific Global Reduced Fat Butter Market Revenue Share (%), by Form 2024 & 2032
- Figure 62: Asia Pacific Global Reduced Fat Butter Market Volume Share (%), by Form 2024 & 2032
- Figure 63: Asia Pacific Global Reduced Fat Butter Market Revenue (Million), by Distribution Channel 2024 & 2032
- Figure 64: Asia Pacific Global Reduced Fat Butter Market Volume (K Units), by Distribution Channel 2024 & 2032
- Figure 65: Asia Pacific Global Reduced Fat Butter Market Revenue Share (%), by Distribution Channel 2024 & 2032
- Figure 66: Asia Pacific Global Reduced Fat Butter Market Volume Share (%), by Distribution Channel 2024 & 2032
- Figure 67: Asia Pacific Global Reduced Fat Butter Market Revenue (Million), by Country 2024 & 2032
- Figure 68: Asia Pacific Global Reduced Fat Butter Market Volume (K Units), by Country 2024 & 2032
- Figure 69: Asia Pacific Global Reduced Fat Butter Market Revenue Share (%), by Country 2024 & 2032
- Figure 70: Asia Pacific Global Reduced Fat Butter Market Volume Share (%), by Country 2024 & 2032
- Figure 71: South America Global Reduced Fat Butter Market Revenue (Million), by Type 2024 & 2032
- Figure 72: South America Global Reduced Fat Butter Market Volume (K Units), by Type 2024 & 2032
- Figure 73: South America Global Reduced Fat Butter Market Revenue Share (%), by Type 2024 & 2032
- Figure 74: South America Global Reduced Fat Butter Market Volume Share (%), by Type 2024 & 2032
- Figure 75: South America Global Reduced Fat Butter Market Revenue (Million), by Form 2024 & 2032
- Figure 76: South America Global Reduced Fat Butter Market Volume (K Units), by Form 2024 & 2032
- Figure 77: South America Global Reduced Fat Butter Market Revenue Share (%), by Form 2024 & 2032
- Figure 78: South America Global Reduced Fat Butter Market Volume Share (%), by Form 2024 & 2032
- Figure 79: South America Global Reduced Fat Butter Market Revenue (Million), by Distribution Channel 2024 & 2032
- Figure 80: South America Global Reduced Fat Butter Market Volume (K Units), by Distribution Channel 2024 & 2032
- Figure 81: South America Global Reduced Fat Butter Market Revenue Share (%), by Distribution Channel 2024 & 2032
- Figure 82: South America Global Reduced Fat Butter Market Volume Share (%), by Distribution Channel 2024 & 2032
- Figure 83: South America Global Reduced Fat Butter Market Revenue (Million), by Country 2024 & 2032
- Figure 84: South America Global Reduced Fat Butter Market Volume (K Units), by Country 2024 & 2032
- Figure 85: South America Global Reduced Fat Butter Market Revenue Share (%), by Country 2024 & 2032
- Figure 86: South America Global Reduced Fat Butter Market Volume Share (%), by Country 2024 & 2032
- Figure 87: Middle East and Africa Global Reduced Fat Butter Market Revenue (Million), by Type 2024 & 2032
- Figure 88: Middle East and Africa Global Reduced Fat Butter Market Volume (K Units), by Type 2024 & 2032
- Figure 89: Middle East and Africa Global Reduced Fat Butter Market Revenue Share (%), by Type 2024 & 2032
- Figure 90: Middle East and Africa Global Reduced Fat Butter Market Volume Share (%), by Type 2024 & 2032
- Figure 91: Middle East and Africa Global Reduced Fat Butter Market Revenue (Million), by Form 2024 & 2032
- Figure 92: Middle East and Africa Global Reduced Fat Butter Market Volume (K Units), by Form 2024 & 2032
- Figure 93: Middle East and Africa Global Reduced Fat Butter Market Revenue Share (%), by Form 2024 & 2032
- Figure 94: Middle East and Africa Global Reduced Fat Butter Market Volume Share (%), by Form 2024 & 2032
- Figure 95: Middle East and Africa Global Reduced Fat Butter Market Revenue (Million), by Distribution Channel 2024 & 2032
- Figure 96: Middle East and Africa Global Reduced Fat Butter Market Volume (K Units), by Distribution Channel 2024 & 2032
- Figure 97: Middle East and Africa Global Reduced Fat Butter Market Revenue Share (%), by Distribution Channel 2024 & 2032
- Figure 98: Middle East and Africa Global Reduced Fat Butter Market Volume Share (%), by Distribution Channel 2024 & 2032
- Figure 99: Middle East and Africa Global Reduced Fat Butter Market Revenue (Million), by Country 2024 & 2032
- Figure 100: Middle East and Africa Global Reduced Fat Butter Market Volume (K Units), by Country 2024 & 2032
- Figure 101: Middle East and Africa Global Reduced Fat Butter Market Revenue Share (%), by Country 2024 & 2032
- Figure 102: Middle East and Africa Global Reduced Fat Butter Market Volume Share (%), by Country 2024 & 2032
List of Tables
- Table 1: Global Reduced Fat Butter Market Revenue Million Forecast, by Region 2019 & 2032
- Table 2: Global Reduced Fat Butter Market Volume K Units Forecast, by Region 2019 & 2032
- Table 3: Global Reduced Fat Butter Market Revenue Million Forecast, by Type 2019 & 2032
- Table 4: Global Reduced Fat Butter Market Volume K Units Forecast, by Type 2019 & 2032
- Table 5: Global Reduced Fat Butter Market Revenue Million Forecast, by Form 2019 & 2032
- Table 6: Global Reduced Fat Butter Market Volume K Units Forecast, by Form 2019 & 2032
- Table 7: Global Reduced Fat Butter Market Revenue Million Forecast, by Distribution Channel 2019 & 2032
- Table 8: Global Reduced Fat Butter Market Volume K Units Forecast, by Distribution Channel 2019 & 2032
- Table 9: Global Reduced Fat Butter Market Revenue Million Forecast, by Region 2019 & 2032
- Table 10: Global Reduced Fat Butter Market Volume K Units Forecast, by Region 2019 & 2032
- Table 11: Global Reduced Fat Butter Market Revenue Million Forecast, by Country 2019 & 2032
- Table 12: Global Reduced Fat Butter Market Volume K Units Forecast, by Country 2019 & 2032
- Table 13: United States Global Reduced Fat Butter Market Revenue (Million) Forecast, by Application 2019 & 2032
- Table 14: United States Global Reduced Fat Butter Market Volume (K Units) Forecast, by Application 2019 & 2032
- Table 15: Canada Global Reduced Fat Butter Market Revenue (Million) Forecast, by Application 2019 & 2032
- Table 16: Canada Global Reduced Fat Butter Market Volume (K Units) Forecast, by Application 2019 & 2032
- Table 17: Mexico Global Reduced Fat Butter Market Revenue (Million) Forecast, by Application 2019 & 2032
- Table 18: Mexico Global Reduced Fat Butter Market Volume (K Units) Forecast, by Application 2019 & 2032
- Table 19: Rest of North America Global Reduced Fat Butter Market Revenue (Million) Forecast, by Application 2019 & 2032
- Table 20: Rest of North America Global Reduced Fat Butter Market Volume (K Units) Forecast, by Application 2019 & 2032
- Table 21: Global Reduced Fat Butter Market Revenue Million Forecast, by Country 2019 & 2032
- Table 22: Global Reduced Fat Butter Market Volume K Units Forecast, by Country 2019 & 2032
- Table 23: Spain Global Reduced Fat Butter Market Revenue (Million) Forecast, by Application 2019 & 2032
- Table 24: Spain Global Reduced Fat Butter Market Volume (K Units) Forecast, by Application 2019 & 2032
- Table 25: United Kingdom Global Reduced Fat Butter Market Revenue (Million) Forecast, by Application 2019 & 2032
- Table 26: United Kingdom Global Reduced Fat Butter Market Volume (K Units) Forecast, by Application 2019 & 2032
- Table 27: Germany Global Reduced Fat Butter Market Revenue (Million) Forecast, by Application 2019 & 2032
- Table 28: Germany Global Reduced Fat Butter Market Volume (K Units) Forecast, by Application 2019 & 2032
- Table 29: France Global Reduced Fat Butter Market Revenue (Million) Forecast, by Application 2019 & 2032
- Table 30: France Global Reduced Fat Butter Market Volume (K Units) Forecast, by Application 2019 & 2032
- Table 31: Italy Global Reduced Fat Butter Market Revenue (Million) Forecast, by Application 2019 & 2032
- Table 32: Italy Global Reduced Fat Butter Market Volume (K Units) Forecast, by Application 2019 & 2032
- Table 33: Russia Global Reduced Fat Butter Market Revenue (Million) Forecast, by Application 2019 & 2032
- Table 34: Russia Global Reduced Fat Butter Market Volume (K Units) Forecast, by Application 2019 & 2032
- Table 35: Rest of Europe Global Reduced Fat Butter Market Revenue (Million) Forecast, by Application 2019 & 2032
- Table 36: Rest of Europe Global Reduced Fat Butter Market Volume (K Units) Forecast, by Application 2019 & 2032
- Table 37: Global Reduced Fat Butter Market Revenue Million Forecast, by Country 2019 & 2032
- Table 38: Global Reduced Fat Butter Market Volume K Units Forecast, by Country 2019 & 2032
- Table 39: China Global Reduced Fat Butter Market Revenue (Million) Forecast, by Application 2019 & 2032
- Table 40: China Global Reduced Fat Butter Market Volume (K Units) Forecast, by Application 2019 & 2032
- Table 41: Japan Global Reduced Fat Butter Market Revenue (Million) Forecast, by Application 2019 & 2032
- Table 42: Japan Global Reduced Fat Butter Market Volume (K Units) Forecast, by Application 2019 & 2032
- Table 43: India Global Reduced Fat Butter Market Revenue (Million) Forecast, by Application 2019 & 2032
- Table 44: India Global Reduced Fat Butter Market Volume (K Units) Forecast, by Application 2019 & 2032
- Table 45: Australia Global Reduced Fat Butter Market Revenue (Million) Forecast, by Application 2019 & 2032
- Table 46: Australia Global Reduced Fat Butter Market Volume (K Units) Forecast, by Application 2019 & 2032
- Table 47: Rest of Asia Pacific Global Reduced Fat Butter Market Revenue (Million) Forecast, by Application 2019 & 2032
- Table 48: Rest of Asia Pacific Global Reduced Fat Butter Market Volume (K Units) Forecast, by Application 2019 & 2032
- Table 49: Global Reduced Fat Butter Market Revenue Million Forecast, by Country 2019 & 2032
- Table 50: Global Reduced Fat Butter Market Volume K Units Forecast, by Country 2019 & 2032
- Table 51: Brazil Global Reduced Fat Butter Market Revenue (Million) Forecast, by Application 2019 & 2032
- Table 52: Brazil Global Reduced Fat Butter Market Volume (K Units) Forecast, by Application 2019 & 2032
- Table 53: Argentina Global Reduced Fat Butter Market Revenue (Million) Forecast, by Application 2019 & 2032
- Table 54: Argentina Global Reduced Fat Butter Market Volume (K Units) Forecast, by Application 2019 & 2032
- Table 55: Rest of South America Global Reduced Fat Butter Market Revenue (Million) Forecast, by Application 2019 & 2032
- Table 56: Rest of South America Global Reduced Fat Butter Market Volume (K Units) Forecast, by Application 2019 & 2032
- Table 57: Global Reduced Fat Butter Market Revenue Million Forecast, by Country 2019 & 2032
- Table 58: Global Reduced Fat Butter Market Volume K Units Forecast, by Country 2019 & 2032
- Table 59: South Africa Global Reduced Fat Butter Market Revenue (Million) Forecast, by Application 2019 & 2032
- Table 60: South Africa Global Reduced Fat Butter Market Volume (K Units) Forecast, by Application 2019 & 2032
- Table 61: Saudi Arabia Global Reduced Fat Butter Market Revenue (Million) Forecast, by Application 2019 & 2032
- Table 62: Saudi Arabia Global Reduced Fat Butter Market Volume (K Units) Forecast, by Application 2019 & 2032
- Table 63: Rest of Middle East and Africa Global Reduced Fat Butter Market Revenue (Million) Forecast, by Application 2019 & 2032
- Table 64: Rest of Middle East and Africa Global Reduced Fat Butter Market Volume (K Units) Forecast, by Application 2019 & 2032
- Table 65: Global Reduced Fat Butter Market Revenue Million Forecast, by Type 2019 & 2032
- Table 66: Global Reduced Fat Butter Market Volume K Units Forecast, by Type 2019 & 2032
- Table 67: Global Reduced Fat Butter Market Revenue Million Forecast, by Form 2019 & 2032
- Table 68: Global Reduced Fat Butter Market Volume K Units Forecast, by Form 2019 & 2032
- Table 69: Global Reduced Fat Butter Market Revenue Million Forecast, by Distribution Channel 2019 & 2032
- Table 70: Global Reduced Fat Butter Market Volume K Units Forecast, by Distribution Channel 2019 & 2032
- Table 71: Global Reduced Fat Butter Market Revenue Million Forecast, by Country 2019 & 2032
- Table 72: Global Reduced Fat Butter Market Volume K Units Forecast, by Country 2019 & 2032
- Table 73: United States Global Reduced Fat Butter Market Revenue (Million) Forecast, by Application 2019 & 2032
- Table 74: United States Global Reduced Fat Butter Market Volume (K Units) Forecast, by Application 2019 & 2032
- Table 75: Canada Global Reduced Fat Butter Market Revenue (Million) Forecast, by Application 2019 & 2032
- Table 76: Canada Global Reduced Fat Butter Market Volume (K Units) Forecast, by Application 2019 & 2032
- Table 77: Mexico Global Reduced Fat Butter Market Revenue (Million) Forecast, by Application 2019 & 2032
- Table 78: Mexico Global Reduced Fat Butter Market Volume (K Units) Forecast, by Application 2019 & 2032
- Table 79: Rest of North America Global Reduced Fat Butter Market Revenue (Million) Forecast, by Application 2019 & 2032
- Table 80: Rest of North America Global Reduced Fat Butter Market Volume (K Units) Forecast, by Application 2019 & 2032
- Table 81: Global Reduced Fat Butter Market Revenue Million Forecast, by Type 2019 & 2032
- Table 82: Global Reduced Fat Butter Market Volume K Units Forecast, by Type 2019 & 2032
- Table 83: Global Reduced Fat Butter Market Revenue Million Forecast, by Form 2019 & 2032
- Table 84: Global Reduced Fat Butter Market Volume K Units Forecast, by Form 2019 & 2032
- Table 85: Global Reduced Fat Butter Market Revenue Million Forecast, by Distribution Channel 2019 & 2032
- Table 86: Global Reduced Fat Butter Market Volume K Units Forecast, by Distribution Channel 2019 & 2032
- Table 87: Global Reduced Fat Butter Market Revenue Million Forecast, by Country 2019 & 2032
- Table 88: Global Reduced Fat Butter Market Volume K Units Forecast, by Country 2019 & 2032
- Table 89: Spain Global Reduced Fat Butter Market Revenue (Million) Forecast, by Application 2019 & 2032
- Table 90: Spain Global Reduced Fat Butter Market Volume (K Units) Forecast, by Application 2019 & 2032
- Table 91: United Kingdom Global Reduced Fat Butter Market Revenue (Million) Forecast, by Application 2019 & 2032
- Table 92: United Kingdom Global Reduced Fat Butter Market Volume (K Units) Forecast, by Application 2019 & 2032
- Table 93: Germany Global Reduced Fat Butter Market Revenue (Million) Forecast, by Application 2019 & 2032
- Table 94: Germany Global Reduced Fat Butter Market Volume (K Units) Forecast, by Application 2019 & 2032
- Table 95: France Global Reduced Fat Butter Market Revenue (Million) Forecast, by Application 2019 & 2032
- Table 96: France Global Reduced Fat Butter Market Volume (K Units) Forecast, by Application 2019 & 2032
- Table 97: Italy Global Reduced Fat Butter Market Revenue (Million) Forecast, by Application 2019 & 2032
- Table 98: Italy Global Reduced Fat Butter Market Volume (K Units) Forecast, by Application 2019 & 2032
- Table 99: Russia Global Reduced Fat Butter Market Revenue (Million) Forecast, by Application 2019 & 2032
- Table 100: Russia Global Reduced Fat Butter Market Volume (K Units) Forecast, by Application 2019 & 2032
- Table 101: Rest of Europe Global Reduced Fat Butter Market Revenue (Million) Forecast, by Application 2019 & 2032
- Table 102: Rest of Europe Global Reduced Fat Butter Market Volume (K Units) Forecast, by Application 2019 & 2032
- Table 103: Global Reduced Fat Butter Market Revenue Million Forecast, by Type 2019 & 2032
- Table 104: Global Reduced Fat Butter Market Volume K Units Forecast, by Type 2019 & 2032
- Table 105: Global Reduced Fat Butter Market Revenue Million Forecast, by Form 2019 & 2032
- Table 106: Global Reduced Fat Butter Market Volume K Units Forecast, by Form 2019 & 2032
- Table 107: Global Reduced Fat Butter Market Revenue Million Forecast, by Distribution Channel 2019 & 2032
- Table 108: Global Reduced Fat Butter Market Volume K Units Forecast, by Distribution Channel 2019 & 2032
- Table 109: Global Reduced Fat Butter Market Revenue Million Forecast, by Country 2019 & 2032
- Table 110: Global Reduced Fat Butter Market Volume K Units Forecast, by Country 2019 & 2032
- Table 111: China Global Reduced Fat Butter Market Revenue (Million) Forecast, by Application 2019 & 2032
- Table 112: China Global Reduced Fat Butter Market Volume (K Units) Forecast, by Application 2019 & 2032
- Table 113: Japan Global Reduced Fat Butter Market Revenue (Million) Forecast, by Application 2019 & 2032
- Table 114: Japan Global Reduced Fat Butter Market Volume (K Units) Forecast, by Application 2019 & 2032
- Table 115: India Global Reduced Fat Butter Market Revenue (Million) Forecast, by Application 2019 & 2032
- Table 116: India Global Reduced Fat Butter Market Volume (K Units) Forecast, by Application 2019 & 2032
- Table 117: Australia Global Reduced Fat Butter Market Revenue (Million) Forecast, by Application 2019 & 2032
- Table 118: Australia Global Reduced Fat Butter Market Volume (K Units) Forecast, by Application 2019 & 2032
- Table 119: Rest of Asia Pacific Global Reduced Fat Butter Market Revenue (Million) Forecast, by Application 2019 & 2032
- Table 120: Rest of Asia Pacific Global Reduced Fat Butter Market Volume (K Units) Forecast, by Application 2019 & 2032
- Table 121: Global Reduced Fat Butter Market Revenue Million Forecast, by Type 2019 & 2032
- Table 122: Global Reduced Fat Butter Market Volume K Units Forecast, by Type 2019 & 2032
- Table 123: Global Reduced Fat Butter Market Revenue Million Forecast, by Form 2019 & 2032
- Table 124: Global Reduced Fat Butter Market Volume K Units Forecast, by Form 2019 & 2032
- Table 125: Global Reduced Fat Butter Market Revenue Million Forecast, by Distribution Channel 2019 & 2032
- Table 126: Global Reduced Fat Butter Market Volume K Units Forecast, by Distribution Channel 2019 & 2032
- Table 127: Global Reduced Fat Butter Market Revenue Million Forecast, by Country 2019 & 2032
- Table 128: Global Reduced Fat Butter Market Volume K Units Forecast, by Country 2019 & 2032
- Table 129: Brazil Global Reduced Fat Butter Market Revenue (Million) Forecast, by Application 2019 & 2032
- Table 130: Brazil Global Reduced Fat Butter Market Volume (K Units) Forecast, by Application 2019 & 2032
- Table 131: Argentina Global Reduced Fat Butter Market Revenue (Million) Forecast, by Application 2019 & 2032
- Table 132: Argentina Global Reduced Fat Butter Market Volume (K Units) Forecast, by Application 2019 & 2032
- Table 133: Rest of South America Global Reduced Fat Butter Market Revenue (Million) Forecast, by Application 2019 & 2032
- Table 134: Rest of South America Global Reduced Fat Butter Market Volume (K Units) Forecast, by Application 2019 & 2032
- Table 135: Global Reduced Fat Butter Market Revenue Million Forecast, by Type 2019 & 2032
- Table 136: Global Reduced Fat Butter Market Volume K Units Forecast, by Type 2019 & 2032
- Table 137: Global Reduced Fat Butter Market Revenue Million Forecast, by Form 2019 & 2032
- Table 138: Global Reduced Fat Butter Market Volume K Units Forecast, by Form 2019 & 2032
- Table 139: Global Reduced Fat Butter Market Revenue Million Forecast, by Distribution Channel 2019 & 2032
- Table 140: Global Reduced Fat Butter Market Volume K Units Forecast, by Distribution Channel 2019 & 2032
- Table 141: Global Reduced Fat Butter Market Revenue Million Forecast, by Country 2019 & 2032
- Table 142: Global Reduced Fat Butter Market Volume K Units Forecast, by Country 2019 & 2032
- Table 143: South Africa Global Reduced Fat Butter Market Revenue (Million) Forecast, by Application 2019 & 2032
- Table 144: South Africa Global Reduced Fat Butter Market Volume (K Units) Forecast, by Application 2019 & 2032
- Table 145: Saudi Arabia Global Reduced Fat Butter Market Revenue (Million) Forecast, by Application 2019 & 2032
- Table 146: Saudi Arabia Global Reduced Fat Butter Market Volume (K Units) Forecast, by Application 2019 & 2032
- Table 147: Rest of Middle East and Africa Global Reduced Fat Butter Market Revenue (Million) Forecast, by Application 2019 & 2032
- Table 148: Rest of Middle East and Africa Global Reduced Fat Butter Market Volume (K Units) Forecast, by Application 2019 & 2032
Frequently Asked Questions
1. What is the projected Compound Annual Growth Rate (CAGR) of the Global Reduced Fat Butter Market?
The projected CAGR is approximately 6.73%.
2. Which companies are prominent players in the Global Reduced Fat Butter Market?
Key companies in the market include Land O'Lakes Inc, Arla Foods, Finlandia Cheese Inc, Rockview Farms, GCMMF, Ornua Co-operative Limited, Raisio Group plc*List Not Exhaustive, Unilever (Upfield), SAVENCIA SA, Saputo Inc.
3. What are the main segments of the Global Reduced Fat Butter Market?
The market segments include Type, Form, Distribution Channel.
4. Can you provide details about the market size?
The market size is estimated to be USD XX Million as of 2022.
5. What are some drivers contributing to market growth?
Increasing application of Gelatin in healthcare and pharmaceutical sector.
6. What are the notable trends driving market growth?
Surge in Demand for Low Fat and Low Calorie Food Products.
7. Are there any restraints impacting market growth?
Rising demand for clean label products.
8. Can you provide examples of recent developments in the market?
N/A
9. What pricing options are available for accessing the report?
Pricing options include single-user, multi-user, and enterprise licenses priced at USD 4750, USD 5250, and USD 8750 respectively.
10. Is the market size provided in terms of value or volume?
The market size is provided in terms of value, measured in Million and volume, measured in K Units.
11. Are there any specific market keywords associated with the report?
Yes, the market keyword associated with the report is "Global Reduced Fat Butter Market," which aids in identifying and referencing the specific market segment covered.
12. How do I determine which pricing option suits my needs best?
The pricing options vary based on user requirements and access needs. Individual users may opt for single-user licenses, while businesses requiring broader access may choose multi-user or enterprise licenses for cost-effective access to the report.
13. Are there any additional resources or data provided in the Global Reduced Fat Butter Market report?
While the report offers comprehensive insights, it's advisable to review the specific contents or supplementary materials provided to ascertain if additional resources or data are available.
14. How can I stay updated on further developments or reports in the Global Reduced Fat Butter Market?
To stay informed about further developments, trends, and reports in the Global Reduced Fat Butter Market, consider subscribing to industry newsletters, following relevant companies and organizations, or regularly checking reputable industry news sources and publications.
Methodology
Step 1 - Identification of Relevant Samples Size from Population Database


Step 2 - Approaches for Defining Global Market Size (Value, Volume* & Price*)

Note*: In applicable scenarios
Step 3 - Data Sources
Primary Research
- Web Analytics
- Survey Reports
- Research Institute
- Latest Research Reports
- Opinion Leaders
Secondary Research
- Annual Reports
- White Paper
- Latest Press Release
- Industry Association
- Paid Database
- Investor Presentations

Step 4 - Data Triangulation
Involves using different sources of information in order to increase the validity of a study
These sources are likely to be stakeholders in a program - participants, other researchers, program staff, other community members, and so on.
Then we put all data in single framework & apply various statistical tools to find out the dynamic on the market.
During the analysis stage, feedback from the stakeholder groups would be compared to determine areas of agreement as well as areas of divergence
