

Key Insights
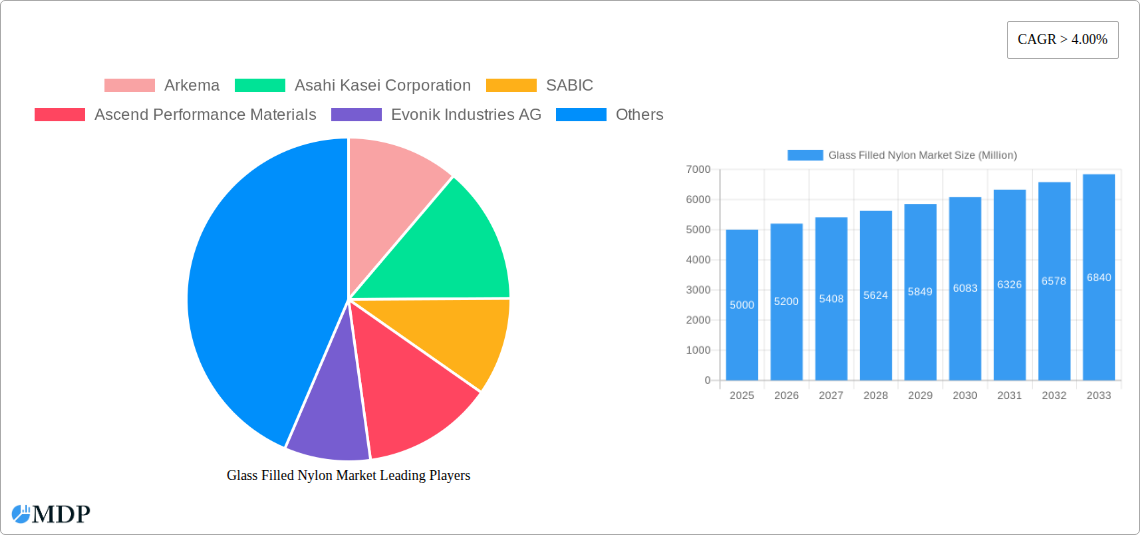
The global glass-filled nylon market is experiencing robust growth, driven by increasing demand across diverse end-use sectors. The market's Compound Annual Growth Rate (CAGR) exceeding 4.00% indicates a sustained upward trajectory projected through 2033. Key drivers include the material's superior mechanical properties, including high strength-to-weight ratio, dimensional stability, and chemical resistance, making it ideal for applications demanding durability and performance. The automotive industry, a major consumer, is fueling this growth through increased adoption in lightweight vehicle components to improve fuel efficiency and meet stricter emission regulations. Similarly, the electrical and electronics sector utilizes glass-filled nylon for its insulating properties and resistance to high temperatures, contributing significantly to market expansion. Growth is further supported by ongoing advancements in manufacturing processes like injection and extrusion molding, enabling cost-effective and high-volume production of intricate components. While supply chain disruptions and fluctuating raw material prices represent potential restraints, ongoing innovation and the development of specialized grades of glass-filled nylon tailored to specific applications are expected to mitigate these challenges and sustain the market's expansion. Segmentation analysis reveals significant demand for 20% glass-filled nylon, likely due to its balance of strength and processability. Polyamide 66 holds a notable market share, favored for its superior thermal and mechanical properties in demanding applications.
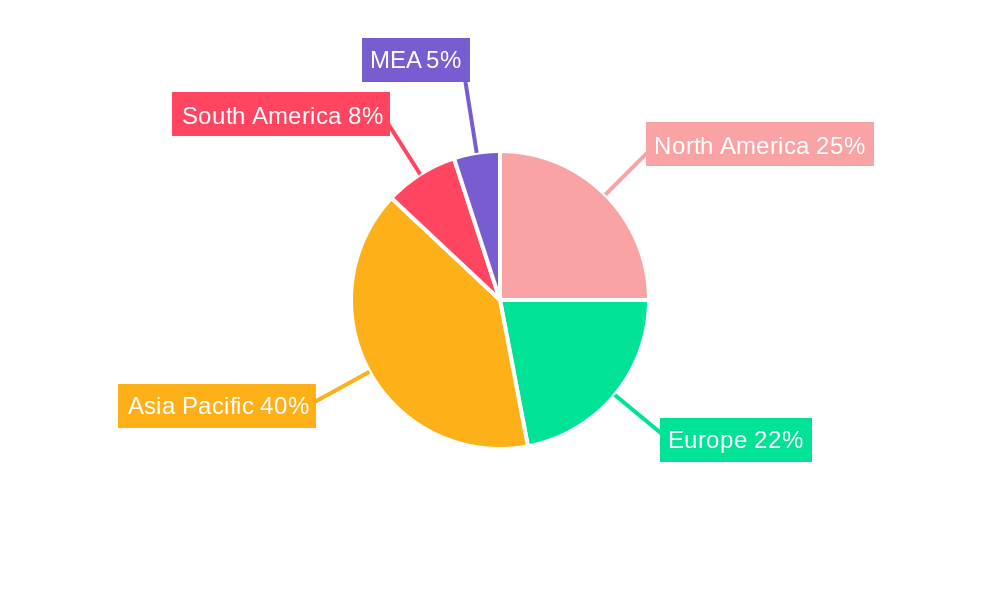
The market's regional landscape shows a strong presence across North America, Europe, and Asia Pacific. North America benefits from a well-established automotive and industrial sector. Europe's established manufacturing base and stringent environmental regulations drive demand for high-performance materials like glass-filled nylon. The Asia Pacific region is witnessing particularly rapid growth, spurred by the burgeoning automotive and electronics industries in China and India, along with increasing infrastructure development. While data for specific regional market shares is not provided, logical estimation based on industry trends and economic activity in each region suggests that Asia Pacific might represent the largest market share, followed by North America and Europe. The South American and MEA regions are expected to exhibit moderate growth, although further market penetration depends on economic factors and infrastructural advancements. Leading players like Arkema, Asahi Kasei, SABIC, and BASF are driving innovation and expanding their product portfolios to cater to the evolving needs of diverse industries, ensuring the continued growth of the glass-filled nylon market.
Glass Filled Nylon Market: A Comprehensive Analysis & Forecast 2019-2033
This comprehensive report provides an in-depth analysis of the global Glass Filled Nylon market, offering invaluable insights for industry stakeholders, investors, and strategic decision-makers. The study covers the period 2019-2033, with a focus on the forecast period 2025-2033 and a base year of 2025. The report meticulously examines market dynamics, key trends, leading players, and emerging opportunities, providing actionable intelligence for navigating this dynamic market.
Glass Filled Nylon Market Market Dynamics & Concentration
The Glass Filled Nylon market exhibits a moderately concentrated landscape, with key players like Arkema, Asahi Kasei Corporation, SABIC, Ascend Performance Materials, Evonik Industries AG, LANXESS, BASF SE, NYLATECH, Radici Partecipazioni SpA, and Ensinger holding significant market share. The collective market share of the top five players is estimated at xx%. Market concentration is influenced by factors such as economies of scale in manufacturing, R&D investments, and strong distribution networks.
Innovation drives market growth, with ongoing research into enhanced glass fillers, improved polymer formulations, and advanced manufacturing processes. Stringent regulatory frameworks concerning material safety and environmental impact play a crucial role, influencing material selection and manufacturing practices. The market also witnesses competition from alternative materials like glass fiber reinforced polymers (GFRP) and carbon fiber reinforced polymers (CFRP). However, Glass Filled Nylon retains a strong competitive edge due to its cost-effectiveness, excellent mechanical properties, and versatile applications.
End-user trends, particularly in the automotive and electrical & electronics sectors, significantly impact market demand. The increasing demand for lightweight and high-performance components in vehicles fuels the growth of Glass Filled Nylon. Furthermore, mergers and acquisitions (M&A) activities among key players contribute to market consolidation and expansion. An estimated xx M&A deals have been observed in the last five years, further shaping the market landscape.
- Market Concentration: Top 5 players hold xx% market share (Estimated).
- Innovation Drivers: Enhanced fillers, improved formulations, advanced manufacturing.
- Regulatory Factors: Stringent safety and environmental regulations.
- Substitute Materials: GFRP, CFRP.
- End-User Trends: Growing demand from automotive and electronics sectors.
- M&A Activities: Approximately xx deals in the last five years (Estimated).
Glass Filled Nylon Market Industry Trends & Analysis
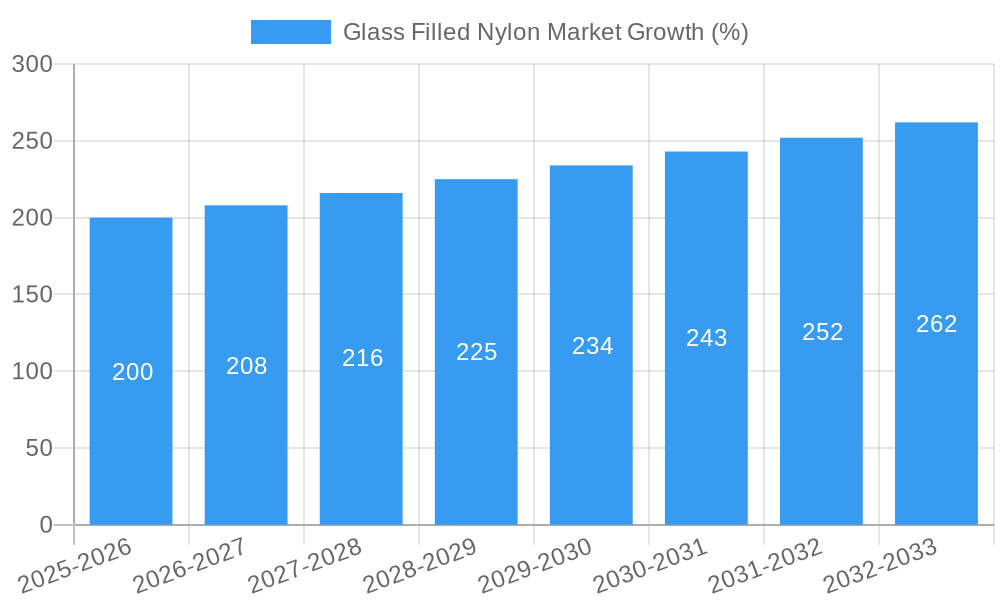
The global Glass Filled Nylon market is experiencing robust growth, projected at a Compound Annual Growth Rate (CAGR) of xx% during the forecast period (2025-2033). This growth is propelled by several factors. Technological advancements in polymer chemistry and material science have resulted in the development of Glass Filled Nylon with enhanced mechanical properties, improved thermal stability, and better dimensional accuracy. This has broadened its applications across various industries. Furthermore, the increasing focus on lightweighting in the automotive sector and the rising demand for durable and reliable components in the electrical and electronics industries are key growth catalysts.
Consumer preference for high-performance, cost-effective materials with long lifespans further fuels the market. The competitive dynamics are characterized by intense competition among established players and the emergence of new entrants offering innovative products and solutions. The market penetration of Glass Filled Nylon in different end-use sectors is also increasing, with significant growth observed in the automotive and industrial sectors. The market penetration rate is estimated at xx% in 2025, projected to increase to xx% by 2033. This expansion is mainly attributed to the rising adoption of Glass Filled Nylon in various applications due to its superior properties and cost-effectiveness compared to alternative materials.
Leading Markets & Segments in Glass Filled Nylon Market
The Automotive segment currently dominates the Glass Filled Nylon market, driven by stringent fuel efficiency regulations and the increasing adoption of lightweight materials to reduce vehicle weight and improve fuel economy. Geographically, Asia Pacific is the leading region, driven by the robust growth of the automotive and electronics industries in countries like China, India, and Japan.
- Dominant Region: Asia Pacific
- Dominant End-User: Automotive
- Key Drivers (Asia Pacific): Rapid industrialization, economic growth, increasing automotive production.
- Key Drivers (Automotive Segment): Lightweighting initiatives, fuel efficiency standards, increasing vehicle production.
Segment Analysis:
- Glass Filling: The 30% Glass Filled segment holds the largest market share due to its superior strength and stiffness properties.
- End-User: The automotive segment dominates followed by industrial and Electrical & Electronics. The other end-users segment shows promising growth potential.
- Type: Polyamide 66 currently holds a larger market share compared to Polyamide 6.
- Manufacturing Process: Injection molding holds the largest market share due to its high production efficiency and suitability for mass production.
The detailed analysis of each segment provides granular insights into its market size, growth drivers, and future outlook.
Glass Filled Nylon Market Product Developments
Recent innovations focus on developing Glass Filled Nylon compounds with enhanced properties like improved impact resistance, higher heat deflection temperature, and better chemical resistance. These advancements are driven by the demands of various applications requiring specialized performance characteristics. New applications are constantly emerging, extending the market's reach into sectors like consumer goods, medical devices, and sporting equipment. The competitive advantage is derived from offering superior material properties, customized solutions, and reliable supply chains.
Key Drivers of Glass Filled Nylon Market Growth
Several factors contribute to the growth of the Glass Filled Nylon market. Technological advancements, such as the development of novel glass fillers and polymer modification techniques, enhance the material's performance. The growing demand for lightweight and high-strength materials in automotive, electrical, and electronics applications provides a strong market pull. Favorable government policies promoting sustainable manufacturing and the adoption of energy-efficient materials also contribute to market growth. For example, stricter fuel economy standards in the automotive industry are driving the demand for lightweight components.
Challenges in the Glass Filled Nylon Market Market
The Glass Filled Nylon market faces challenges such as fluctuations in raw material prices, increasing competition from alternative materials, and the stringent regulatory environment surrounding the use of certain additives. Supply chain disruptions due to geopolitical events or natural disasters can also impact market stability. Furthermore, the high upfront investment required for advanced manufacturing technologies can be a barrier for some players. These challenges lead to price volatility and can affect market growth if not appropriately addressed.
Emerging Opportunities in Glass Filled Nylon Market
The Glass Filled Nylon market presents significant opportunities for growth. Technological breakthroughs in additive manufacturing and 3D printing are opening new avenues for customized part production. Strategic partnerships and collaborations among material suppliers, manufacturers, and end-users are accelerating product development and market penetration. Market expansion into new and emerging economies with growing industrial sectors offers substantial growth potential.
Leading Players in the Glass Filled Nylon Market Sector
- Arkema
- Asahi Kasei Corporation
- SABIC
- Ascend Performance Materials
- Evonik Industries AG
- LANXESS
- BASF SE
- NYLATECH
- Radici Partecipazioni SpA
- Ensinger
Key Milestones in Glass Filled Nylon Market Industry
- 2020: Introduction of a new Glass Filled Nylon grade with enhanced heat resistance by Company X.
- 2022: Acquisition of Company Y by Company Z, leading to increased market share.
- 2023: Launch of a sustainable Glass Filled Nylon compound with recycled content by Company A. (Further milestones require specific data.)
Strategic Outlook for Glass Filled Nylon Market Market
The future of the Glass Filled Nylon market is bright, driven by continued technological advancements, increasing demand from key end-use sectors, and the growing adoption of sustainable materials. Strategic partnerships and investments in research and development will be crucial for players to maintain a competitive edge. Exploring new applications and expanding into emerging markets will unlock significant growth opportunities. The market is expected to witness further consolidation through M&A activities and increased focus on providing customized solutions to meet specific customer needs.
Glass Filled Nylon Market Segmentation
-
1. Type
- 1.1. Polyamide 6
- 1.2. Polyamide 66
- 1.3. Other Types
-
2. Manufacturing Process
- 2.1. Injection Molding
- 2.2. Extrusion Molding
-
3. Glass Filling
- 3.1. 10% Glass Filled
- 3.2. 20% Glass Filled
- 3.3. 30% Glass Filled
-
4. End-user
- 4.1. Automotive
- 4.2. Industrial
- 4.3. Electrical & Electronics
- 4.4. Other End-users
Glass Filled Nylon Market Segmentation By Geography
-
1. Asia Pacific
- 1.1. China
- 1.2. India
- 1.3. Japan
- 1.4. South Korea
- 1.5. Rest of Asia Pacific
-
2. North America
- 2.1. United States
- 2.2. Canada
- 2.3. Mexico
-
3. Europe
- 3.1. Germany
- 3.2. United Kingdom
- 3.3. France
- 3.4. Italy
- 3.5. Rest of Europe
-
4. South America
- 4.1. Brazil
- 4.2. Argentina
- 4.3. Rest of South America
-
5. Middle East and Africa
- 5.1. Saudi Arabia
- 5.2. South Africa
- 5.3. Rest of Middle East and Africa
Glass Filled Nylon Market REPORT HIGHLIGHTS
| Aspects | Details |
|---|---|
| Study Period | 2019-2033 |
| Base Year | 2024 |
| Estimated Year | 2025 |
| Forecast Period | 2025-2033 |
| Historical Period | 2019-2024 |
| Growth Rate | CAGR of > 4.00% from 2019-2033 |
| Segmentation |
|
Table of Contents
- 1. Introduction
- 1.1. Research Scope
- 1.2. Market Segmentation
- 1.3. Research Methodology
- 1.4. Definitions and Assumptions
- 2. Executive Summary
- 2.1. Introduction
- 3. Market Dynamics
- 3.1. Introduction
- 3.2. Market Drivers
- 3.2.1. ; Rise in Electric Vehicles Demand; Growing Electrical & Electronics Industry
- 3.3. Market Restrains
- 3.3.1. ; Unfavorable Conditions Arising Due to the COVID-19 Impact; Other Restraints
- 3.4. Market Trends
- 3.4.1. Automotive Segment to Dominate the Market
- 4. Market Factor Analysis
- 4.1. Porters Five Forces
- 4.2. Supply/Value Chain
- 4.3. PESTEL analysis
- 4.4. Market Entropy
- 4.5. Patent/Trademark Analysis
- 5. Global Glass Filled Nylon Market Analysis, Insights and Forecast, 2019-2031
- 5.1. Market Analysis, Insights and Forecast - by Type
- 5.1.1. Polyamide 6
- 5.1.2. Polyamide 66
- 5.1.3. Other Types
- 5.2. Market Analysis, Insights and Forecast - by Manufacturing Process
- 5.2.1. Injection Molding
- 5.2.2. Extrusion Molding
- 5.3. Market Analysis, Insights and Forecast - by Glass Filling
- 5.3.1. 10% Glass Filled
- 5.3.2. 20% Glass Filled
- 5.3.3. 30% Glass Filled
- 5.4. Market Analysis, Insights and Forecast - by End-user
- 5.4.1. Automotive
- 5.4.2. Industrial
- 5.4.3. Electrical & Electronics
- 5.4.4. Other End-users
- 5.5. Market Analysis, Insights and Forecast - by Region
- 5.5.1. Asia Pacific
- 5.5.2. North America
- 5.5.3. Europe
- 5.5.4. South America
- 5.5.5. Middle East and Africa
- 5.1. Market Analysis, Insights and Forecast - by Type
- 6. Asia Pacific Glass Filled Nylon Market Analysis, Insights and Forecast, 2019-2031
- 6.1. Market Analysis, Insights and Forecast - by Type
- 6.1.1. Polyamide 6
- 6.1.2. Polyamide 66
- 6.1.3. Other Types
- 6.2. Market Analysis, Insights and Forecast - by Manufacturing Process
- 6.2.1. Injection Molding
- 6.2.2. Extrusion Molding
- 6.3. Market Analysis, Insights and Forecast - by Glass Filling
- 6.3.1. 10% Glass Filled
- 6.3.2. 20% Glass Filled
- 6.3.3. 30% Glass Filled
- 6.4. Market Analysis, Insights and Forecast - by End-user
- 6.4.1. Automotive
- 6.4.2. Industrial
- 6.4.3. Electrical & Electronics
- 6.4.4. Other End-users
- 6.1. Market Analysis, Insights and Forecast - by Type
- 7. North America Glass Filled Nylon Market Analysis, Insights and Forecast, 2019-2031
- 7.1. Market Analysis, Insights and Forecast - by Type
- 7.1.1. Polyamide 6
- 7.1.2. Polyamide 66
- 7.1.3. Other Types
- 7.2. Market Analysis, Insights and Forecast - by Manufacturing Process
- 7.2.1. Injection Molding
- 7.2.2. Extrusion Molding
- 7.3. Market Analysis, Insights and Forecast - by Glass Filling
- 7.3.1. 10% Glass Filled
- 7.3.2. 20% Glass Filled
- 7.3.3. 30% Glass Filled
- 7.4. Market Analysis, Insights and Forecast - by End-user
- 7.4.1. Automotive
- 7.4.2. Industrial
- 7.4.3. Electrical & Electronics
- 7.4.4. Other End-users
- 7.1. Market Analysis, Insights and Forecast - by Type
- 8. Europe Glass Filled Nylon Market Analysis, Insights and Forecast, 2019-2031
- 8.1. Market Analysis, Insights and Forecast - by Type
- 8.1.1. Polyamide 6
- 8.1.2. Polyamide 66
- 8.1.3. Other Types
- 8.2. Market Analysis, Insights and Forecast - by Manufacturing Process
- 8.2.1. Injection Molding
- 8.2.2. Extrusion Molding
- 8.3. Market Analysis, Insights and Forecast - by Glass Filling
- 8.3.1. 10% Glass Filled
- 8.3.2. 20% Glass Filled
- 8.3.3. 30% Glass Filled
- 8.4. Market Analysis, Insights and Forecast - by End-user
- 8.4.1. Automotive
- 8.4.2. Industrial
- 8.4.3. Electrical & Electronics
- 8.4.4. Other End-users
- 8.1. Market Analysis, Insights and Forecast - by Type
- 9. South America Glass Filled Nylon Market Analysis, Insights and Forecast, 2019-2031
- 9.1. Market Analysis, Insights and Forecast - by Type
- 9.1.1. Polyamide 6
- 9.1.2. Polyamide 66
- 9.1.3. Other Types
- 9.2. Market Analysis, Insights and Forecast - by Manufacturing Process
- 9.2.1. Injection Molding
- 9.2.2. Extrusion Molding
- 9.3. Market Analysis, Insights and Forecast - by Glass Filling
- 9.3.1. 10% Glass Filled
- 9.3.2. 20% Glass Filled
- 9.3.3. 30% Glass Filled
- 9.4. Market Analysis, Insights and Forecast - by End-user
- 9.4.1. Automotive
- 9.4.2. Industrial
- 9.4.3. Electrical & Electronics
- 9.4.4. Other End-users
- 9.1. Market Analysis, Insights and Forecast - by Type
- 10. Middle East and Africa Glass Filled Nylon Market Analysis, Insights and Forecast, 2019-2031
- 10.1. Market Analysis, Insights and Forecast - by Type
- 10.1.1. Polyamide 6
- 10.1.2. Polyamide 66
- 10.1.3. Other Types
- 10.2. Market Analysis, Insights and Forecast - by Manufacturing Process
- 10.2.1. Injection Molding
- 10.2.2. Extrusion Molding
- 10.3. Market Analysis, Insights and Forecast - by Glass Filling
- 10.3.1. 10% Glass Filled
- 10.3.2. 20% Glass Filled
- 10.3.3. 30% Glass Filled
- 10.4. Market Analysis, Insights and Forecast - by End-user
- 10.4.1. Automotive
- 10.4.2. Industrial
- 10.4.3. Electrical & Electronics
- 10.4.4. Other End-users
- 10.1. Market Analysis, Insights and Forecast - by Type
- 11. North America Glass Filled Nylon Market Analysis, Insights and Forecast, 2019-2031
- 11.1. Market Analysis, Insights and Forecast - By Country/Sub-region
- 11.1.1 United States
- 11.1.2 Canada
- 11.1.3 Mexico
- 12. Europe Glass Filled Nylon Market Analysis, Insights and Forecast, 2019-2031
- 12.1. Market Analysis, Insights and Forecast - By Country/Sub-region
- 12.1.1 Germany
- 12.1.2 France
- 12.1.3 Italy
- 12.1.4 United Kingdom
- 12.1.5 Netherlands
- 12.1.6 Rest of Europe
- 13. Asia Pacific Glass Filled Nylon Market Analysis, Insights and Forecast, 2019-2031
- 13.1. Market Analysis, Insights and Forecast - By Country/Sub-region
- 13.1.1 China
- 13.1.2 Japan
- 13.1.3 India
- 13.1.4 South Korea
- 13.1.5 Taiwan
- 13.1.6 Australia
- 13.1.7 Rest of Asia-Pacific
- 14. South America Glass Filled Nylon Market Analysis, Insights and Forecast, 2019-2031
- 14.1. Market Analysis, Insights and Forecast - By Country/Sub-region
- 14.1.1 Brazil
- 14.1.2 Argentina
- 14.1.3 Rest of South America
- 15. MEA Glass Filled Nylon Market Analysis, Insights and Forecast, 2019-2031
- 15.1. Market Analysis, Insights and Forecast - By Country/Sub-region
- 15.1.1 Middle East
- 15.1.2 Africa
- 16. Competitive Analysis
- 16.1. Global Market Share Analysis 2024
- 16.2. Company Profiles
- 16.2.1 Arkema
- 16.2.1.1. Overview
- 16.2.1.2. Products
- 16.2.1.3. SWOT Analysis
- 16.2.1.4. Recent Developments
- 16.2.1.5. Financials (Based on Availability)
- 16.2.2 Asahi Kasei Corporation
- 16.2.2.1. Overview
- 16.2.2.2. Products
- 16.2.2.3. SWOT Analysis
- 16.2.2.4. Recent Developments
- 16.2.2.5. Financials (Based on Availability)
- 16.2.3 SABIC
- 16.2.3.1. Overview
- 16.2.3.2. Products
- 16.2.3.3. SWOT Analysis
- 16.2.3.4. Recent Developments
- 16.2.3.5. Financials (Based on Availability)
- 16.2.4 Ascend Performance Materials
- 16.2.4.1. Overview
- 16.2.4.2. Products
- 16.2.4.3. SWOT Analysis
- 16.2.4.4. Recent Developments
- 16.2.4.5. Financials (Based on Availability)
- 16.2.5 Evonik Industries AG
- 16.2.5.1. Overview
- 16.2.5.2. Products
- 16.2.5.3. SWOT Analysis
- 16.2.5.4. Recent Developments
- 16.2.5.5. Financials (Based on Availability)
- 16.2.6 LANXESS
- 16.2.6.1. Overview
- 16.2.6.2. Products
- 16.2.6.3. SWOT Analysis
- 16.2.6.4. Recent Developments
- 16.2.6.5. Financials (Based on Availability)
- 16.2.7 BASF SE
- 16.2.7.1. Overview
- 16.2.7.2. Products
- 16.2.7.3. SWOT Analysis
- 16.2.7.4. Recent Developments
- 16.2.7.5. Financials (Based on Availability)
- 16.2.8 NYLATECH
- 16.2.8.1. Overview
- 16.2.8.2. Products
- 16.2.8.3. SWOT Analysis
- 16.2.8.4. Recent Developments
- 16.2.8.5. Financials (Based on Availability)
- 16.2.9 Radici Partecipazioni SpA
- 16.2.9.1. Overview
- 16.2.9.2. Products
- 16.2.9.3. SWOT Analysis
- 16.2.9.4. Recent Developments
- 16.2.9.5. Financials (Based on Availability)
- 16.2.10 Ensinger
- 16.2.10.1. Overview
- 16.2.10.2. Products
- 16.2.10.3. SWOT Analysis
- 16.2.10.4. Recent Developments
- 16.2.10.5. Financials (Based on Availability)
- 16.2.1 Arkema
List of Figures
- Figure 1: Global Glass Filled Nylon Market Revenue Breakdown (Million, %) by Region 2024 & 2032
- Figure 2: Global Glass Filled Nylon Market Volume Breakdown (K Tons, %) by Region 2024 & 2032
- Figure 3: North America Glass Filled Nylon Market Revenue (Million), by Country 2024 & 2032
- Figure 4: North America Glass Filled Nylon Market Volume (K Tons), by Country 2024 & 2032
- Figure 5: North America Glass Filled Nylon Market Revenue Share (%), by Country 2024 & 2032
- Figure 6: North America Glass Filled Nylon Market Volume Share (%), by Country 2024 & 2032
- Figure 7: Europe Glass Filled Nylon Market Revenue (Million), by Country 2024 & 2032
- Figure 8: Europe Glass Filled Nylon Market Volume (K Tons), by Country 2024 & 2032
- Figure 9: Europe Glass Filled Nylon Market Revenue Share (%), by Country 2024 & 2032
- Figure 10: Europe Glass Filled Nylon Market Volume Share (%), by Country 2024 & 2032
- Figure 11: Asia Pacific Glass Filled Nylon Market Revenue (Million), by Country 2024 & 2032
- Figure 12: Asia Pacific Glass Filled Nylon Market Volume (K Tons), by Country 2024 & 2032
- Figure 13: Asia Pacific Glass Filled Nylon Market Revenue Share (%), by Country 2024 & 2032
- Figure 14: Asia Pacific Glass Filled Nylon Market Volume Share (%), by Country 2024 & 2032
- Figure 15: South America Glass Filled Nylon Market Revenue (Million), by Country 2024 & 2032
- Figure 16: South America Glass Filled Nylon Market Volume (K Tons), by Country 2024 & 2032
- Figure 17: South America Glass Filled Nylon Market Revenue Share (%), by Country 2024 & 2032
- Figure 18: South America Glass Filled Nylon Market Volume Share (%), by Country 2024 & 2032
- Figure 19: MEA Glass Filled Nylon Market Revenue (Million), by Country 2024 & 2032
- Figure 20: MEA Glass Filled Nylon Market Volume (K Tons), by Country 2024 & 2032
- Figure 21: MEA Glass Filled Nylon Market Revenue Share (%), by Country 2024 & 2032
- Figure 22: MEA Glass Filled Nylon Market Volume Share (%), by Country 2024 & 2032
- Figure 23: Asia Pacific Glass Filled Nylon Market Revenue (Million), by Type 2024 & 2032
- Figure 24: Asia Pacific Glass Filled Nylon Market Volume (K Tons), by Type 2024 & 2032
- Figure 25: Asia Pacific Glass Filled Nylon Market Revenue Share (%), by Type 2024 & 2032
- Figure 26: Asia Pacific Glass Filled Nylon Market Volume Share (%), by Type 2024 & 2032
- Figure 27: Asia Pacific Glass Filled Nylon Market Revenue (Million), by Manufacturing Process 2024 & 2032
- Figure 28: Asia Pacific Glass Filled Nylon Market Volume (K Tons), by Manufacturing Process 2024 & 2032
- Figure 29: Asia Pacific Glass Filled Nylon Market Revenue Share (%), by Manufacturing Process 2024 & 2032
- Figure 30: Asia Pacific Glass Filled Nylon Market Volume Share (%), by Manufacturing Process 2024 & 2032
- Figure 31: Asia Pacific Glass Filled Nylon Market Revenue (Million), by Glass Filling 2024 & 2032
- Figure 32: Asia Pacific Glass Filled Nylon Market Volume (K Tons), by Glass Filling 2024 & 2032
- Figure 33: Asia Pacific Glass Filled Nylon Market Revenue Share (%), by Glass Filling 2024 & 2032
- Figure 34: Asia Pacific Glass Filled Nylon Market Volume Share (%), by Glass Filling 2024 & 2032
- Figure 35: Asia Pacific Glass Filled Nylon Market Revenue (Million), by End-user 2024 & 2032
- Figure 36: Asia Pacific Glass Filled Nylon Market Volume (K Tons), by End-user 2024 & 2032
- Figure 37: Asia Pacific Glass Filled Nylon Market Revenue Share (%), by End-user 2024 & 2032
- Figure 38: Asia Pacific Glass Filled Nylon Market Volume Share (%), by End-user 2024 & 2032
- Figure 39: Asia Pacific Glass Filled Nylon Market Revenue (Million), by Country 2024 & 2032
- Figure 40: Asia Pacific Glass Filled Nylon Market Volume (K Tons), by Country 2024 & 2032
- Figure 41: Asia Pacific Glass Filled Nylon Market Revenue Share (%), by Country 2024 & 2032
- Figure 42: Asia Pacific Glass Filled Nylon Market Volume Share (%), by Country 2024 & 2032
- Figure 43: North America Glass Filled Nylon Market Revenue (Million), by Type 2024 & 2032
- Figure 44: North America Glass Filled Nylon Market Volume (K Tons), by Type 2024 & 2032
- Figure 45: North America Glass Filled Nylon Market Revenue Share (%), by Type 2024 & 2032
- Figure 46: North America Glass Filled Nylon Market Volume Share (%), by Type 2024 & 2032
- Figure 47: North America Glass Filled Nylon Market Revenue (Million), by Manufacturing Process 2024 & 2032
- Figure 48: North America Glass Filled Nylon Market Volume (K Tons), by Manufacturing Process 2024 & 2032
- Figure 49: North America Glass Filled Nylon Market Revenue Share (%), by Manufacturing Process 2024 & 2032
- Figure 50: North America Glass Filled Nylon Market Volume Share (%), by Manufacturing Process 2024 & 2032
- Figure 51: North America Glass Filled Nylon Market Revenue (Million), by Glass Filling 2024 & 2032
- Figure 52: North America Glass Filled Nylon Market Volume (K Tons), by Glass Filling 2024 & 2032
- Figure 53: North America Glass Filled Nylon Market Revenue Share (%), by Glass Filling 2024 & 2032
- Figure 54: North America Glass Filled Nylon Market Volume Share (%), by Glass Filling 2024 & 2032
- Figure 55: North America Glass Filled Nylon Market Revenue (Million), by End-user 2024 & 2032
- Figure 56: North America Glass Filled Nylon Market Volume (K Tons), by End-user 2024 & 2032
- Figure 57: North America Glass Filled Nylon Market Revenue Share (%), by End-user 2024 & 2032
- Figure 58: North America Glass Filled Nylon Market Volume Share (%), by End-user 2024 & 2032
- Figure 59: North America Glass Filled Nylon Market Revenue (Million), by Country 2024 & 2032
- Figure 60: North America Glass Filled Nylon Market Volume (K Tons), by Country 2024 & 2032
- Figure 61: North America Glass Filled Nylon Market Revenue Share (%), by Country 2024 & 2032
- Figure 62: North America Glass Filled Nylon Market Volume Share (%), by Country 2024 & 2032
- Figure 63: Europe Glass Filled Nylon Market Revenue (Million), by Type 2024 & 2032
- Figure 64: Europe Glass Filled Nylon Market Volume (K Tons), by Type 2024 & 2032
- Figure 65: Europe Glass Filled Nylon Market Revenue Share (%), by Type 2024 & 2032
- Figure 66: Europe Glass Filled Nylon Market Volume Share (%), by Type 2024 & 2032
- Figure 67: Europe Glass Filled Nylon Market Revenue (Million), by Manufacturing Process 2024 & 2032
- Figure 68: Europe Glass Filled Nylon Market Volume (K Tons), by Manufacturing Process 2024 & 2032
- Figure 69: Europe Glass Filled Nylon Market Revenue Share (%), by Manufacturing Process 2024 & 2032
- Figure 70: Europe Glass Filled Nylon Market Volume Share (%), by Manufacturing Process 2024 & 2032
- Figure 71: Europe Glass Filled Nylon Market Revenue (Million), by Glass Filling 2024 & 2032
- Figure 72: Europe Glass Filled Nylon Market Volume (K Tons), by Glass Filling 2024 & 2032
- Figure 73: Europe Glass Filled Nylon Market Revenue Share (%), by Glass Filling 2024 & 2032
- Figure 74: Europe Glass Filled Nylon Market Volume Share (%), by Glass Filling 2024 & 2032
- Figure 75: Europe Glass Filled Nylon Market Revenue (Million), by End-user 2024 & 2032
- Figure 76: Europe Glass Filled Nylon Market Volume (K Tons), by End-user 2024 & 2032
- Figure 77: Europe Glass Filled Nylon Market Revenue Share (%), by End-user 2024 & 2032
- Figure 78: Europe Glass Filled Nylon Market Volume Share (%), by End-user 2024 & 2032
- Figure 79: Europe Glass Filled Nylon Market Revenue (Million), by Country 2024 & 2032
- Figure 80: Europe Glass Filled Nylon Market Volume (K Tons), by Country 2024 & 2032
- Figure 81: Europe Glass Filled Nylon Market Revenue Share (%), by Country 2024 & 2032
- Figure 82: Europe Glass Filled Nylon Market Volume Share (%), by Country 2024 & 2032
- Figure 83: South America Glass Filled Nylon Market Revenue (Million), by Type 2024 & 2032
- Figure 84: South America Glass Filled Nylon Market Volume (K Tons), by Type 2024 & 2032
- Figure 85: South America Glass Filled Nylon Market Revenue Share (%), by Type 2024 & 2032
- Figure 86: South America Glass Filled Nylon Market Volume Share (%), by Type 2024 & 2032
- Figure 87: South America Glass Filled Nylon Market Revenue (Million), by Manufacturing Process 2024 & 2032
- Figure 88: South America Glass Filled Nylon Market Volume (K Tons), by Manufacturing Process 2024 & 2032
- Figure 89: South America Glass Filled Nylon Market Revenue Share (%), by Manufacturing Process 2024 & 2032
- Figure 90: South America Glass Filled Nylon Market Volume Share (%), by Manufacturing Process 2024 & 2032
- Figure 91: South America Glass Filled Nylon Market Revenue (Million), by Glass Filling 2024 & 2032
- Figure 92: South America Glass Filled Nylon Market Volume (K Tons), by Glass Filling 2024 & 2032
- Figure 93: South America Glass Filled Nylon Market Revenue Share (%), by Glass Filling 2024 & 2032
- Figure 94: South America Glass Filled Nylon Market Volume Share (%), by Glass Filling 2024 & 2032
- Figure 95: South America Glass Filled Nylon Market Revenue (Million), by End-user 2024 & 2032
- Figure 96: South America Glass Filled Nylon Market Volume (K Tons), by End-user 2024 & 2032
- Figure 97: South America Glass Filled Nylon Market Revenue Share (%), by End-user 2024 & 2032
- Figure 98: South America Glass Filled Nylon Market Volume Share (%), by End-user 2024 & 2032
- Figure 99: South America Glass Filled Nylon Market Revenue (Million), by Country 2024 & 2032
- Figure 100: South America Glass Filled Nylon Market Volume (K Tons), by Country 2024 & 2032
- Figure 101: South America Glass Filled Nylon Market Revenue Share (%), by Country 2024 & 2032
- Figure 102: South America Glass Filled Nylon Market Volume Share (%), by Country 2024 & 2032
- Figure 103: Middle East and Africa Glass Filled Nylon Market Revenue (Million), by Type 2024 & 2032
- Figure 104: Middle East and Africa Glass Filled Nylon Market Volume (K Tons), by Type 2024 & 2032
- Figure 105: Middle East and Africa Glass Filled Nylon Market Revenue Share (%), by Type 2024 & 2032
- Figure 106: Middle East and Africa Glass Filled Nylon Market Volume Share (%), by Type 2024 & 2032
- Figure 107: Middle East and Africa Glass Filled Nylon Market Revenue (Million), by Manufacturing Process 2024 & 2032
- Figure 108: Middle East and Africa Glass Filled Nylon Market Volume (K Tons), by Manufacturing Process 2024 & 2032
- Figure 109: Middle East and Africa Glass Filled Nylon Market Revenue Share (%), by Manufacturing Process 2024 & 2032
- Figure 110: Middle East and Africa Glass Filled Nylon Market Volume Share (%), by Manufacturing Process 2024 & 2032
- Figure 111: Middle East and Africa Glass Filled Nylon Market Revenue (Million), by Glass Filling 2024 & 2032
- Figure 112: Middle East and Africa Glass Filled Nylon Market Volume (K Tons), by Glass Filling 2024 & 2032
- Figure 113: Middle East and Africa Glass Filled Nylon Market Revenue Share (%), by Glass Filling 2024 & 2032
- Figure 114: Middle East and Africa Glass Filled Nylon Market Volume Share (%), by Glass Filling 2024 & 2032
- Figure 115: Middle East and Africa Glass Filled Nylon Market Revenue (Million), by End-user 2024 & 2032
- Figure 116: Middle East and Africa Glass Filled Nylon Market Volume (K Tons), by End-user 2024 & 2032
- Figure 117: Middle East and Africa Glass Filled Nylon Market Revenue Share (%), by End-user 2024 & 2032
- Figure 118: Middle East and Africa Glass Filled Nylon Market Volume Share (%), by End-user 2024 & 2032
- Figure 119: Middle East and Africa Glass Filled Nylon Market Revenue (Million), by Country 2024 & 2032
- Figure 120: Middle East and Africa Glass Filled Nylon Market Volume (K Tons), by Country 2024 & 2032
- Figure 121: Middle East and Africa Glass Filled Nylon Market Revenue Share (%), by Country 2024 & 2032
- Figure 122: Middle East and Africa Glass Filled Nylon Market Volume Share (%), by Country 2024 & 2032
List of Tables
- Table 1: Global Glass Filled Nylon Market Revenue Million Forecast, by Region 2019 & 2032
- Table 2: Global Glass Filled Nylon Market Volume K Tons Forecast, by Region 2019 & 2032
- Table 3: Global Glass Filled Nylon Market Revenue Million Forecast, by Type 2019 & 2032
- Table 4: Global Glass Filled Nylon Market Volume K Tons Forecast, by Type 2019 & 2032
- Table 5: Global Glass Filled Nylon Market Revenue Million Forecast, by Manufacturing Process 2019 & 2032
- Table 6: Global Glass Filled Nylon Market Volume K Tons Forecast, by Manufacturing Process 2019 & 2032
- Table 7: Global Glass Filled Nylon Market Revenue Million Forecast, by Glass Filling 2019 & 2032
- Table 8: Global Glass Filled Nylon Market Volume K Tons Forecast, by Glass Filling 2019 & 2032
- Table 9: Global Glass Filled Nylon Market Revenue Million Forecast, by End-user 2019 & 2032
- Table 10: Global Glass Filled Nylon Market Volume K Tons Forecast, by End-user 2019 & 2032
- Table 11: Global Glass Filled Nylon Market Revenue Million Forecast, by Region 2019 & 2032
- Table 12: Global Glass Filled Nylon Market Volume K Tons Forecast, by Region 2019 & 2032
- Table 13: Global Glass Filled Nylon Market Revenue Million Forecast, by Country 2019 & 2032
- Table 14: Global Glass Filled Nylon Market Volume K Tons Forecast, by Country 2019 & 2032
- Table 15: United States Glass Filled Nylon Market Revenue (Million) Forecast, by Application 2019 & 2032
- Table 16: United States Glass Filled Nylon Market Volume (K Tons) Forecast, by Application 2019 & 2032
- Table 17: Canada Glass Filled Nylon Market Revenue (Million) Forecast, by Application 2019 & 2032
- Table 18: Canada Glass Filled Nylon Market Volume (K Tons) Forecast, by Application 2019 & 2032
- Table 19: Mexico Glass Filled Nylon Market Revenue (Million) Forecast, by Application 2019 & 2032
- Table 20: Mexico Glass Filled Nylon Market Volume (K Tons) Forecast, by Application 2019 & 2032
- Table 21: Global Glass Filled Nylon Market Revenue Million Forecast, by Country 2019 & 2032
- Table 22: Global Glass Filled Nylon Market Volume K Tons Forecast, by Country 2019 & 2032
- Table 23: Germany Glass Filled Nylon Market Revenue (Million) Forecast, by Application 2019 & 2032
- Table 24: Germany Glass Filled Nylon Market Volume (K Tons) Forecast, by Application 2019 & 2032
- Table 25: France Glass Filled Nylon Market Revenue (Million) Forecast, by Application 2019 & 2032
- Table 26: France Glass Filled Nylon Market Volume (K Tons) Forecast, by Application 2019 & 2032
- Table 27: Italy Glass Filled Nylon Market Revenue (Million) Forecast, by Application 2019 & 2032
- Table 28: Italy Glass Filled Nylon Market Volume (K Tons) Forecast, by Application 2019 & 2032
- Table 29: United Kingdom Glass Filled Nylon Market Revenue (Million) Forecast, by Application 2019 & 2032
- Table 30: United Kingdom Glass Filled Nylon Market Volume (K Tons) Forecast, by Application 2019 & 2032
- Table 31: Netherlands Glass Filled Nylon Market Revenue (Million) Forecast, by Application 2019 & 2032
- Table 32: Netherlands Glass Filled Nylon Market Volume (K Tons) Forecast, by Application 2019 & 2032
- Table 33: Rest of Europe Glass Filled Nylon Market Revenue (Million) Forecast, by Application 2019 & 2032
- Table 34: Rest of Europe Glass Filled Nylon Market Volume (K Tons) Forecast, by Application 2019 & 2032
- Table 35: Global Glass Filled Nylon Market Revenue Million Forecast, by Country 2019 & 2032
- Table 36: Global Glass Filled Nylon Market Volume K Tons Forecast, by Country 2019 & 2032
- Table 37: China Glass Filled Nylon Market Revenue (Million) Forecast, by Application 2019 & 2032
- Table 38: China Glass Filled Nylon Market Volume (K Tons) Forecast, by Application 2019 & 2032
- Table 39: Japan Glass Filled Nylon Market Revenue (Million) Forecast, by Application 2019 & 2032
- Table 40: Japan Glass Filled Nylon Market Volume (K Tons) Forecast, by Application 2019 & 2032
- Table 41: India Glass Filled Nylon Market Revenue (Million) Forecast, by Application 2019 & 2032
- Table 42: India Glass Filled Nylon Market Volume (K Tons) Forecast, by Application 2019 & 2032
- Table 43: South Korea Glass Filled Nylon Market Revenue (Million) Forecast, by Application 2019 & 2032
- Table 44: South Korea Glass Filled Nylon Market Volume (K Tons) Forecast, by Application 2019 & 2032
- Table 45: Taiwan Glass Filled Nylon Market Revenue (Million) Forecast, by Application 2019 & 2032
- Table 46: Taiwan Glass Filled Nylon Market Volume (K Tons) Forecast, by Application 2019 & 2032
- Table 47: Australia Glass Filled Nylon Market Revenue (Million) Forecast, by Application 2019 & 2032
- Table 48: Australia Glass Filled Nylon Market Volume (K Tons) Forecast, by Application 2019 & 2032
- Table 49: Rest of Asia-Pacific Glass Filled Nylon Market Revenue (Million) Forecast, by Application 2019 & 2032
- Table 50: Rest of Asia-Pacific Glass Filled Nylon Market Volume (K Tons) Forecast, by Application 2019 & 2032
- Table 51: Global Glass Filled Nylon Market Revenue Million Forecast, by Country 2019 & 2032
- Table 52: Global Glass Filled Nylon Market Volume K Tons Forecast, by Country 2019 & 2032
- Table 53: Brazil Glass Filled Nylon Market Revenue (Million) Forecast, by Application 2019 & 2032
- Table 54: Brazil Glass Filled Nylon Market Volume (K Tons) Forecast, by Application 2019 & 2032
- Table 55: Argentina Glass Filled Nylon Market Revenue (Million) Forecast, by Application 2019 & 2032
- Table 56: Argentina Glass Filled Nylon Market Volume (K Tons) Forecast, by Application 2019 & 2032
- Table 57: Rest of South America Glass Filled Nylon Market Revenue (Million) Forecast, by Application 2019 & 2032
- Table 58: Rest of South America Glass Filled Nylon Market Volume (K Tons) Forecast, by Application 2019 & 2032
- Table 59: Global Glass Filled Nylon Market Revenue Million Forecast, by Country 2019 & 2032
- Table 60: Global Glass Filled Nylon Market Volume K Tons Forecast, by Country 2019 & 2032
- Table 61: Middle East Glass Filled Nylon Market Revenue (Million) Forecast, by Application 2019 & 2032
- Table 62: Middle East Glass Filled Nylon Market Volume (K Tons) Forecast, by Application 2019 & 2032
- Table 63: Africa Glass Filled Nylon Market Revenue (Million) Forecast, by Application 2019 & 2032
- Table 64: Africa Glass Filled Nylon Market Volume (K Tons) Forecast, by Application 2019 & 2032
- Table 65: Global Glass Filled Nylon Market Revenue Million Forecast, by Type 2019 & 2032
- Table 66: Global Glass Filled Nylon Market Volume K Tons Forecast, by Type 2019 & 2032
- Table 67: Global Glass Filled Nylon Market Revenue Million Forecast, by Manufacturing Process 2019 & 2032
- Table 68: Global Glass Filled Nylon Market Volume K Tons Forecast, by Manufacturing Process 2019 & 2032
- Table 69: Global Glass Filled Nylon Market Revenue Million Forecast, by Glass Filling 2019 & 2032
- Table 70: Global Glass Filled Nylon Market Volume K Tons Forecast, by Glass Filling 2019 & 2032
- Table 71: Global Glass Filled Nylon Market Revenue Million Forecast, by End-user 2019 & 2032
- Table 72: Global Glass Filled Nylon Market Volume K Tons Forecast, by End-user 2019 & 2032
- Table 73: Global Glass Filled Nylon Market Revenue Million Forecast, by Country 2019 & 2032
- Table 74: Global Glass Filled Nylon Market Volume K Tons Forecast, by Country 2019 & 2032
- Table 75: China Glass Filled Nylon Market Revenue (Million) Forecast, by Application 2019 & 2032
- Table 76: China Glass Filled Nylon Market Volume (K Tons) Forecast, by Application 2019 & 2032
- Table 77: India Glass Filled Nylon Market Revenue (Million) Forecast, by Application 2019 & 2032
- Table 78: India Glass Filled Nylon Market Volume (K Tons) Forecast, by Application 2019 & 2032
- Table 79: Japan Glass Filled Nylon Market Revenue (Million) Forecast, by Application 2019 & 2032
- Table 80: Japan Glass Filled Nylon Market Volume (K Tons) Forecast, by Application 2019 & 2032
- Table 81: South Korea Glass Filled Nylon Market Revenue (Million) Forecast, by Application 2019 & 2032
- Table 82: South Korea Glass Filled Nylon Market Volume (K Tons) Forecast, by Application 2019 & 2032
- Table 83: Rest of Asia Pacific Glass Filled Nylon Market Revenue (Million) Forecast, by Application 2019 & 2032
- Table 84: Rest of Asia Pacific Glass Filled Nylon Market Volume (K Tons) Forecast, by Application 2019 & 2032
- Table 85: Global Glass Filled Nylon Market Revenue Million Forecast, by Type 2019 & 2032
- Table 86: Global Glass Filled Nylon Market Volume K Tons Forecast, by Type 2019 & 2032
- Table 87: Global Glass Filled Nylon Market Revenue Million Forecast, by Manufacturing Process 2019 & 2032
- Table 88: Global Glass Filled Nylon Market Volume K Tons Forecast, by Manufacturing Process 2019 & 2032
- Table 89: Global Glass Filled Nylon Market Revenue Million Forecast, by Glass Filling 2019 & 2032
- Table 90: Global Glass Filled Nylon Market Volume K Tons Forecast, by Glass Filling 2019 & 2032
- Table 91: Global Glass Filled Nylon Market Revenue Million Forecast, by End-user 2019 & 2032
- Table 92: Global Glass Filled Nylon Market Volume K Tons Forecast, by End-user 2019 & 2032
- Table 93: Global Glass Filled Nylon Market Revenue Million Forecast, by Country 2019 & 2032
- Table 94: Global Glass Filled Nylon Market Volume K Tons Forecast, by Country 2019 & 2032
- Table 95: United States Glass Filled Nylon Market Revenue (Million) Forecast, by Application 2019 & 2032
- Table 96: United States Glass Filled Nylon Market Volume (K Tons) Forecast, by Application 2019 & 2032
- Table 97: Canada Glass Filled Nylon Market Revenue (Million) Forecast, by Application 2019 & 2032
- Table 98: Canada Glass Filled Nylon Market Volume (K Tons) Forecast, by Application 2019 & 2032
- Table 99: Mexico Glass Filled Nylon Market Revenue (Million) Forecast, by Application 2019 & 2032
- Table 100: Mexico Glass Filled Nylon Market Volume (K Tons) Forecast, by Application 2019 & 2032
- Table 101: Global Glass Filled Nylon Market Revenue Million Forecast, by Type 2019 & 2032
- Table 102: Global Glass Filled Nylon Market Volume K Tons Forecast, by Type 2019 & 2032
- Table 103: Global Glass Filled Nylon Market Revenue Million Forecast, by Manufacturing Process 2019 & 2032
- Table 104: Global Glass Filled Nylon Market Volume K Tons Forecast, by Manufacturing Process 2019 & 2032
- Table 105: Global Glass Filled Nylon Market Revenue Million Forecast, by Glass Filling 2019 & 2032
- Table 106: Global Glass Filled Nylon Market Volume K Tons Forecast, by Glass Filling 2019 & 2032
- Table 107: Global Glass Filled Nylon Market Revenue Million Forecast, by End-user 2019 & 2032
- Table 108: Global Glass Filled Nylon Market Volume K Tons Forecast, by End-user 2019 & 2032
- Table 109: Global Glass Filled Nylon Market Revenue Million Forecast, by Country 2019 & 2032
- Table 110: Global Glass Filled Nylon Market Volume K Tons Forecast, by Country 2019 & 2032
- Table 111: Germany Glass Filled Nylon Market Revenue (Million) Forecast, by Application 2019 & 2032
- Table 112: Germany Glass Filled Nylon Market Volume (K Tons) Forecast, by Application 2019 & 2032
- Table 113: United Kingdom Glass Filled Nylon Market Revenue (Million) Forecast, by Application 2019 & 2032
- Table 114: United Kingdom Glass Filled Nylon Market Volume (K Tons) Forecast, by Application 2019 & 2032
- Table 115: France Glass Filled Nylon Market Revenue (Million) Forecast, by Application 2019 & 2032
- Table 116: France Glass Filled Nylon Market Volume (K Tons) Forecast, by Application 2019 & 2032
- Table 117: Italy Glass Filled Nylon Market Revenue (Million) Forecast, by Application 2019 & 2032
- Table 118: Italy Glass Filled Nylon Market Volume (K Tons) Forecast, by Application 2019 & 2032
- Table 119: Rest of Europe Glass Filled Nylon Market Revenue (Million) Forecast, by Application 2019 & 2032
- Table 120: Rest of Europe Glass Filled Nylon Market Volume (K Tons) Forecast, by Application 2019 & 2032
- Table 121: Global Glass Filled Nylon Market Revenue Million Forecast, by Type 2019 & 2032
- Table 122: Global Glass Filled Nylon Market Volume K Tons Forecast, by Type 2019 & 2032
- Table 123: Global Glass Filled Nylon Market Revenue Million Forecast, by Manufacturing Process 2019 & 2032
- Table 124: Global Glass Filled Nylon Market Volume K Tons Forecast, by Manufacturing Process 2019 & 2032
- Table 125: Global Glass Filled Nylon Market Revenue Million Forecast, by Glass Filling 2019 & 2032
- Table 126: Global Glass Filled Nylon Market Volume K Tons Forecast, by Glass Filling 2019 & 2032
- Table 127: Global Glass Filled Nylon Market Revenue Million Forecast, by End-user 2019 & 2032
- Table 128: Global Glass Filled Nylon Market Volume K Tons Forecast, by End-user 2019 & 2032
- Table 129: Global Glass Filled Nylon Market Revenue Million Forecast, by Country 2019 & 2032
- Table 130: Global Glass Filled Nylon Market Volume K Tons Forecast, by Country 2019 & 2032
- Table 131: Brazil Glass Filled Nylon Market Revenue (Million) Forecast, by Application 2019 & 2032
- Table 132: Brazil Glass Filled Nylon Market Volume (K Tons) Forecast, by Application 2019 & 2032
- Table 133: Argentina Glass Filled Nylon Market Revenue (Million) Forecast, by Application 2019 & 2032
- Table 134: Argentina Glass Filled Nylon Market Volume (K Tons) Forecast, by Application 2019 & 2032
- Table 135: Rest of South America Glass Filled Nylon Market Revenue (Million) Forecast, by Application 2019 & 2032
- Table 136: Rest of South America Glass Filled Nylon Market Volume (K Tons) Forecast, by Application 2019 & 2032
- Table 137: Global Glass Filled Nylon Market Revenue Million Forecast, by Type 2019 & 2032
- Table 138: Global Glass Filled Nylon Market Volume K Tons Forecast, by Type 2019 & 2032
- Table 139: Global Glass Filled Nylon Market Revenue Million Forecast, by Manufacturing Process 2019 & 2032
- Table 140: Global Glass Filled Nylon Market Volume K Tons Forecast, by Manufacturing Process 2019 & 2032
- Table 141: Global Glass Filled Nylon Market Revenue Million Forecast, by Glass Filling 2019 & 2032
- Table 142: Global Glass Filled Nylon Market Volume K Tons Forecast, by Glass Filling 2019 & 2032
- Table 143: Global Glass Filled Nylon Market Revenue Million Forecast, by End-user 2019 & 2032
- Table 144: Global Glass Filled Nylon Market Volume K Tons Forecast, by End-user 2019 & 2032
- Table 145: Global Glass Filled Nylon Market Revenue Million Forecast, by Country 2019 & 2032
- Table 146: Global Glass Filled Nylon Market Volume K Tons Forecast, by Country 2019 & 2032
- Table 147: Saudi Arabia Glass Filled Nylon Market Revenue (Million) Forecast, by Application 2019 & 2032
- Table 148: Saudi Arabia Glass Filled Nylon Market Volume (K Tons) Forecast, by Application 2019 & 2032
- Table 149: South Africa Glass Filled Nylon Market Revenue (Million) Forecast, by Application 2019 & 2032
- Table 150: South Africa Glass Filled Nylon Market Volume (K Tons) Forecast, by Application 2019 & 2032
- Table 151: Rest of Middle East and Africa Glass Filled Nylon Market Revenue (Million) Forecast, by Application 2019 & 2032
- Table 152: Rest of Middle East and Africa Glass Filled Nylon Market Volume (K Tons) Forecast, by Application 2019 & 2032
Frequently Asked Questions
1. What is the projected Compound Annual Growth Rate (CAGR) of the Glass Filled Nylon Market?
The projected CAGR is approximately > 4.00%.
2. Which companies are prominent players in the Glass Filled Nylon Market?
Key companies in the market include Arkema, Asahi Kasei Corporation, SABIC, Ascend Performance Materials, Evonik Industries AG, LANXESS, BASF SE, NYLATECH, Radici Partecipazioni SpA, Ensinger.
3. What are the main segments of the Glass Filled Nylon Market?
The market segments include Type, Manufacturing Process, Glass Filling, End-user.
4. Can you provide details about the market size?
The market size is estimated to be USD XX Million as of 2022.
5. What are some drivers contributing to market growth?
; Rise in Electric Vehicles Demand; Growing Electrical & Electronics Industry.
6. What are the notable trends driving market growth?
Automotive Segment to Dominate the Market.
7. Are there any restraints impacting market growth?
; Unfavorable Conditions Arising Due to the COVID-19 Impact; Other Restraints.
8. Can you provide examples of recent developments in the market?
N/A
9. What pricing options are available for accessing the report?
Pricing options include single-user, multi-user, and enterprise licenses priced at USD 4750, USD 5250, and USD 8750 respectively.
10. Is the market size provided in terms of value or volume?
The market size is provided in terms of value, measured in Million and volume, measured in K Tons.
11. Are there any specific market keywords associated with the report?
Yes, the market keyword associated with the report is "Glass Filled Nylon Market," which aids in identifying and referencing the specific market segment covered.
12. How do I determine which pricing option suits my needs best?
The pricing options vary based on user requirements and access needs. Individual users may opt for single-user licenses, while businesses requiring broader access may choose multi-user or enterprise licenses for cost-effective access to the report.
13. Are there any additional resources or data provided in the Glass Filled Nylon Market report?
While the report offers comprehensive insights, it's advisable to review the specific contents or supplementary materials provided to ascertain if additional resources or data are available.
14. How can I stay updated on further developments or reports in the Glass Filled Nylon Market?
To stay informed about further developments, trends, and reports in the Glass Filled Nylon Market, consider subscribing to industry newsletters, following relevant companies and organizations, or regularly checking reputable industry news sources and publications.
Methodology
Step 1 - Identification of Relevant Samples Size from Population Database


Step 2 - Approaches for Defining Global Market Size (Value, Volume* & Price*)

Note*: In applicable scenarios
Step 3 - Data Sources
Primary Research
- Web Analytics
- Survey Reports
- Research Institute
- Latest Research Reports
- Opinion Leaders
Secondary Research
- Annual Reports
- White Paper
- Latest Press Release
- Industry Association
- Paid Database
- Investor Presentations

Step 4 - Data Triangulation
Involves using different sources of information in order to increase the validity of a study
These sources are likely to be stakeholders in a program - participants, other researchers, program staff, other community members, and so on.
Then we put all data in single framework & apply various statistical tools to find out the dynamic on the market.
During the analysis stage, feedback from the stakeholder groups would be compared to determine areas of agreement as well as areas of divergence
