

Key Insights
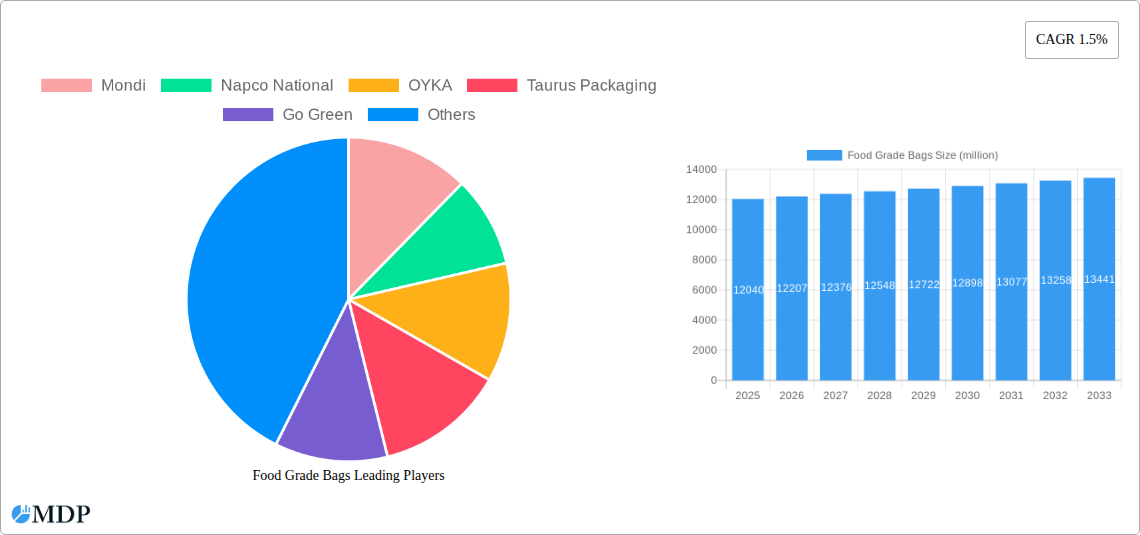
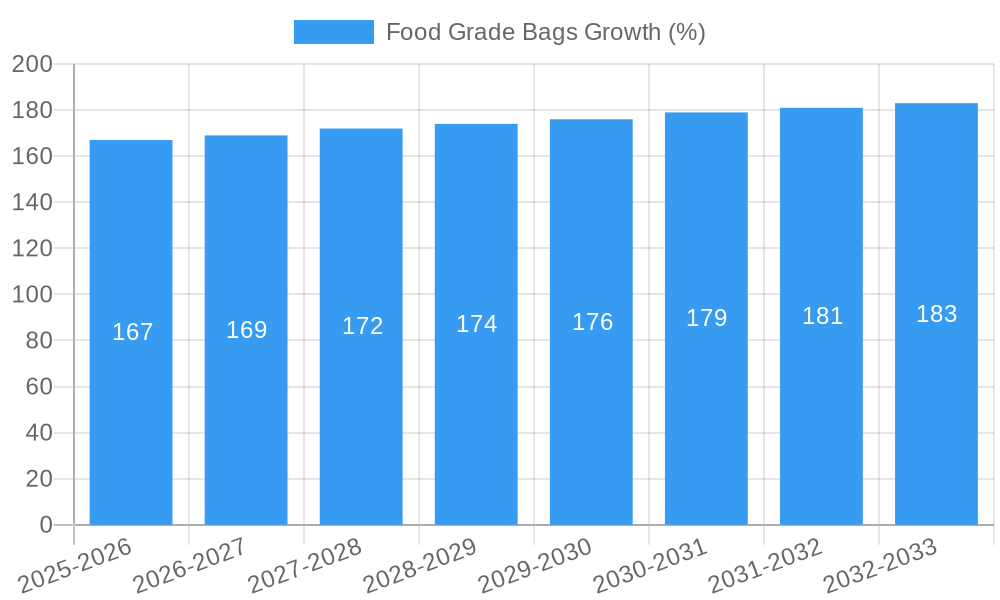
The global food grade bags market, valued at $12,040 million in 2025, is projected to exhibit a compound annual growth rate (CAGR) of 1.5% from 2025 to 2033. This moderate growth reflects a mature market with established players, but also signifies continued demand driven by the increasing consumption of packaged food and beverages. Key drivers include the rising preference for convenience foods, growth in e-commerce and online grocery delivery, and the stringent regulations ensuring food safety and preservation. Furthermore, the expanding food processing and manufacturing industries contribute significantly to the market's sustained expansion. The market is segmented by material type (e.g., paper, plastic, and composite), bag type (e.g., stand-up pouches, flat bags, and barrier bags), and application (e.g., snacks, frozen foods, and dairy products). Competition is fierce, with established players like Mondi, Huhtamaki Group, and Novolex vying for market share alongside smaller, specialized packaging companies. Innovation in sustainable and eco-friendly packaging materials is a key trend influencing the market, pushing manufacturers to develop biodegradable and compostable alternatives.
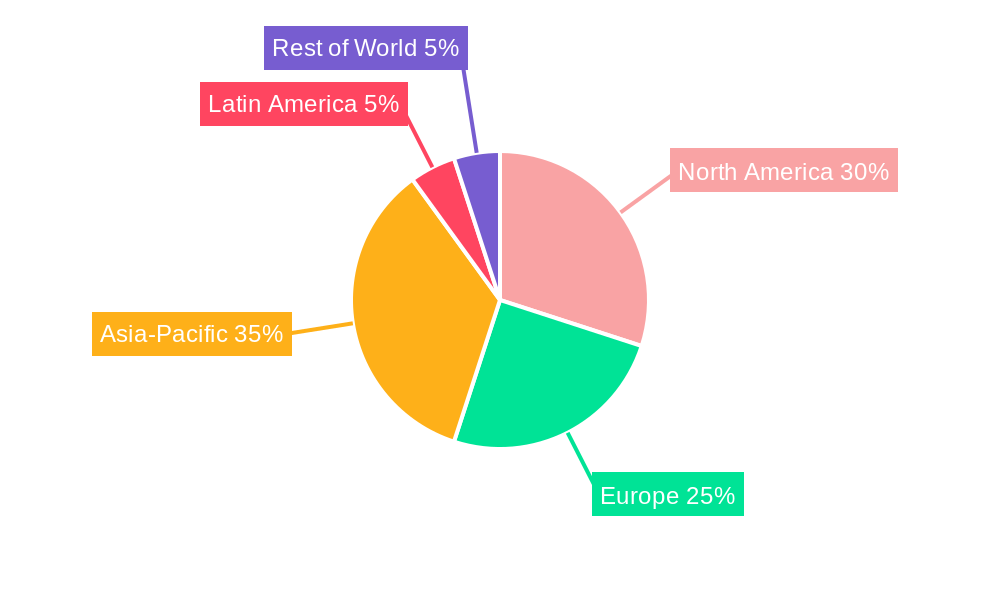
While the overall growth is steady, regional variations are expected. Developed markets like North America and Europe might show slower growth compared to emerging economies in Asia-Pacific and Latin America, driven by increasing disposable incomes and rising demand for packaged food in these regions. However, challenges remain. Fluctuations in raw material prices, particularly for plastics, and growing environmental concerns regarding plastic waste pose potential restraints to market expansion. The industry will likely see increased emphasis on sustainable packaging solutions and circular economy approaches to address these concerns. The forecast period reveals a trajectory indicating continuous growth, albeit at a moderate pace, sustained by the inherent link between food packaging and the ever-evolving food industry landscape.
Food Grade Bags Market Report: A Comprehensive Analysis (2019-2033)
Unlocking Billions in Growth Potential: A Deep Dive into the Food Grade Bags Market
This comprehensive report provides a detailed analysis of the global food grade bags market, offering invaluable insights for industry stakeholders, investors, and businesses seeking to navigate this dynamic landscape. Covering the period from 2019 to 2033, with a focus on 2025, this report unveils the key trends, challenges, and opportunities shaping this multi-billion-dollar market. The study encompasses market sizing, segmentation, competitive analysis, and future projections, providing actionable intelligence to drive informed decision-making. Expect in-depth analysis of over $xx billion market.
Key Highlights:
- Market Size & Growth: Explore the market's impressive growth trajectory, with projected values exceeding $xx billion by 2033.
- Competitive Landscape: Analyze the strategies of leading players, including Mondi, Napco National, OYKA, Taurus Packaging, Go Green, Manchester Paper Bags, Huhtamaki Group, Juang Jia Guoo, Ronpak, Aspire Packaging, Dempson, and Novolex. Understand their market share and competitive advantages.
- Emerging Trends: Identify key trends like sustainability, innovation in materials, and evolving consumer preferences.
- Future Outlook: Gain insights into potential growth drivers and strategic opportunities for long-term success.
Food Grade Bags Market Dynamics & Concentration
This section analyzes the market concentration, innovation drivers, regulatory frameworks, product substitutes, end-user trends, and M&A activities within the food grade bags industry. The global food grade bags market is moderately concentrated, with the top 10 players accounting for approximately xx% of the market share in 2025. Market consolidation through M&A activities has been relatively modest in recent years, with approximately xx major deals concluded during the historical period (2019-2024). Innovation in materials, such as biodegradable and compostable options, is a major driver, fueled by growing consumer demand for sustainable packaging solutions. Stringent regulatory frameworks concerning food safety and environmental protection are shaping the industry landscape. The primary substitute for food grade bags is rigid packaging (e.g., plastic containers), but the convenience and cost-effectiveness of bags maintain their dominance. End-user trends reflect a shift towards smaller pack sizes and increased demand for packaging with enhanced barrier properties to extend shelf life.
- Market Concentration: Top 10 players hold xx% market share (2025).
- M&A Activity: Approximately xx major deals between 2019 and 2024.
- Innovation Drivers: Biodegradable and compostable materials are key drivers.
- Regulatory Landscape: Stringent food safety and environmental regulations are influential.
- End-User Trends: Growing preference for smaller pack sizes and enhanced barrier properties.
Food Grade Bags Industry Trends & Analysis
The food grade bags market is experiencing robust growth, driven by factors such as rising demand for packaged food and beverages, increasing disposable incomes in emerging economies, and technological advancements in packaging materials. The CAGR for the period 2025-2033 is estimated to be xx%, reflecting a significant market expansion. Market penetration of sustainable and eco-friendly food grade bags is steadily increasing, driven by growing environmental concerns and regulatory pressures. The industry is witnessing technological disruptions in the form of advanced materials (e.g., bioplastics, barrier films), automation in manufacturing processes, and improved printing techniques. Consumer preferences are evolving towards sustainable and convenient packaging solutions, emphasizing recyclability, compostability, and ease of use. Competitive dynamics are shaped by factors such as pricing strategies, product innovation, and brand reputation.
- CAGR (2025-2033): xx%
- Market Penetration of Sustainable Bags: Steadily increasing.
- Technological Disruptions: Advanced materials, automation, and improved printing.
- Consumer Preferences: Emphasis on sustainability and convenience.
Leading Markets & Segments in Food Grade Bags
The Asia Pacific region dominates the global food grade bags market, fueled by rapid economic growth, expanding food processing industries, and a burgeoning middle class with increased disposable income. China and India are key drivers within this region, exhibiting strong growth rates exceeding the global average. This dominance is further reinforced by favorable government policies supporting the food processing sector and the development of robust infrastructure. Other significant markets include North America and Europe, which exhibit steady growth driven by factors such as increasing demand for convenience food and robust e-commerce sectors.
Dominant Region: Asia Pacific (China and India are key drivers).
Key Drivers (Asia Pacific):
- Rapid economic growth
- Expanding food processing industries
- Growing middle class
- Favorable government policies
- Robust infrastructure development
Other Significant Markets: North America and Europe.
Food Grade Bags Product Developments
Recent innovations in food grade bags focus on enhancing barrier properties to extend shelf life, improving recyclability and compostability, and incorporating features that enhance convenience for consumers. Advances in material science have led to the development of bio-based and compostable polymers, providing sustainable alternatives to traditional plastic films. These developments cater to growing consumer demand for environmentally friendly packaging solutions and meet stricter regulatory requirements. The market is witnessing the introduction of bags with improved functionalities, such as resealable closures and tamper-evident seals, enhancing product protection and consumer convenience.
Key Drivers of Food Grade Bags Growth
The growth of the food grade bags market is driven by a confluence of factors. The increasing demand for convenient and ready-to-eat food products fuels the need for effective packaging solutions. Economic growth, particularly in emerging markets, increases consumer spending on packaged foods. Stricter food safety regulations necessitate the use of high-quality, food-grade materials. Technological advancements in materials science and manufacturing processes lead to improved product attributes and cost-efficiency.
Challenges in the Food Grade Bags Market
The food grade bags market faces challenges such as fluctuating raw material prices, which impact production costs. Stringent environmental regulations necessitate the use of sustainable materials, which can be more expensive than traditional plastics. Intense competition among manufacturers puts pressure on profit margins. Supply chain disruptions caused by global events or regional conflicts can affect the availability of raw materials and finished goods. These challenges necessitate the adoption of strategic sourcing and efficient supply chain management practices.
Emerging Opportunities in Food Grade Bags
The food grade bags market presents significant long-term opportunities. The growing demand for sustainable packaging solutions presents a major growth driver. Strategic partnerships and collaborations between packaging companies and food producers can optimize supply chains and enhance product offerings. Expansion into emerging markets with high growth potential, such as Africa and Latin America, opens up new avenues for market penetration. Technological advancements in material science and manufacturing processes offer opportunities for continuous innovation.
Leading Players in the Food Grade Bags Sector
- Mondi
- Napco National
- OYKA
- Taurus Packaging
- Go Green
- Manchester Paper Bags
- Huhtamaki Group
- Juang Jia Guoo
- Ronpak
- Aspire Packaging
- Dempson
- Novolex
Key Milestones in Food Grade Bags Industry
- 2020: Introduction of a new biodegradable film by Mondi.
- 2021: Acquisition of a smaller packaging company by Huhtamaki Group.
- 2022: Launch of a recyclable food-grade bag by Novolex.
- 2023: Implementation of new sustainability standards by several industry players.
- 2024: Significant investment in sustainable packaging technology by leading players.
Strategic Outlook for Food Grade Bags Market
The food grade bags market is poised for sustained growth, driven by factors such as increasing demand for convenience foods, rising disposable incomes, and the adoption of sustainable packaging solutions. Strategic investments in research and development, focus on sustainability, and exploration of new markets present significant opportunities for players seeking to capitalize on long-term market potential. Strategic partnerships and collaborations can enhance supply chain efficiency and strengthen market positioning. The continued evolution of materials science and manufacturing technologies will offer further growth opportunities in the years to come.
Food Grade Bags Segmentation
-
1. Application
- 1.1. Fast Food
- 1.2. Bakery
- 1.3. Restaurants and Hotels
- 1.4. Others
-
2. Type
- 2.1. Paper Bags
- 2.2. Plastic Bags
Food Grade Bags Segmentation By Geography
-
1. North America
- 1.1. United States
- 1.2. Canada
- 1.3. Mexico
-
2. South America
- 2.1. Brazil
- 2.2. Argentina
- 2.3. Rest of South America
-
3. Europe
- 3.1. United Kingdom
- 3.2. Germany
- 3.3. France
- 3.4. Italy
- 3.5. Spain
- 3.6. Russia
- 3.7. Benelux
- 3.8. Nordics
- 3.9. Rest of Europe
-
4. Middle East & Africa
- 4.1. Turkey
- 4.2. Israel
- 4.3. GCC
- 4.4. North Africa
- 4.5. South Africa
- 4.6. Rest of Middle East & Africa
-
5. Asia Pacific
- 5.1. China
- 5.2. India
- 5.3. Japan
- 5.4. South Korea
- 5.5. ASEAN
- 5.6. Oceania
- 5.7. Rest of Asia Pacific
Food Grade Bags REPORT HIGHLIGHTS
| Aspects | Details |
|---|---|
| Study Period | 2019-2033 |
| Base Year | 2024 |
| Estimated Year | 2025 |
| Forecast Period | 2025-2033 |
| Historical Period | 2019-2024 |
| Growth Rate | CAGR of 1.5% from 2019-2033 |
| Segmentation |
|
Table of Contents
- 1. Introduction
- 1.1. Research Scope
- 1.2. Market Segmentation
- 1.3. Research Methodology
- 1.4. Definitions and Assumptions
- 2. Executive Summary
- 2.1. Introduction
- 3. Market Dynamics
- 3.1. Introduction
- 3.2. Market Drivers
- 3.3. Market Restrains
- 3.4. Market Trends
- 4. Market Factor Analysis
- 4.1. Porters Five Forces
- 4.2. Supply/Value Chain
- 4.3. PESTEL analysis
- 4.4. Market Entropy
- 4.5. Patent/Trademark Analysis
- 5. Global Food Grade Bags Analysis, Insights and Forecast, 2019-2031
- 5.1. Market Analysis, Insights and Forecast - by Application
- 5.1.1. Fast Food
- 5.1.2. Bakery
- 5.1.3. Restaurants and Hotels
- 5.1.4. Others
- 5.2. Market Analysis, Insights and Forecast - by Type
- 5.2.1. Paper Bags
- 5.2.2. Plastic Bags
- 5.3. Market Analysis, Insights and Forecast - by Region
- 5.3.1. North America
- 5.3.2. South America
- 5.3.3. Europe
- 5.3.4. Middle East & Africa
- 5.3.5. Asia Pacific
- 5.1. Market Analysis, Insights and Forecast - by Application
- 6. North America Food Grade Bags Analysis, Insights and Forecast, 2019-2031
- 6.1. Market Analysis, Insights and Forecast - by Application
- 6.1.1. Fast Food
- 6.1.2. Bakery
- 6.1.3. Restaurants and Hotels
- 6.1.4. Others
- 6.2. Market Analysis, Insights and Forecast - by Type
- 6.2.1. Paper Bags
- 6.2.2. Plastic Bags
- 6.1. Market Analysis, Insights and Forecast - by Application
- 7. South America Food Grade Bags Analysis, Insights and Forecast, 2019-2031
- 7.1. Market Analysis, Insights and Forecast - by Application
- 7.1.1. Fast Food
- 7.1.2. Bakery
- 7.1.3. Restaurants and Hotels
- 7.1.4. Others
- 7.2. Market Analysis, Insights and Forecast - by Type
- 7.2.1. Paper Bags
- 7.2.2. Plastic Bags
- 7.1. Market Analysis, Insights and Forecast - by Application
- 8. Europe Food Grade Bags Analysis, Insights and Forecast, 2019-2031
- 8.1. Market Analysis, Insights and Forecast - by Application
- 8.1.1. Fast Food
- 8.1.2. Bakery
- 8.1.3. Restaurants and Hotels
- 8.1.4. Others
- 8.2. Market Analysis, Insights and Forecast - by Type
- 8.2.1. Paper Bags
- 8.2.2. Plastic Bags
- 8.1. Market Analysis, Insights and Forecast - by Application
- 9. Middle East & Africa Food Grade Bags Analysis, Insights and Forecast, 2019-2031
- 9.1. Market Analysis, Insights and Forecast - by Application
- 9.1.1. Fast Food
- 9.1.2. Bakery
- 9.1.3. Restaurants and Hotels
- 9.1.4. Others
- 9.2. Market Analysis, Insights and Forecast - by Type
- 9.2.1. Paper Bags
- 9.2.2. Plastic Bags
- 9.1. Market Analysis, Insights and Forecast - by Application
- 10. Asia Pacific Food Grade Bags Analysis, Insights and Forecast, 2019-2031
- 10.1. Market Analysis, Insights and Forecast - by Application
- 10.1.1. Fast Food
- 10.1.2. Bakery
- 10.1.3. Restaurants and Hotels
- 10.1.4. Others
- 10.2. Market Analysis, Insights and Forecast - by Type
- 10.2.1. Paper Bags
- 10.2.2. Plastic Bags
- 10.1. Market Analysis, Insights and Forecast - by Application
- 11. Competitive Analysis
- 11.1. Global Market Share Analysis 2024
- 11.2. Company Profiles
- 11.2.1 Mondi
- 11.2.1.1. Overview
- 11.2.1.2. Products
- 11.2.1.3. SWOT Analysis
- 11.2.1.4. Recent Developments
- 11.2.1.5. Financials (Based on Availability)
- 11.2.2 Napco National
- 11.2.2.1. Overview
- 11.2.2.2. Products
- 11.2.2.3. SWOT Analysis
- 11.2.2.4. Recent Developments
- 11.2.2.5. Financials (Based on Availability)
- 11.2.3 OYKA
- 11.2.3.1. Overview
- 11.2.3.2. Products
- 11.2.3.3. SWOT Analysis
- 11.2.3.4. Recent Developments
- 11.2.3.5. Financials (Based on Availability)
- 11.2.4 Taurus Packaging
- 11.2.4.1. Overview
- 11.2.4.2. Products
- 11.2.4.3. SWOT Analysis
- 11.2.4.4. Recent Developments
- 11.2.4.5. Financials (Based on Availability)
- 11.2.5 Go Green
- 11.2.5.1. Overview
- 11.2.5.2. Products
- 11.2.5.3. SWOT Analysis
- 11.2.5.4. Recent Developments
- 11.2.5.5. Financials (Based on Availability)
- 11.2.6 Manchester Paper Bags
- 11.2.6.1. Overview
- 11.2.6.2. Products
- 11.2.6.3. SWOT Analysis
- 11.2.6.4. Recent Developments
- 11.2.6.5. Financials (Based on Availability)
- 11.2.7 Huhtamaki Group
- 11.2.7.1. Overview
- 11.2.7.2. Products
- 11.2.7.3. SWOT Analysis
- 11.2.7.4. Recent Developments
- 11.2.7.5. Financials (Based on Availability)
- 11.2.8 Juang Jia Guoo
- 11.2.8.1. Overview
- 11.2.8.2. Products
- 11.2.8.3. SWOT Analysis
- 11.2.8.4. Recent Developments
- 11.2.8.5. Financials (Based on Availability)
- 11.2.9 Ronpak
- 11.2.9.1. Overview
- 11.2.9.2. Products
- 11.2.9.3. SWOT Analysis
- 11.2.9.4. Recent Developments
- 11.2.9.5. Financials (Based on Availability)
- 11.2.10 Aspire Packaging
- 11.2.10.1. Overview
- 11.2.10.2. Products
- 11.2.10.3. SWOT Analysis
- 11.2.10.4. Recent Developments
- 11.2.10.5. Financials (Based on Availability)
- 11.2.11 Dempson
- 11.2.11.1. Overview
- 11.2.11.2. Products
- 11.2.11.3. SWOT Analysis
- 11.2.11.4. Recent Developments
- 11.2.11.5. Financials (Based on Availability)
- 11.2.12 Novolex
- 11.2.12.1. Overview
- 11.2.12.2. Products
- 11.2.12.3. SWOT Analysis
- 11.2.12.4. Recent Developments
- 11.2.12.5. Financials (Based on Availability)
- 11.2.1 Mondi
List of Figures
- Figure 1: Global Food Grade Bags Revenue Breakdown (million, %) by Region 2024 & 2032
- Figure 2: Global Food Grade Bags Volume Breakdown (K, %) by Region 2024 & 2032
- Figure 3: North America Food Grade Bags Revenue (million), by Application 2024 & 2032
- Figure 4: North America Food Grade Bags Volume (K), by Application 2024 & 2032
- Figure 5: North America Food Grade Bags Revenue Share (%), by Application 2024 & 2032
- Figure 6: North America Food Grade Bags Volume Share (%), by Application 2024 & 2032
- Figure 7: North America Food Grade Bags Revenue (million), by Type 2024 & 2032
- Figure 8: North America Food Grade Bags Volume (K), by Type 2024 & 2032
- Figure 9: North America Food Grade Bags Revenue Share (%), by Type 2024 & 2032
- Figure 10: North America Food Grade Bags Volume Share (%), by Type 2024 & 2032
- Figure 11: North America Food Grade Bags Revenue (million), by Country 2024 & 2032
- Figure 12: North America Food Grade Bags Volume (K), by Country 2024 & 2032
- Figure 13: North America Food Grade Bags Revenue Share (%), by Country 2024 & 2032
- Figure 14: North America Food Grade Bags Volume Share (%), by Country 2024 & 2032
- Figure 15: South America Food Grade Bags Revenue (million), by Application 2024 & 2032
- Figure 16: South America Food Grade Bags Volume (K), by Application 2024 & 2032
- Figure 17: South America Food Grade Bags Revenue Share (%), by Application 2024 & 2032
- Figure 18: South America Food Grade Bags Volume Share (%), by Application 2024 & 2032
- Figure 19: South America Food Grade Bags Revenue (million), by Type 2024 & 2032
- Figure 20: South America Food Grade Bags Volume (K), by Type 2024 & 2032
- Figure 21: South America Food Grade Bags Revenue Share (%), by Type 2024 & 2032
- Figure 22: South America Food Grade Bags Volume Share (%), by Type 2024 & 2032
- Figure 23: South America Food Grade Bags Revenue (million), by Country 2024 & 2032
- Figure 24: South America Food Grade Bags Volume (K), by Country 2024 & 2032
- Figure 25: South America Food Grade Bags Revenue Share (%), by Country 2024 & 2032
- Figure 26: South America Food Grade Bags Volume Share (%), by Country 2024 & 2032
- Figure 27: Europe Food Grade Bags Revenue (million), by Application 2024 & 2032
- Figure 28: Europe Food Grade Bags Volume (K), by Application 2024 & 2032
- Figure 29: Europe Food Grade Bags Revenue Share (%), by Application 2024 & 2032
- Figure 30: Europe Food Grade Bags Volume Share (%), by Application 2024 & 2032
- Figure 31: Europe Food Grade Bags Revenue (million), by Type 2024 & 2032
- Figure 32: Europe Food Grade Bags Volume (K), by Type 2024 & 2032
- Figure 33: Europe Food Grade Bags Revenue Share (%), by Type 2024 & 2032
- Figure 34: Europe Food Grade Bags Volume Share (%), by Type 2024 & 2032
- Figure 35: Europe Food Grade Bags Revenue (million), by Country 2024 & 2032
- Figure 36: Europe Food Grade Bags Volume (K), by Country 2024 & 2032
- Figure 37: Europe Food Grade Bags Revenue Share (%), by Country 2024 & 2032
- Figure 38: Europe Food Grade Bags Volume Share (%), by Country 2024 & 2032
- Figure 39: Middle East & Africa Food Grade Bags Revenue (million), by Application 2024 & 2032
- Figure 40: Middle East & Africa Food Grade Bags Volume (K), by Application 2024 & 2032
- Figure 41: Middle East & Africa Food Grade Bags Revenue Share (%), by Application 2024 & 2032
- Figure 42: Middle East & Africa Food Grade Bags Volume Share (%), by Application 2024 & 2032
- Figure 43: Middle East & Africa Food Grade Bags Revenue (million), by Type 2024 & 2032
- Figure 44: Middle East & Africa Food Grade Bags Volume (K), by Type 2024 & 2032
- Figure 45: Middle East & Africa Food Grade Bags Revenue Share (%), by Type 2024 & 2032
- Figure 46: Middle East & Africa Food Grade Bags Volume Share (%), by Type 2024 & 2032
- Figure 47: Middle East & Africa Food Grade Bags Revenue (million), by Country 2024 & 2032
- Figure 48: Middle East & Africa Food Grade Bags Volume (K), by Country 2024 & 2032
- Figure 49: Middle East & Africa Food Grade Bags Revenue Share (%), by Country 2024 & 2032
- Figure 50: Middle East & Africa Food Grade Bags Volume Share (%), by Country 2024 & 2032
- Figure 51: Asia Pacific Food Grade Bags Revenue (million), by Application 2024 & 2032
- Figure 52: Asia Pacific Food Grade Bags Volume (K), by Application 2024 & 2032
- Figure 53: Asia Pacific Food Grade Bags Revenue Share (%), by Application 2024 & 2032
- Figure 54: Asia Pacific Food Grade Bags Volume Share (%), by Application 2024 & 2032
- Figure 55: Asia Pacific Food Grade Bags Revenue (million), by Type 2024 & 2032
- Figure 56: Asia Pacific Food Grade Bags Volume (K), by Type 2024 & 2032
- Figure 57: Asia Pacific Food Grade Bags Revenue Share (%), by Type 2024 & 2032
- Figure 58: Asia Pacific Food Grade Bags Volume Share (%), by Type 2024 & 2032
- Figure 59: Asia Pacific Food Grade Bags Revenue (million), by Country 2024 & 2032
- Figure 60: Asia Pacific Food Grade Bags Volume (K), by Country 2024 & 2032
- Figure 61: Asia Pacific Food Grade Bags Revenue Share (%), by Country 2024 & 2032
- Figure 62: Asia Pacific Food Grade Bags Volume Share (%), by Country 2024 & 2032
List of Tables
- Table 1: Global Food Grade Bags Revenue million Forecast, by Region 2019 & 2032
- Table 2: Global Food Grade Bags Volume K Forecast, by Region 2019 & 2032
- Table 3: Global Food Grade Bags Revenue million Forecast, by Application 2019 & 2032
- Table 4: Global Food Grade Bags Volume K Forecast, by Application 2019 & 2032
- Table 5: Global Food Grade Bags Revenue million Forecast, by Type 2019 & 2032
- Table 6: Global Food Grade Bags Volume K Forecast, by Type 2019 & 2032
- Table 7: Global Food Grade Bags Revenue million Forecast, by Region 2019 & 2032
- Table 8: Global Food Grade Bags Volume K Forecast, by Region 2019 & 2032
- Table 9: Global Food Grade Bags Revenue million Forecast, by Application 2019 & 2032
- Table 10: Global Food Grade Bags Volume K Forecast, by Application 2019 & 2032
- Table 11: Global Food Grade Bags Revenue million Forecast, by Type 2019 & 2032
- Table 12: Global Food Grade Bags Volume K Forecast, by Type 2019 & 2032
- Table 13: Global Food Grade Bags Revenue million Forecast, by Country 2019 & 2032
- Table 14: Global Food Grade Bags Volume K Forecast, by Country 2019 & 2032
- Table 15: United States Food Grade Bags Revenue (million) Forecast, by Application 2019 & 2032
- Table 16: United States Food Grade Bags Volume (K) Forecast, by Application 2019 & 2032
- Table 17: Canada Food Grade Bags Revenue (million) Forecast, by Application 2019 & 2032
- Table 18: Canada Food Grade Bags Volume (K) Forecast, by Application 2019 & 2032
- Table 19: Mexico Food Grade Bags Revenue (million) Forecast, by Application 2019 & 2032
- Table 20: Mexico Food Grade Bags Volume (K) Forecast, by Application 2019 & 2032
- Table 21: Global Food Grade Bags Revenue million Forecast, by Application 2019 & 2032
- Table 22: Global Food Grade Bags Volume K Forecast, by Application 2019 & 2032
- Table 23: Global Food Grade Bags Revenue million Forecast, by Type 2019 & 2032
- Table 24: Global Food Grade Bags Volume K Forecast, by Type 2019 & 2032
- Table 25: Global Food Grade Bags Revenue million Forecast, by Country 2019 & 2032
- Table 26: Global Food Grade Bags Volume K Forecast, by Country 2019 & 2032
- Table 27: Brazil Food Grade Bags Revenue (million) Forecast, by Application 2019 & 2032
- Table 28: Brazil Food Grade Bags Volume (K) Forecast, by Application 2019 & 2032
- Table 29: Argentina Food Grade Bags Revenue (million) Forecast, by Application 2019 & 2032
- Table 30: Argentina Food Grade Bags Volume (K) Forecast, by Application 2019 & 2032
- Table 31: Rest of South America Food Grade Bags Revenue (million) Forecast, by Application 2019 & 2032
- Table 32: Rest of South America Food Grade Bags Volume (K) Forecast, by Application 2019 & 2032
- Table 33: Global Food Grade Bags Revenue million Forecast, by Application 2019 & 2032
- Table 34: Global Food Grade Bags Volume K Forecast, by Application 2019 & 2032
- Table 35: Global Food Grade Bags Revenue million Forecast, by Type 2019 & 2032
- Table 36: Global Food Grade Bags Volume K Forecast, by Type 2019 & 2032
- Table 37: Global Food Grade Bags Revenue million Forecast, by Country 2019 & 2032
- Table 38: Global Food Grade Bags Volume K Forecast, by Country 2019 & 2032
- Table 39: United Kingdom Food Grade Bags Revenue (million) Forecast, by Application 2019 & 2032
- Table 40: United Kingdom Food Grade Bags Volume (K) Forecast, by Application 2019 & 2032
- Table 41: Germany Food Grade Bags Revenue (million) Forecast, by Application 2019 & 2032
- Table 42: Germany Food Grade Bags Volume (K) Forecast, by Application 2019 & 2032
- Table 43: France Food Grade Bags Revenue (million) Forecast, by Application 2019 & 2032
- Table 44: France Food Grade Bags Volume (K) Forecast, by Application 2019 & 2032
- Table 45: Italy Food Grade Bags Revenue (million) Forecast, by Application 2019 & 2032
- Table 46: Italy Food Grade Bags Volume (K) Forecast, by Application 2019 & 2032
- Table 47: Spain Food Grade Bags Revenue (million) Forecast, by Application 2019 & 2032
- Table 48: Spain Food Grade Bags Volume (K) Forecast, by Application 2019 & 2032
- Table 49: Russia Food Grade Bags Revenue (million) Forecast, by Application 2019 & 2032
- Table 50: Russia Food Grade Bags Volume (K) Forecast, by Application 2019 & 2032
- Table 51: Benelux Food Grade Bags Revenue (million) Forecast, by Application 2019 & 2032
- Table 52: Benelux Food Grade Bags Volume (K) Forecast, by Application 2019 & 2032
- Table 53: Nordics Food Grade Bags Revenue (million) Forecast, by Application 2019 & 2032
- Table 54: Nordics Food Grade Bags Volume (K) Forecast, by Application 2019 & 2032
- Table 55: Rest of Europe Food Grade Bags Revenue (million) Forecast, by Application 2019 & 2032
- Table 56: Rest of Europe Food Grade Bags Volume (K) Forecast, by Application 2019 & 2032
- Table 57: Global Food Grade Bags Revenue million Forecast, by Application 2019 & 2032
- Table 58: Global Food Grade Bags Volume K Forecast, by Application 2019 & 2032
- Table 59: Global Food Grade Bags Revenue million Forecast, by Type 2019 & 2032
- Table 60: Global Food Grade Bags Volume K Forecast, by Type 2019 & 2032
- Table 61: Global Food Grade Bags Revenue million Forecast, by Country 2019 & 2032
- Table 62: Global Food Grade Bags Volume K Forecast, by Country 2019 & 2032
- Table 63: Turkey Food Grade Bags Revenue (million) Forecast, by Application 2019 & 2032
- Table 64: Turkey Food Grade Bags Volume (K) Forecast, by Application 2019 & 2032
- Table 65: Israel Food Grade Bags Revenue (million) Forecast, by Application 2019 & 2032
- Table 66: Israel Food Grade Bags Volume (K) Forecast, by Application 2019 & 2032
- Table 67: GCC Food Grade Bags Revenue (million) Forecast, by Application 2019 & 2032
- Table 68: GCC Food Grade Bags Volume (K) Forecast, by Application 2019 & 2032
- Table 69: North Africa Food Grade Bags Revenue (million) Forecast, by Application 2019 & 2032
- Table 70: North Africa Food Grade Bags Volume (K) Forecast, by Application 2019 & 2032
- Table 71: South Africa Food Grade Bags Revenue (million) Forecast, by Application 2019 & 2032
- Table 72: South Africa Food Grade Bags Volume (K) Forecast, by Application 2019 & 2032
- Table 73: Rest of Middle East & Africa Food Grade Bags Revenue (million) Forecast, by Application 2019 & 2032
- Table 74: Rest of Middle East & Africa Food Grade Bags Volume (K) Forecast, by Application 2019 & 2032
- Table 75: Global Food Grade Bags Revenue million Forecast, by Application 2019 & 2032
- Table 76: Global Food Grade Bags Volume K Forecast, by Application 2019 & 2032
- Table 77: Global Food Grade Bags Revenue million Forecast, by Type 2019 & 2032
- Table 78: Global Food Grade Bags Volume K Forecast, by Type 2019 & 2032
- Table 79: Global Food Grade Bags Revenue million Forecast, by Country 2019 & 2032
- Table 80: Global Food Grade Bags Volume K Forecast, by Country 2019 & 2032
- Table 81: China Food Grade Bags Revenue (million) Forecast, by Application 2019 & 2032
- Table 82: China Food Grade Bags Volume (K) Forecast, by Application 2019 & 2032
- Table 83: India Food Grade Bags Revenue (million) Forecast, by Application 2019 & 2032
- Table 84: India Food Grade Bags Volume (K) Forecast, by Application 2019 & 2032
- Table 85: Japan Food Grade Bags Revenue (million) Forecast, by Application 2019 & 2032
- Table 86: Japan Food Grade Bags Volume (K) Forecast, by Application 2019 & 2032
- Table 87: South Korea Food Grade Bags Revenue (million) Forecast, by Application 2019 & 2032
- Table 88: South Korea Food Grade Bags Volume (K) Forecast, by Application 2019 & 2032
- Table 89: ASEAN Food Grade Bags Revenue (million) Forecast, by Application 2019 & 2032
- Table 90: ASEAN Food Grade Bags Volume (K) Forecast, by Application 2019 & 2032
- Table 91: Oceania Food Grade Bags Revenue (million) Forecast, by Application 2019 & 2032
- Table 92: Oceania Food Grade Bags Volume (K) Forecast, by Application 2019 & 2032
- Table 93: Rest of Asia Pacific Food Grade Bags Revenue (million) Forecast, by Application 2019 & 2032
- Table 94: Rest of Asia Pacific Food Grade Bags Volume (K) Forecast, by Application 2019 & 2032
Frequently Asked Questions
1. What is the projected Compound Annual Growth Rate (CAGR) of the Food Grade Bags?
The projected CAGR is approximately 1.5%.
2. Which companies are prominent players in the Food Grade Bags?
Key companies in the market include Mondi, Napco National, OYKA, Taurus Packaging, Go Green, Manchester Paper Bags, Huhtamaki Group, Juang Jia Guoo, Ronpak, Aspire Packaging, Dempson, Novolex.
3. What are the main segments of the Food Grade Bags?
The market segments include Application, Type.
4. Can you provide details about the market size?
The market size is estimated to be USD 12040 million as of 2022.
5. What are some drivers contributing to market growth?
N/A
6. What are the notable trends driving market growth?
N/A
7. Are there any restraints impacting market growth?
N/A
8. Can you provide examples of recent developments in the market?
N/A
9. What pricing options are available for accessing the report?
Pricing options include single-user, multi-user, and enterprise licenses priced at USD 3950.00, USD 5925.00, and USD 7900.00 respectively.
10. Is the market size provided in terms of value or volume?
The market size is provided in terms of value, measured in million and volume, measured in K.
11. Are there any specific market keywords associated with the report?
Yes, the market keyword associated with the report is "Food Grade Bags," which aids in identifying and referencing the specific market segment covered.
12. How do I determine which pricing option suits my needs best?
The pricing options vary based on user requirements and access needs. Individual users may opt for single-user licenses, while businesses requiring broader access may choose multi-user or enterprise licenses for cost-effective access to the report.
13. Are there any additional resources or data provided in the Food Grade Bags report?
While the report offers comprehensive insights, it's advisable to review the specific contents or supplementary materials provided to ascertain if additional resources or data are available.
14. How can I stay updated on further developments or reports in the Food Grade Bags?
To stay informed about further developments, trends, and reports in the Food Grade Bags, consider subscribing to industry newsletters, following relevant companies and organizations, or regularly checking reputable industry news sources and publications.
Methodology
Step 1 - Identification of Relevant Samples Size from Population Database


Step 2 - Approaches for Defining Global Market Size (Value, Volume* & Price*)

Note*: In applicable scenarios
Step 3 - Data Sources
Primary Research
- Web Analytics
- Survey Reports
- Research Institute
- Latest Research Reports
- Opinion Leaders
Secondary Research
- Annual Reports
- White Paper
- Latest Press Release
- Industry Association
- Paid Database
- Investor Presentations

Step 4 - Data Triangulation
Involves using different sources of information in order to increase the validity of a study
These sources are likely to be stakeholders in a program - participants, other researchers, program staff, other community members, and so on.
Then we put all data in single framework & apply various statistical tools to find out the dynamic on the market.
During the analysis stage, feedback from the stakeholder groups would be compared to determine areas of agreement as well as areas of divergence
