

Key Insights
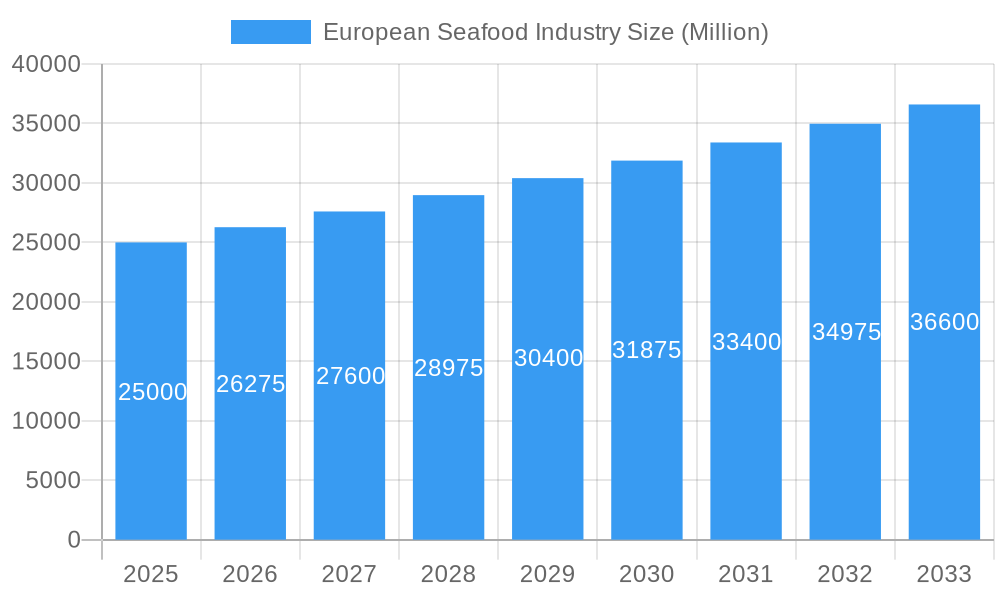
The European seafood market is estimated at €10.38 billion in 2025 and is projected to expand at a Compound Annual Growth Rate (CAGR) of 4.4% from 2025 to 2033. This growth is attributed to heightened consumer awareness of seafood's health benefits, including its rich protein and omega-3 content. The increasing demand for sustainably and ethically sourced seafood further fuels market expansion. Innovations in product development, such as ready-to-eat meals and value-added seafood, align with evolving consumer lifestyles. The market is also supported by the expansion of organized retail and e-commerce channels. However, challenges like price volatility due to supply chain issues and environmental concerns necessitate a focus on responsible sourcing and transparent supply chains.
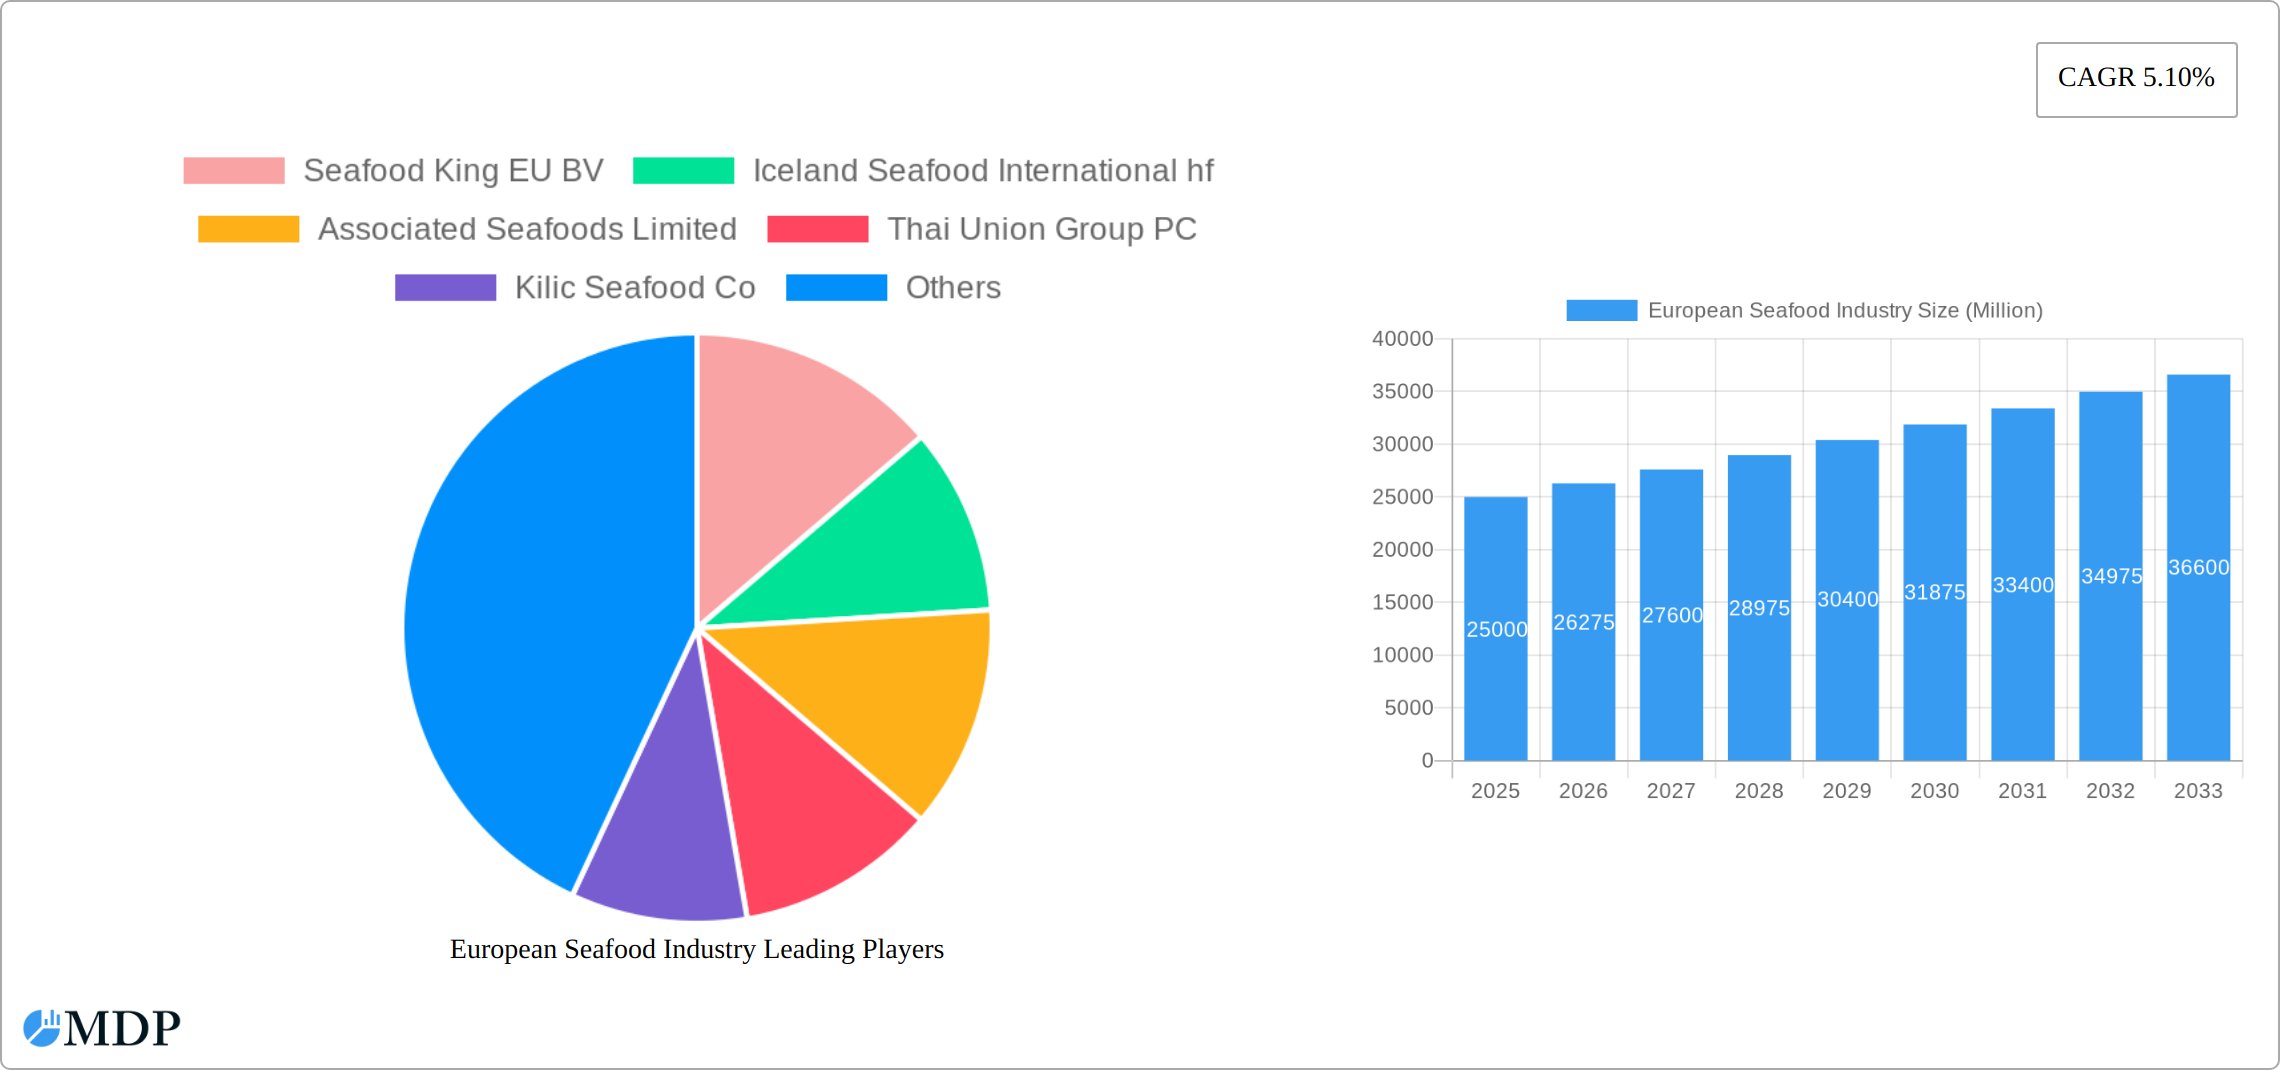
European Seafood Industry Market Size (In Billion)
Market segmentation highlights diverse trends across product forms (canned, fresh/chilled, frozen, processed), distribution channels (off-trade, on-trade), seafood types (fish, shrimp, other seafood), and key markets including Germany, France, and the UK. The processed seafood segment shows robust growth due to convenience and extended shelf life. The competitive landscape features both multinational corporations and regional players. Key companies like Seafood King EU BV, Iceland Seafood International hf, and Thai Union Group PC are actively pursuing strategic initiatives such as innovation and acquisitions. The forecast period (2025-2033) predicts sustained market growth, influenced by economic conditions, sustainable fishing regulations, and consumer demand shifts.
European Seafood Industry Company Market Share
European Seafood Industry: A Comprehensive Market Report (2019-2033)
This comprehensive report provides an in-depth analysis of the European seafood industry, covering market dynamics, leading players, emerging trends, and future growth prospects. The study period spans from 2019 to 2033, with a base year of 2025 and a forecast period from 2025 to 2033. This report is crucial for industry stakeholders, investors, and businesses seeking to understand and capitalize on opportunities within this dynamic market. The report features data and insights on major players such as Mowi ASA, Royal Greenland AS, and Iceland Seafood International hf, among others. Discover actionable insights and navigate the complexities of this thriving sector.
European Seafood Industry Market Dynamics & Concentration
The European seafood industry is characterized by a moderate level of concentration, with a few large players holding significant market share, alongside numerous smaller, regional operators. In 2024, the top 5 companies held an estimated xx% market share. Market dynamics are influenced by several factors:
- Innovation Drivers: Technological advancements in fishing techniques, processing, and preservation are driving efficiency and product diversification.
- Regulatory Frameworks: Strict EU regulations concerning sustainability, traceability, and food safety significantly shape industry practices and costs.
- Product Substitutes: Plant-based seafood alternatives are emerging as substitutes, impacting market share particularly within specific segments.
- End-User Trends: Growing consumer demand for healthy, sustainable, and ethically sourced seafood is impacting purchasing decisions.
- M&A Activities: The industry has witnessed xx M&A deals in the past five years, driven by consolidation, expansion, and access to new markets and technologies.
European Seafood Industry Industry Trends & Analysis
The European seafood market is experiencing robust growth, with a projected CAGR of xx% during the forecast period (2025-2033). Key factors driving this growth include:
- Rising disposable incomes: Increased purchasing power in several European countries fuels demand for premium seafood products.
- Growing health consciousness: Consumers are increasingly aware of the nutritional benefits of seafood, leading to higher consumption.
- Technological advancements: Automation in processing and distribution enhances efficiency and reduces costs, while innovative packaging solutions extend shelf life.
- E-commerce penetration: Online sales platforms are expanding access to a wider consumer base, driving market growth.
- Intensified competition: Increased competition among established players and new entrants fosters innovation and pricing pressures, although ultimately it also bolsters market growth. The market penetration of frozen seafood, in particular, has significantly increased in recent years.
Leading Markets & Segments in European Seafood Industry
The European seafood market is a dynamic landscape, with the United Kingdom, Germany, and France consistently ranking as the top consumers. However, consumption patterns are evolving, revealing key growth segments within this substantial market:
- Frozen Seafood: This segment continues to experience robust growth, driven by its extended shelf life, convenience, and cost-effectiveness. Technological advancements in freezing techniques further enhance product quality and appeal, leading to a high compound annual growth rate (CAGR).
- Off-Trade Distribution (Retail): Supermarkets and hypermarkets remain the dominant distribution channels for seafood, representing the largest market segment. This underscores the importance of strategic partnerships within the retail sector for seafood producers and distributors.
- Value-Added Products: Ready-to-eat meals and other convenient, pre-prepared seafood products are experiencing significant growth, reflecting the increasing consumer demand for time-saving meal solutions. This segment capitalizes on evolving culinary trends and busy lifestyles.
- Sustainable and Traceable Seafood: Growing consumer awareness of environmental and social responsibility is driving demand for sustainably sourced and traceable seafood. This trend is influencing sourcing practices and transparency throughout the supply chain.
Key Growth Drivers:
- Robust Retail Infrastructure: Europe's sophisticated retail networks facilitate efficient and widespread distribution of seafood products, reaching a broad consumer base.
- Rising Disposable Incomes (Western Europe): Higher disposable incomes in Western European countries are fueling demand for higher-value seafood products, including premium species and convenient options.
- Government Initiatives & Sustainability Focus: Government policies supporting sustainable fishing practices, aquaculture development, and traceability initiatives are creating a more favorable environment for market growth and responsible sourcing.
- Innovation in Packaging and Processing: Advancements in packaging technologies, such as modified atmosphere packaging (MAP) and improved freezing methods, are extending shelf life, reducing waste, and maintaining product quality throughout the supply chain.
European Seafood Industry Product Developments
The European seafood industry is characterized by continuous innovation, driven by evolving consumer preferences and technological advancements. Recent examples include:
- Sustainable Aquaculture Practices: The adoption of more sustainable and environmentally responsible aquaculture techniques is crucial for meeting the growing demand for seafood while minimizing environmental impact.
- Value-Added Processed Products: Ready-to-eat meals, marinated seafood, and other convenient, high-value products are gaining popularity, catering to time-constrained consumers.
- Extended Shelf-Life Packaging: Innovations in packaging technologies, such as modified atmosphere packaging (MAP) and sous vide techniques, significantly extend the shelf life of seafood products, reducing waste and improving product availability.
- Technological Advancements: Improved freezing technologies, advanced processing techniques, and innovative preservation methods are enhancing both the quality and shelf life of seafood products.
Key Drivers of European Seafood Industry Growth
Technological advancements in fishing and processing, coupled with increasing consumer demand for healthy and sustainable seafood, are key drivers of market growth. Favorable economic conditions and supportive government regulations promoting sustainable aquaculture further fuel expansion. The rise of e-commerce also plays a role.
Challenges in the European Seafood Industry Market
Despite its significant size and potential, the European seafood industry faces a number of challenges that impact profitability and sustainability:
- Fluctuating Raw Material Prices: Global market dynamics and environmental factors influence raw material prices, creating uncertainty for businesses operating in the sector.
- Stringent Regulations: Compliance with stringent food safety and environmental regulations can significantly impact profitability and operational efficiency for seafood producers.
- Supply Chain Disruptions: Global events and logistical challenges can disrupt supply chains, impacting the availability and cost of seafood products.
- Competition from Plant-Based Alternatives: The growing popularity of plant-based protein alternatives presents a competitive challenge to the traditional seafood market.
- Sustainability Concerns: Ensuring sustainable and responsible sourcing practices is crucial for maintaining consumer trust and mitigating environmental risks.
Emerging Opportunities in European Seafood Industry
Emerging opportunities lie in the expansion of sustainable aquaculture, development of innovative seafood products, and leveraging e-commerce for wider market reach. Strategic partnerships and investments in research and development are crucial for long-term growth.
Leading Players in the European Seafood Industry Sector
- Seafood King EU BV
- Iceland Seafood International hf
- Associated Seafoods Limited
- Thai Union Group PC
- Kilic Seafood Co
- Bolton Group SRL
- Grieg Seafood ASA
- Sykes Seafood Ltd
- Nomad Foods Limited
- Austevoll Seafood ASA
- Nordic Seafood AS
- Royal Greenland AS
- Sofina Foods
- Mowi ASA
Key Milestones in European Seafood Industry Industry
- March 2023: Mowi ASA's commissioning of a new, state-of-the-art seafood production facility in Hitra, Norway, marks a significant expansion of their production capacity and underscores investments in technological advancements within the industry.
- December 2022: Leroy Seafood Denmark's acquisition of Mondo Mar Marine Foods demonstrates strategic consolidation within the market and strengthens their position in the cod and saithe segments.
- June 2022: The cooperation agreement between Royal Greenland and Espersen highlights the importance of strategic partnerships in enhancing production efficiency and market reach, particularly in key regions like Koszalin.
- Ongoing Developments: The European seafood industry is constantly evolving, with further mergers, acquisitions, and technological advancements expected in the coming years.
Strategic Outlook for European Seafood Industry Market
The European seafood industry is poised for continued growth, driven by evolving consumer preferences, technological innovations, and a growing focus on sustainability. Strategic partnerships, investments in sustainable aquaculture, and product diversification will be key to success in this dynamic and competitive market. The market is expected to reach a value of xx Million by 2033.
European Seafood Industry Segmentation
-
1. Type
- 1.1. Fish
- 1.2. Shrimp
- 1.3. Other Seafood
-
2. Form
- 2.1. Canned
- 2.2. Fresh / Chilled
- 2.3. Frozen
- 2.4. Processed
-
3. Distribution Channel
-
3.1. Off-Trade
- 3.1.1. Convenience Stores
- 3.1.2. Online Channel
- 3.1.3. Supermarkets and Hypermarkets
- 3.1.4. Others
- 3.2. On-Trade
-
3.1. Off-Trade
European Seafood Industry Segmentation By Geography
-
1. Europe
- 1.1. United Kingdom
- 1.2. Germany
- 1.3. France
- 1.4. Italy
- 1.5. Spain
- 1.6. Netherlands
- 1.7. Belgium
- 1.8. Sweden
- 1.9. Norway
- 1.10. Poland
- 1.11. Denmark
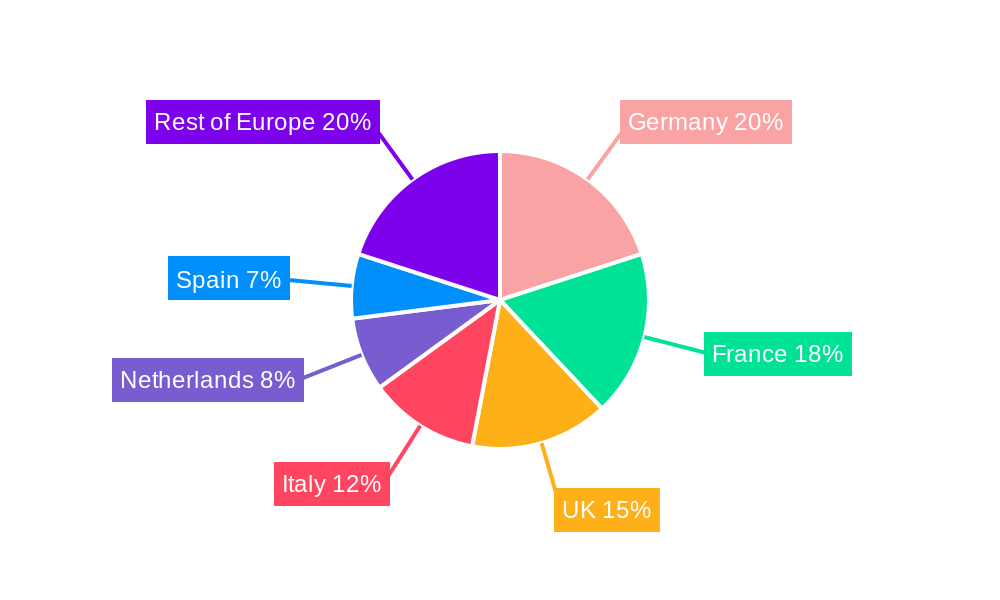
European Seafood Industry Regional Market Share
Geographic Coverage of European Seafood Industry
European Seafood Industry REPORT HIGHLIGHTS
| Aspects | Details |
|---|---|
| Study Period | 2020-2034 |
| Base Year | 2025 |
| Estimated Year | 2026 |
| Forecast Period | 2026-2034 |
| Historical Period | 2020-2025 |
| Growth Rate | CAGR of 4.4% from 2020-2034 |
| Segmentation |
|
Table of Contents
- 1. Introduction
- 1.1. Research Scope
- 1.2. Market Segmentation
- 1.3. Research Methodology
- 1.4. Definitions and Assumptions
- 2. Executive Summary
- 2.1. Introduction
- 3. Market Dynamics
- 3.1. Introduction
- 3.2. Market Drivers
- 3.2.1. Increased Consumption of Baked Goods; Demand for Indigenous Fermented Foods
- 3.3. Market Restrains
- 3.3.1. Potential Side-effects of Yeast
- 3.4. Market Trends
- 3.4.1. OTHER KEY INDUSTRY TRENDS COVERED IN THE REPORT
- 4. Market Factor Analysis
- 4.1. Porters Five Forces
- 4.2. Supply/Value Chain
- 4.3. PESTEL analysis
- 4.4. Market Entropy
- 4.5. Patent/Trademark Analysis
- 5. European Seafood Industry Analysis, Insights and Forecast, 2020-2032
- 5.1. Market Analysis, Insights and Forecast - by Type
- 5.1.1. Fish
- 5.1.2. Shrimp
- 5.1.3. Other Seafood
- 5.2. Market Analysis, Insights and Forecast - by Form
- 5.2.1. Canned
- 5.2.2. Fresh / Chilled
- 5.2.3. Frozen
- 5.2.4. Processed
- 5.3. Market Analysis, Insights and Forecast - by Distribution Channel
- 5.3.1. Off-Trade
- 5.3.1.1. Convenience Stores
- 5.3.1.2. Online Channel
- 5.3.1.3. Supermarkets and Hypermarkets
- 5.3.1.4. Others
- 5.3.2. On-Trade
- 5.3.1. Off-Trade
- 5.4. Market Analysis, Insights and Forecast - by Region
- 5.4.1. Europe
- 5.1. Market Analysis, Insights and Forecast - by Type
- 6. Competitive Analysis
- 6.1. Market Share Analysis 2025
- 6.2. Company Profiles
- 6.2.1 Seafood King EU BV
- 6.2.1.1. Overview
- 6.2.1.2. Products
- 6.2.1.3. SWOT Analysis
- 6.2.1.4. Recent Developments
- 6.2.1.5. Financials (Based on Availability)
- 6.2.2 Iceland Seafood International hf
- 6.2.2.1. Overview
- 6.2.2.2. Products
- 6.2.2.3. SWOT Analysis
- 6.2.2.4. Recent Developments
- 6.2.2.5. Financials (Based on Availability)
- 6.2.3 Associated Seafoods Limited
- 6.2.3.1. Overview
- 6.2.3.2. Products
- 6.2.3.3. SWOT Analysis
- 6.2.3.4. Recent Developments
- 6.2.3.5. Financials (Based on Availability)
- 6.2.4 Thai Union Group PC
- 6.2.4.1. Overview
- 6.2.4.2. Products
- 6.2.4.3. SWOT Analysis
- 6.2.4.4. Recent Developments
- 6.2.4.5. Financials (Based on Availability)
- 6.2.5 Kilic Seafood Co
- 6.2.5.1. Overview
- 6.2.5.2. Products
- 6.2.5.3. SWOT Analysis
- 6.2.5.4. Recent Developments
- 6.2.5.5. Financials (Based on Availability)
- 6.2.6 Bolton Group SRL
- 6.2.6.1. Overview
- 6.2.6.2. Products
- 6.2.6.3. SWOT Analysis
- 6.2.6.4. Recent Developments
- 6.2.6.5. Financials (Based on Availability)
- 6.2.7 Grieg Seafood ASA
- 6.2.7.1. Overview
- 6.2.7.2. Products
- 6.2.7.3. SWOT Analysis
- 6.2.7.4. Recent Developments
- 6.2.7.5. Financials (Based on Availability)
- 6.2.8 Sykes Seafood Ltd
- 6.2.8.1. Overview
- 6.2.8.2. Products
- 6.2.8.3. SWOT Analysis
- 6.2.8.4. Recent Developments
- 6.2.8.5. Financials (Based on Availability)
- 6.2.9 Nomad Foods Limited
- 6.2.9.1. Overview
- 6.2.9.2. Products
- 6.2.9.3. SWOT Analysis
- 6.2.9.4. Recent Developments
- 6.2.9.5. Financials (Based on Availability)
- 6.2.10 Austevoll Seafood ASA
- 6.2.10.1. Overview
- 6.2.10.2. Products
- 6.2.10.3. SWOT Analysis
- 6.2.10.4. Recent Developments
- 6.2.10.5. Financials (Based on Availability)
- 6.2.11 Nordic Seafood AS
- 6.2.11.1. Overview
- 6.2.11.2. Products
- 6.2.11.3. SWOT Analysis
- 6.2.11.4. Recent Developments
- 6.2.11.5. Financials (Based on Availability)
- 6.2.12 Royal Greenland AS
- 6.2.12.1. Overview
- 6.2.12.2. Products
- 6.2.12.3. SWOT Analysis
- 6.2.12.4. Recent Developments
- 6.2.12.5. Financials (Based on Availability)
- 6.2.13 Sofina Foods
- 6.2.13.1. Overview
- 6.2.13.2. Products
- 6.2.13.3. SWOT Analysis
- 6.2.13.4. Recent Developments
- 6.2.13.5. Financials (Based on Availability)
- 6.2.14 Mowi ASA
- 6.2.14.1. Overview
- 6.2.14.2. Products
- 6.2.14.3. SWOT Analysis
- 6.2.14.4. Recent Developments
- 6.2.14.5. Financials (Based on Availability)
- 6.2.1 Seafood King EU BV
List of Figures
- Figure 1: European Seafood Industry Revenue Breakdown (billion, %) by Product 2025 & 2033
- Figure 2: European Seafood Industry Share (%) by Company 2025
List of Tables
- Table 1: European Seafood Industry Revenue billion Forecast, by Type 2020 & 2033
- Table 2: European Seafood Industry Volume K Tons Forecast, by Type 2020 & 2033
- Table 3: European Seafood Industry Revenue billion Forecast, by Form 2020 & 2033
- Table 4: European Seafood Industry Volume K Tons Forecast, by Form 2020 & 2033
- Table 5: European Seafood Industry Revenue billion Forecast, by Distribution Channel 2020 & 2033
- Table 6: European Seafood Industry Volume K Tons Forecast, by Distribution Channel 2020 & 2033
- Table 7: European Seafood Industry Revenue billion Forecast, by Region 2020 & 2033
- Table 8: European Seafood Industry Volume K Tons Forecast, by Region 2020 & 2033
- Table 9: European Seafood Industry Revenue billion Forecast, by Type 2020 & 2033
- Table 10: European Seafood Industry Volume K Tons Forecast, by Type 2020 & 2033
- Table 11: European Seafood Industry Revenue billion Forecast, by Form 2020 & 2033
- Table 12: European Seafood Industry Volume K Tons Forecast, by Form 2020 & 2033
- Table 13: European Seafood Industry Revenue billion Forecast, by Distribution Channel 2020 & 2033
- Table 14: European Seafood Industry Volume K Tons Forecast, by Distribution Channel 2020 & 2033
- Table 15: European Seafood Industry Revenue billion Forecast, by Country 2020 & 2033
- Table 16: European Seafood Industry Volume K Tons Forecast, by Country 2020 & 2033
- Table 17: United Kingdom European Seafood Industry Revenue (billion) Forecast, by Application 2020 & 2033
- Table 18: United Kingdom European Seafood Industry Volume (K Tons) Forecast, by Application 2020 & 2033
- Table 19: Germany European Seafood Industry Revenue (billion) Forecast, by Application 2020 & 2033
- Table 20: Germany European Seafood Industry Volume (K Tons) Forecast, by Application 2020 & 2033
- Table 21: France European Seafood Industry Revenue (billion) Forecast, by Application 2020 & 2033
- Table 22: France European Seafood Industry Volume (K Tons) Forecast, by Application 2020 & 2033
- Table 23: Italy European Seafood Industry Revenue (billion) Forecast, by Application 2020 & 2033
- Table 24: Italy European Seafood Industry Volume (K Tons) Forecast, by Application 2020 & 2033
- Table 25: Spain European Seafood Industry Revenue (billion) Forecast, by Application 2020 & 2033
- Table 26: Spain European Seafood Industry Volume (K Tons) Forecast, by Application 2020 & 2033
- Table 27: Netherlands European Seafood Industry Revenue (billion) Forecast, by Application 2020 & 2033
- Table 28: Netherlands European Seafood Industry Volume (K Tons) Forecast, by Application 2020 & 2033
- Table 29: Belgium European Seafood Industry Revenue (billion) Forecast, by Application 2020 & 2033
- Table 30: Belgium European Seafood Industry Volume (K Tons) Forecast, by Application 2020 & 2033
- Table 31: Sweden European Seafood Industry Revenue (billion) Forecast, by Application 2020 & 2033
- Table 32: Sweden European Seafood Industry Volume (K Tons) Forecast, by Application 2020 & 2033
- Table 33: Norway European Seafood Industry Revenue (billion) Forecast, by Application 2020 & 2033
- Table 34: Norway European Seafood Industry Volume (K Tons) Forecast, by Application 2020 & 2033
- Table 35: Poland European Seafood Industry Revenue (billion) Forecast, by Application 2020 & 2033
- Table 36: Poland European Seafood Industry Volume (K Tons) Forecast, by Application 2020 & 2033
- Table 37: Denmark European Seafood Industry Revenue (billion) Forecast, by Application 2020 & 2033
- Table 38: Denmark European Seafood Industry Volume (K Tons) Forecast, by Application 2020 & 2033
Frequently Asked Questions
1. What is the projected Compound Annual Growth Rate (CAGR) of the European Seafood Industry?
The projected CAGR is approximately 4.4%.
2. Which companies are prominent players in the European Seafood Industry?
Key companies in the market include Seafood King EU BV, Iceland Seafood International hf, Associated Seafoods Limited, Thai Union Group PC, Kilic Seafood Co, Bolton Group SRL, Grieg Seafood ASA, Sykes Seafood Ltd, Nomad Foods Limited, Austevoll Seafood ASA, Nordic Seafood AS, Royal Greenland AS, Sofina Foods, Mowi ASA.
3. What are the main segments of the European Seafood Industry?
The market segments include Type, Form, Distribution Channel.
4. Can you provide details about the market size?
The market size is estimated to be USD 10.38 billion as of 2022.
5. What are some drivers contributing to market growth?
Increased Consumption of Baked Goods; Demand for Indigenous Fermented Foods.
6. What are the notable trends driving market growth?
OTHER KEY INDUSTRY TRENDS COVERED IN THE REPORT.
7. Are there any restraints impacting market growth?
Potential Side-effects of Yeast.
8. Can you provide examples of recent developments in the market?
March 2023: Mowi ASA has built a new state of the art facility at Hitra in Norway for the production of seafood.December 2022: Leroy Seafood Denmark has acquired Danish whitefish supplier Mondo Mar Marine Foods, which mainly focuses on cod fish and saithe.June 2022: Royal Greenland and Espersen signed a new cooperation agreement enabling continued strong seafood category development based on production in Koszalin.
9. What pricing options are available for accessing the report?
Pricing options include single-user, multi-user, and enterprise licenses priced at USD 3800, USD 4500, and USD 5800 respectively.
10. Is the market size provided in terms of value or volume?
The market size is provided in terms of value, measured in billion and volume, measured in K Tons.
11. Are there any specific market keywords associated with the report?
Yes, the market keyword associated with the report is "European Seafood Industry," which aids in identifying and referencing the specific market segment covered.
12. How do I determine which pricing option suits my needs best?
The pricing options vary based on user requirements and access needs. Individual users may opt for single-user licenses, while businesses requiring broader access may choose multi-user or enterprise licenses for cost-effective access to the report.
13. Are there any additional resources or data provided in the European Seafood Industry report?
While the report offers comprehensive insights, it's advisable to review the specific contents or supplementary materials provided to ascertain if additional resources or data are available.
14. How can I stay updated on further developments or reports in the European Seafood Industry?
To stay informed about further developments, trends, and reports in the European Seafood Industry, consider subscribing to industry newsletters, following relevant companies and organizations, or regularly checking reputable industry news sources and publications.
Methodology
Step 1 - Identification of Relevant Samples Size from Population Database


Step 2 - Approaches for Defining Global Market Size (Value, Volume* & Price*)

Note*: In applicable scenarios
Step 3 - Data Sources
Primary Research
- Web Analytics
- Survey Reports
- Research Institute
- Latest Research Reports
- Opinion Leaders
Secondary Research
- Annual Reports
- White Paper
- Latest Press Release
- Industry Association
- Paid Database
- Investor Presentations

Step 4 - Data Triangulation
Involves using different sources of information in order to increase the validity of a study
These sources are likely to be stakeholders in a program - participants, other researchers, program staff, other community members, and so on.
Then we put all data in single framework & apply various statistical tools to find out the dynamic on the market.
During the analysis stage, feedback from the stakeholder groups would be compared to determine areas of agreement as well as areas of divergence