

Key Insights
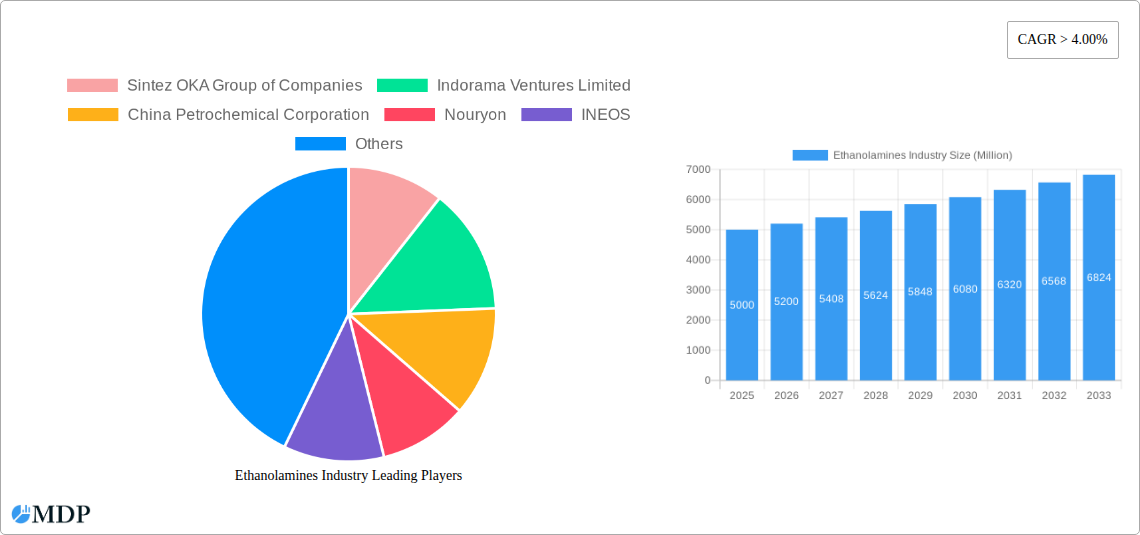
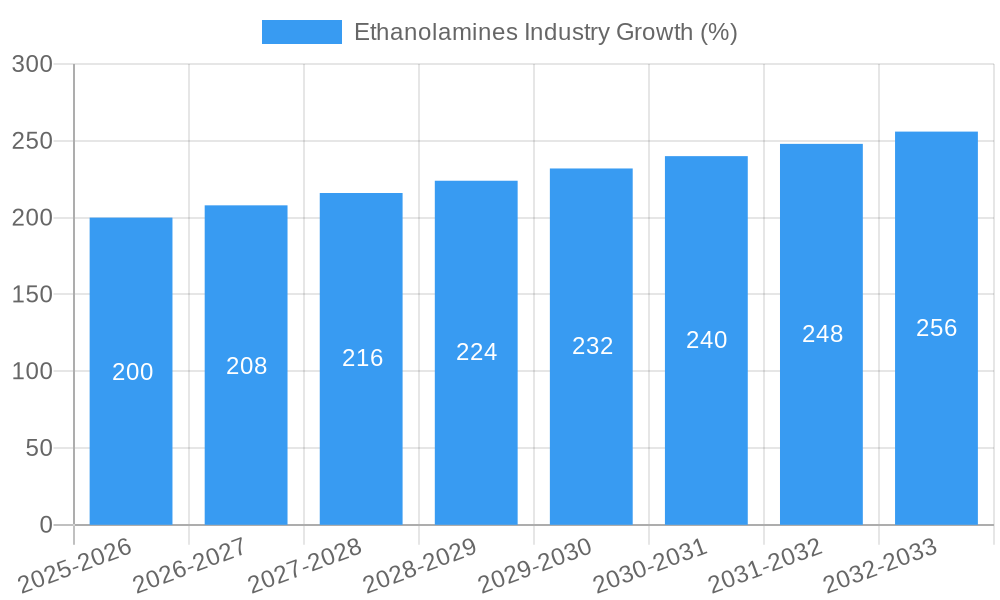
The global ethanolamines market is experiencing robust growth, projected to maintain a CAGR exceeding 4% from 2025 to 2033. This expansion is driven by increasing demand across diverse sectors, particularly in the personal care, agricultural, and oil & gas industries. The surge in the personal care segment is fueled by the widespread use of ethanolamines in cosmetics, soaps, and shampoos as emulsifiers and pH adjusters. Simultaneously, the agricultural sector's reliance on ethanolamines in pesticide formulations and fertilizer production is contributing significantly to market growth. Furthermore, the oil and gas industry utilizes ethanolamines for gas purification and acid gas removal, further stimulating market demand. Technological advancements focusing on improved production efficiency and the development of eco-friendly alternatives are key trends shaping the market landscape. However, fluctuating raw material prices and stringent environmental regulations pose significant challenges to market expansion. The market is segmented by product type (MEA, DEA, TEA) and end-user industry, with MEA currently holding the largest market share due to its wide range of applications. Regionally, Asia Pacific, particularly China and India, is anticipated to dominate the market due to its strong industrial growth and substantial manufacturing capacity. The competitive landscape is characterized by the presence of both large multinational corporations and regional players, leading to intense competition and innovation in product development and market penetration. The forecast period reflects a continued upward trajectory, driven by consistent demand across core industries and the potential for expansion into emerging markets.
The competitive landscape is highly fragmented, with both major players like BASF SE, Dow, and INEOS, and regional players vying for market share. Strategic alliances, mergers and acquisitions, and continuous product development efforts are defining the competitive dynamics. The market's future growth is strongly linked to economic growth in key regions, especially developing economies in Asia and the Middle East. Efforts to increase the sustainability of production processes and reduce environmental impact are crucial for long-term market growth and acceptance. Market players are actively focusing on developing more sustainable and efficient production methods to meet growing environmental concerns. The projected market value for 2025, considering the provided CAGR and existing market size information (though not explicitly given, inferable based on standard market analysis reports), would be in the several billion dollar range.
Ethanolamines Industry Market Report: 2019-2033
This comprehensive report provides an in-depth analysis of the global ethanolamines market, offering invaluable insights for industry stakeholders, investors, and strategic decision-makers. Covering the period from 2019 to 2033, with a base year of 2025, this report meticulously examines market dynamics, trends, leading players, and future growth prospects. The report forecasts a market value exceeding XX Million by 2033, presenting a compelling opportunity for growth and investment.
Ethanolamines Industry Market Dynamics & Concentration
The global ethanolamines market is characterized by a moderately concentrated landscape, with key players such as BASF SE, Dow, and Ineos holding significant market share. The market's dynamics are shaped by several factors, including:
- Market Concentration: The top 10 players account for approximately 60% of the global market share in 2025. This concentration is expected to remain relatively stable over the forecast period, although smaller players might gain traction through strategic acquisitions and product differentiation.
- Innovation Drivers: Technological advancements in production processes, leading to enhanced efficiency and reduced costs, are key drivers. The development of sustainable and biodegradable ethanolamines is gaining traction, driven by environmental concerns.
- Regulatory Frameworks: Stringent environmental regulations concerning emissions and waste disposal are impacting manufacturing practices and driving investments in cleaner technologies. Regional variations in these regulations influence market dynamics.
- Product Substitutes: While direct substitutes for ethanolamines are limited, companies are exploring alternative chemicals for specific applications, posing a moderate threat to market growth.
- End-User Trends: The growing demand across diverse end-user sectors, such as oil and gas, personal care, and construction, is a key driver. Shifting preferences toward sustainable products are impacting demand patterns.
- M&A Activities: The industry has witnessed a moderate number of mergers and acquisitions (M&A) deals in recent years (approximately xx deals between 2019-2024), mainly focused on expanding production capacity and gaining market share. This trend is expected to continue, albeit at a moderate pace.
Ethanolamines Industry Industry Trends & Analysis
The global ethanolamines market is projected to experience a Compound Annual Growth Rate (CAGR) of xx% during the forecast period (2025-2033). This robust growth is driven by:
- Increasing demand from end-use sectors: The construction, oil & gas, and personal care industries are major drivers of market growth. The rising global population and infrastructure development fuel demand.
- Technological advancements: Improvements in manufacturing processes, leading to higher efficiency and reduced production costs, are enhancing market competitiveness.
- Growing preference for sustainable products: The increasing emphasis on environmentally friendly products is encouraging the development and adoption of sustainable ethanolamines.
- Competitive dynamics: The market is witnessing increased competition, with major players focusing on capacity expansion and product innovation to maintain market share.
- Market penetration: The penetration of ethanolamines in emerging economies is expected to increase, further contributing to overall market growth.
Leading Markets & Segments in Ethanolamines Industry
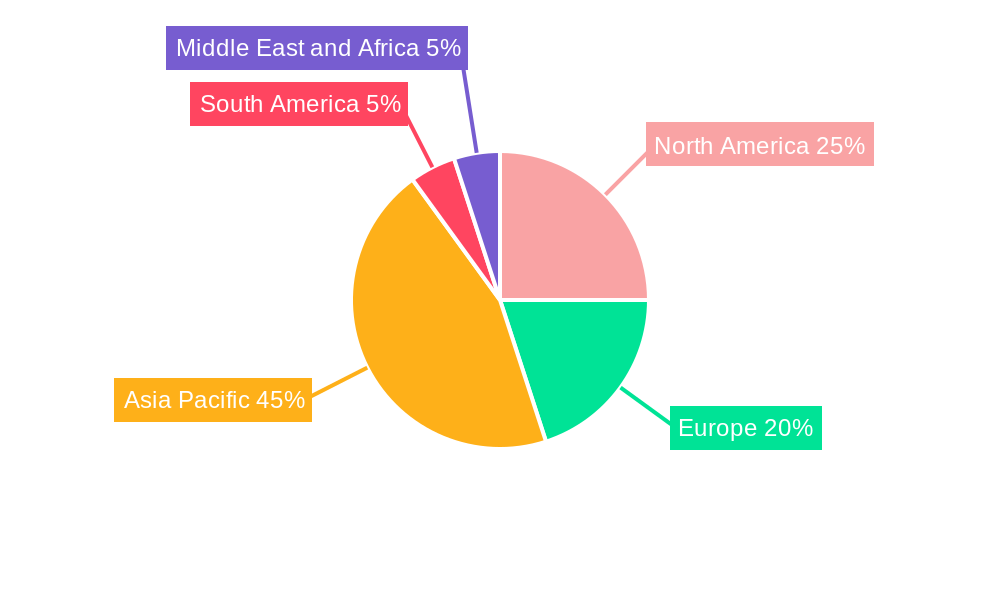
The Asia-Pacific region is the dominant market for ethanolamines, driven by rapid industrialization and significant demand from the construction and oil & gas sectors. China and India are particularly important within this region.
- Product Type: Triethanolamine (TEA) holds the largest market share among the product types, followed by Diethanolamine (DEA) and Monoethanolamine (MEA). This is primarily due to TEA's widespread applications in various industries.
- End-user Industry: The oil and gas industry is the largest consumer of ethanolamines globally, followed by personal care and construction. Growth in these sectors directly influences market demand.
Key Drivers in Leading Regions:
- Asia-Pacific: Rapid industrialization, rising disposable incomes, and increasing government investments in infrastructure development.
- North America: Strong presence of major manufacturers, robust demand from the oil and gas sector, and relatively stable economic conditions.
- Europe: Focus on sustainable products and stringent environmental regulations driving demand for eco-friendly ethanolamines.
Ethanolamines Industry Product Developments
Recent product developments focus on enhancing the performance and efficiency of ethanolamines while addressing environmental concerns. This includes the development of biodegradable and more environmentally compatible products targeted at specific applications in personal care and other sensitive sectors. Innovations primarily focus on improving product purity, stability, and reducing the environmental impact of production processes. These advancements are crucial for securing market share and maintaining a competitive edge.
Key Drivers of Ethanolamines Industry Growth
Several factors are driving the growth of the ethanolamines industry:
- Rising demand from various end-use sectors: Continued growth in construction, personal care, and the oil & gas industries.
- Technological advancements in manufacturing: Increased production efficiency and cost reduction through optimized processes.
- Government support for sustainable chemicals: Incentives promoting the use of environmentally friendly products.
Challenges in the Ethanolamines Industry Market
The industry faces several challenges:
- Fluctuations in raw material prices: The cost of raw materials significantly impacts production costs and profitability.
- Stringent environmental regulations: Compliance with ever-stricter environmental regulations necessitates significant investment in pollution control technologies.
- Intense competition: The market is highly competitive, with many established players and emerging companies vying for market share.
Emerging Opportunities in Ethanolamines Industry
Emerging opportunities include:
- Expanding into new applications: Exploring new uses in sectors such as renewable energy and pharmaceuticals.
- Strategic partnerships and collaborations: Joint ventures to improve production efficiency and expand market access.
- Focus on sustainable and biodegradable products: Meeting growing environmental concerns and consumer demand.
Leading Players in the Ethanolamines Industry Sector
- Sintez OKA Group of Companies
- Indorama Ventures Limited
- China Petrochemical Corporation
- Nouryon
- INEOS
- OUCC
- BASF SE
- LyondellBasell Industries Holdings B V
- SABIC
- Dow
- Jiaxing Jinyan Chemical Co Ltd
Key Milestones in Ethanolamines Industry Industry
- March 2022: BASF builds a new plant for alkyl ethanolamines at the Antwerp site, increasing its global alkyl ethanolamine capacity to 140,000 metric tons per year. This expansion significantly boosted BASF's production capacity and market competitiveness.
- April 2022: BASF and SINOPEC announced the expansion of the Verbund site run by BASF-YPC Co., Ltd., a 50-50 joint venture in Nanjing. This collaboration aimed at increasing the production capacity of ethanolamines and other chemicals, solidifying their position in the market.
Strategic Outlook for Ethanolamines Industry Market
The future of the ethanolamines market looks promising, driven by continued growth in key end-use sectors and increasing demand for sustainable products. Strategic opportunities lie in investing in efficient production technologies, developing innovative products, and expanding into new geographic markets. Focusing on sustainability and collaborating with key stakeholders will be crucial for success in this dynamic market.
Ethanolamines Industry Segmentation
-
1. Product Type
- 1.1. Monoethanolamine (MEA)
- 1.2. Diethanolamine (DEA)
- 1.3. Triethanolamine (TEA)
-
2. End-user Industry
- 2.1. Agriculture
- 2.2. Construction
- 2.3. Personal Care
- 2.4. Oil and Gas
- 2.5. Metallurgy and Metalworking
- 2.6. Textile
- 2.7. Other End-user Industries
Ethanolamines Industry Segmentation By Geography
-
1. Asia Pacific
- 1.1. China
- 1.2. India
- 1.3. Japan
- 1.4. South Korea
- 1.5. Rest of Asia Pacific
-
2. North America
- 2.1. United States
- 2.2. Canada
- 2.3. Mexico
-
3. Europe
- 3.1. Germany
- 3.2. United Kingdom
- 3.3. Italy
- 3.4. France
- 3.5. Rest of Europe
-
4. South America
- 4.1. Brazil
- 4.2. Argentina
- 4.3. Rest of South America
-
5. Middle East and Africa
- 5.1. Saudi Arabia
- 5.2. South Africa
- 5.3. Rest of Middle East and Africa
Ethanolamines Industry REPORT HIGHLIGHTS
| Aspects | Details |
|---|---|
| Study Period | 2019-2033 |
| Base Year | 2024 |
| Estimated Year | 2025 |
| Forecast Period | 2025-2033 |
| Historical Period | 2019-2024 |
| Growth Rate | CAGR of > 4.00% from 2019-2033 |
| Segmentation |
|
Table of Contents
- 1. Introduction
- 1.1. Research Scope
- 1.2. Market Segmentation
- 1.3. Research Methodology
- 1.4. Definitions and Assumptions
- 2. Executive Summary
- 2.1. Introduction
- 3. Market Dynamics
- 3.1. Introduction
- 3.2. Market Drivers
- 3.2.1. Rapid Industrialization Across the Globe; Growing Construction Activities in the Asia-Pacific Region
- 3.3. Market Restrains
- 3.3.1. Increasing Weed Resistance to Weaken the Demand for Glyphosate
- 3.4. Market Trends
- 3.4.1. Expanding Metallurgy and Metalworking Sector
- 4. Market Factor Analysis
- 4.1. Porters Five Forces
- 4.2. Supply/Value Chain
- 4.3. PESTEL analysis
- 4.4. Market Entropy
- 4.5. Patent/Trademark Analysis
- 5. Global Ethanolamines Industry Analysis, Insights and Forecast, 2019-2031
- 5.1. Market Analysis, Insights and Forecast - by Product Type
- 5.1.1. Monoethanolamine (MEA)
- 5.1.2. Diethanolamine (DEA)
- 5.1.3. Triethanolamine (TEA)
- 5.2. Market Analysis, Insights and Forecast - by End-user Industry
- 5.2.1. Agriculture
- 5.2.2. Construction
- 5.2.3. Personal Care
- 5.2.4. Oil and Gas
- 5.2.5. Metallurgy and Metalworking
- 5.2.6. Textile
- 5.2.7. Other End-user Industries
- 5.3. Market Analysis, Insights and Forecast - by Region
- 5.3.1. Asia Pacific
- 5.3.2. North America
- 5.3.3. Europe
- 5.3.4. South America
- 5.3.5. Middle East and Africa
- 5.1. Market Analysis, Insights and Forecast - by Product Type
- 6. Asia Pacific Ethanolamines Industry Analysis, Insights and Forecast, 2019-2031
- 6.1. Market Analysis, Insights and Forecast - by Product Type
- 6.1.1. Monoethanolamine (MEA)
- 6.1.2. Diethanolamine (DEA)
- 6.1.3. Triethanolamine (TEA)
- 6.2. Market Analysis, Insights and Forecast - by End-user Industry
- 6.2.1. Agriculture
- 6.2.2. Construction
- 6.2.3. Personal Care
- 6.2.4. Oil and Gas
- 6.2.5. Metallurgy and Metalworking
- 6.2.6. Textile
- 6.2.7. Other End-user Industries
- 6.1. Market Analysis, Insights and Forecast - by Product Type
- 7. North America Ethanolamines Industry Analysis, Insights and Forecast, 2019-2031
- 7.1. Market Analysis, Insights and Forecast - by Product Type
- 7.1.1. Monoethanolamine (MEA)
- 7.1.2. Diethanolamine (DEA)
- 7.1.3. Triethanolamine (TEA)
- 7.2. Market Analysis, Insights and Forecast - by End-user Industry
- 7.2.1. Agriculture
- 7.2.2. Construction
- 7.2.3. Personal Care
- 7.2.4. Oil and Gas
- 7.2.5. Metallurgy and Metalworking
- 7.2.6. Textile
- 7.2.7. Other End-user Industries
- 7.1. Market Analysis, Insights and Forecast - by Product Type
- 8. Europe Ethanolamines Industry Analysis, Insights and Forecast, 2019-2031
- 8.1. Market Analysis, Insights and Forecast - by Product Type
- 8.1.1. Monoethanolamine (MEA)
- 8.1.2. Diethanolamine (DEA)
- 8.1.3. Triethanolamine (TEA)
- 8.2. Market Analysis, Insights and Forecast - by End-user Industry
- 8.2.1. Agriculture
- 8.2.2. Construction
- 8.2.3. Personal Care
- 8.2.4. Oil and Gas
- 8.2.5. Metallurgy and Metalworking
- 8.2.6. Textile
- 8.2.7. Other End-user Industries
- 8.1. Market Analysis, Insights and Forecast - by Product Type
- 9. South America Ethanolamines Industry Analysis, Insights and Forecast, 2019-2031
- 9.1. Market Analysis, Insights and Forecast - by Product Type
- 9.1.1. Monoethanolamine (MEA)
- 9.1.2. Diethanolamine (DEA)
- 9.1.3. Triethanolamine (TEA)
- 9.2. Market Analysis, Insights and Forecast - by End-user Industry
- 9.2.1. Agriculture
- 9.2.2. Construction
- 9.2.3. Personal Care
- 9.2.4. Oil and Gas
- 9.2.5. Metallurgy and Metalworking
- 9.2.6. Textile
- 9.2.7. Other End-user Industries
- 9.1. Market Analysis, Insights and Forecast - by Product Type
- 10. Middle East and Africa Ethanolamines Industry Analysis, Insights and Forecast, 2019-2031
- 10.1. Market Analysis, Insights and Forecast - by Product Type
- 10.1.1. Monoethanolamine (MEA)
- 10.1.2. Diethanolamine (DEA)
- 10.1.3. Triethanolamine (TEA)
- 10.2. Market Analysis, Insights and Forecast - by End-user Industry
- 10.2.1. Agriculture
- 10.2.2. Construction
- 10.2.3. Personal Care
- 10.2.4. Oil and Gas
- 10.2.5. Metallurgy and Metalworking
- 10.2.6. Textile
- 10.2.7. Other End-user Industries
- 10.1. Market Analysis, Insights and Forecast - by Product Type
- 11. Asia Pacific Ethanolamines Industry Analysis, Insights and Forecast, 2019-2031
- 11.1. Market Analysis, Insights and Forecast - By Country/Sub-region
- 11.1.1 China
- 11.1.2 India
- 11.1.3 Japan
- 11.1.4 South Korea
- 11.1.5 Rest of Asia Pacific
- 12. North America Ethanolamines Industry Analysis, Insights and Forecast, 2019-2031
- 12.1. Market Analysis, Insights and Forecast - By Country/Sub-region
- 12.1.1 United States
- 12.1.2 Canada
- 12.1.3 Mexico
- 13. Europe Ethanolamines Industry Analysis, Insights and Forecast, 2019-2031
- 13.1. Market Analysis, Insights and Forecast - By Country/Sub-region
- 13.1.1 Germany
- 13.1.2 United Kingdom
- 13.1.3 Italy
- 13.1.4 France
- 13.1.5 Rest of Europe
- 14. South America Ethanolamines Industry Analysis, Insights and Forecast, 2019-2031
- 14.1. Market Analysis, Insights and Forecast - By Country/Sub-region
- 14.1.1 Brazil
- 14.1.2 Argentina
- 14.1.3 Rest of South America
- 15. Middle East and Africa Ethanolamines Industry Analysis, Insights and Forecast, 2019-2031
- 15.1. Market Analysis, Insights and Forecast - By Country/Sub-region
- 15.1.1 Saudi Arabia
- 15.1.2 South Africa
- 15.1.3 Rest of Middle East and Africa
- 16. Competitive Analysis
- 16.1. Global Market Share Analysis 2024
- 16.2. Company Profiles
- 16.2.1 Sintez OKA Group of Companies
- 16.2.1.1. Overview
- 16.2.1.2. Products
- 16.2.1.3. SWOT Analysis
- 16.2.1.4. Recent Developments
- 16.2.1.5. Financials (Based on Availability)
- 16.2.2 Indorama Ventures Limited
- 16.2.2.1. Overview
- 16.2.2.2. Products
- 16.2.2.3. SWOT Analysis
- 16.2.2.4. Recent Developments
- 16.2.2.5. Financials (Based on Availability)
- 16.2.3 China Petrochemical Corporation
- 16.2.3.1. Overview
- 16.2.3.2. Products
- 16.2.3.3. SWOT Analysis
- 16.2.3.4. Recent Developments
- 16.2.3.5. Financials (Based on Availability)
- 16.2.4 Nouryon
- 16.2.4.1. Overview
- 16.2.4.2. Products
- 16.2.4.3. SWOT Analysis
- 16.2.4.4. Recent Developments
- 16.2.4.5. Financials (Based on Availability)
- 16.2.5 INEOS
- 16.2.5.1. Overview
- 16.2.5.2. Products
- 16.2.5.3. SWOT Analysis
- 16.2.5.4. Recent Developments
- 16.2.5.5. Financials (Based on Availability)
- 16.2.6 OUCC
- 16.2.6.1. Overview
- 16.2.6.2. Products
- 16.2.6.3. SWOT Analysis
- 16.2.6.4. Recent Developments
- 16.2.6.5. Financials (Based on Availability)
- 16.2.7 BASF SE
- 16.2.7.1. Overview
- 16.2.7.2. Products
- 16.2.7.3. SWOT Analysis
- 16.2.7.4. Recent Developments
- 16.2.7.5. Financials (Based on Availability)
- 16.2.8 LyondellBasell Industries Holdings B V
- 16.2.8.1. Overview
- 16.2.8.2. Products
- 16.2.8.3. SWOT Analysis
- 16.2.8.4. Recent Developments
- 16.2.8.5. Financials (Based on Availability)
- 16.2.9 SABIC
- 16.2.9.1. Overview
- 16.2.9.2. Products
- 16.2.9.3. SWOT Analysis
- 16.2.9.4. Recent Developments
- 16.2.9.5. Financials (Based on Availability)
- 16.2.10 Dow
- 16.2.10.1. Overview
- 16.2.10.2. Products
- 16.2.10.3. SWOT Analysis
- 16.2.10.4. Recent Developments
- 16.2.10.5. Financials (Based on Availability)
- 16.2.11 Jiaxing Jinyan Chemical Co Ltd
- 16.2.11.1. Overview
- 16.2.11.2. Products
- 16.2.11.3. SWOT Analysis
- 16.2.11.4. Recent Developments
- 16.2.11.5. Financials (Based on Availability)
- 16.2.1 Sintez OKA Group of Companies
List of Figures
- Figure 1: Global Ethanolamines Industry Revenue Breakdown (Million, %) by Region 2024 & 2032
- Figure 2: Asia Pacific Ethanolamines Industry Revenue (Million), by Country 2024 & 2032
- Figure 3: Asia Pacific Ethanolamines Industry Revenue Share (%), by Country 2024 & 2032
- Figure 4: North America Ethanolamines Industry Revenue (Million), by Country 2024 & 2032
- Figure 5: North America Ethanolamines Industry Revenue Share (%), by Country 2024 & 2032
- Figure 6: Europe Ethanolamines Industry Revenue (Million), by Country 2024 & 2032
- Figure 7: Europe Ethanolamines Industry Revenue Share (%), by Country 2024 & 2032
- Figure 8: South America Ethanolamines Industry Revenue (Million), by Country 2024 & 2032
- Figure 9: South America Ethanolamines Industry Revenue Share (%), by Country 2024 & 2032
- Figure 10: Middle East and Africa Ethanolamines Industry Revenue (Million), by Country 2024 & 2032
- Figure 11: Middle East and Africa Ethanolamines Industry Revenue Share (%), by Country 2024 & 2032
- Figure 12: Asia Pacific Ethanolamines Industry Revenue (Million), by Product Type 2024 & 2032
- Figure 13: Asia Pacific Ethanolamines Industry Revenue Share (%), by Product Type 2024 & 2032
- Figure 14: Asia Pacific Ethanolamines Industry Revenue (Million), by End-user Industry 2024 & 2032
- Figure 15: Asia Pacific Ethanolamines Industry Revenue Share (%), by End-user Industry 2024 & 2032
- Figure 16: Asia Pacific Ethanolamines Industry Revenue (Million), by Country 2024 & 2032
- Figure 17: Asia Pacific Ethanolamines Industry Revenue Share (%), by Country 2024 & 2032
- Figure 18: North America Ethanolamines Industry Revenue (Million), by Product Type 2024 & 2032
- Figure 19: North America Ethanolamines Industry Revenue Share (%), by Product Type 2024 & 2032
- Figure 20: North America Ethanolamines Industry Revenue (Million), by End-user Industry 2024 & 2032
- Figure 21: North America Ethanolamines Industry Revenue Share (%), by End-user Industry 2024 & 2032
- Figure 22: North America Ethanolamines Industry Revenue (Million), by Country 2024 & 2032
- Figure 23: North America Ethanolamines Industry Revenue Share (%), by Country 2024 & 2032
- Figure 24: Europe Ethanolamines Industry Revenue (Million), by Product Type 2024 & 2032
- Figure 25: Europe Ethanolamines Industry Revenue Share (%), by Product Type 2024 & 2032
- Figure 26: Europe Ethanolamines Industry Revenue (Million), by End-user Industry 2024 & 2032
- Figure 27: Europe Ethanolamines Industry Revenue Share (%), by End-user Industry 2024 & 2032
- Figure 28: Europe Ethanolamines Industry Revenue (Million), by Country 2024 & 2032
- Figure 29: Europe Ethanolamines Industry Revenue Share (%), by Country 2024 & 2032
- Figure 30: South America Ethanolamines Industry Revenue (Million), by Product Type 2024 & 2032
- Figure 31: South America Ethanolamines Industry Revenue Share (%), by Product Type 2024 & 2032
- Figure 32: South America Ethanolamines Industry Revenue (Million), by End-user Industry 2024 & 2032
- Figure 33: South America Ethanolamines Industry Revenue Share (%), by End-user Industry 2024 & 2032
- Figure 34: South America Ethanolamines Industry Revenue (Million), by Country 2024 & 2032
- Figure 35: South America Ethanolamines Industry Revenue Share (%), by Country 2024 & 2032
- Figure 36: Middle East and Africa Ethanolamines Industry Revenue (Million), by Product Type 2024 & 2032
- Figure 37: Middle East and Africa Ethanolamines Industry Revenue Share (%), by Product Type 2024 & 2032
- Figure 38: Middle East and Africa Ethanolamines Industry Revenue (Million), by End-user Industry 2024 & 2032
- Figure 39: Middle East and Africa Ethanolamines Industry Revenue Share (%), by End-user Industry 2024 & 2032
- Figure 40: Middle East and Africa Ethanolamines Industry Revenue (Million), by Country 2024 & 2032
- Figure 41: Middle East and Africa Ethanolamines Industry Revenue Share (%), by Country 2024 & 2032
List of Tables
- Table 1: Global Ethanolamines Industry Revenue Million Forecast, by Region 2019 & 2032
- Table 2: Global Ethanolamines Industry Revenue Million Forecast, by Product Type 2019 & 2032
- Table 3: Global Ethanolamines Industry Revenue Million Forecast, by End-user Industry 2019 & 2032
- Table 4: Global Ethanolamines Industry Revenue Million Forecast, by Region 2019 & 2032
- Table 5: Global Ethanolamines Industry Revenue Million Forecast, by Country 2019 & 2032
- Table 6: China Ethanolamines Industry Revenue (Million) Forecast, by Application 2019 & 2032
- Table 7: India Ethanolamines Industry Revenue (Million) Forecast, by Application 2019 & 2032
- Table 8: Japan Ethanolamines Industry Revenue (Million) Forecast, by Application 2019 & 2032
- Table 9: South Korea Ethanolamines Industry Revenue (Million) Forecast, by Application 2019 & 2032
- Table 10: Rest of Asia Pacific Ethanolamines Industry Revenue (Million) Forecast, by Application 2019 & 2032
- Table 11: Global Ethanolamines Industry Revenue Million Forecast, by Country 2019 & 2032
- Table 12: United States Ethanolamines Industry Revenue (Million) Forecast, by Application 2019 & 2032
- Table 13: Canada Ethanolamines Industry Revenue (Million) Forecast, by Application 2019 & 2032
- Table 14: Mexico Ethanolamines Industry Revenue (Million) Forecast, by Application 2019 & 2032
- Table 15: Global Ethanolamines Industry Revenue Million Forecast, by Country 2019 & 2032
- Table 16: Germany Ethanolamines Industry Revenue (Million) Forecast, by Application 2019 & 2032
- Table 17: United Kingdom Ethanolamines Industry Revenue (Million) Forecast, by Application 2019 & 2032
- Table 18: Italy Ethanolamines Industry Revenue (Million) Forecast, by Application 2019 & 2032
- Table 19: France Ethanolamines Industry Revenue (Million) Forecast, by Application 2019 & 2032
- Table 20: Rest of Europe Ethanolamines Industry Revenue (Million) Forecast, by Application 2019 & 2032
- Table 21: Global Ethanolamines Industry Revenue Million Forecast, by Country 2019 & 2032
- Table 22: Brazil Ethanolamines Industry Revenue (Million) Forecast, by Application 2019 & 2032
- Table 23: Argentina Ethanolamines Industry Revenue (Million) Forecast, by Application 2019 & 2032
- Table 24: Rest of South America Ethanolamines Industry Revenue (Million) Forecast, by Application 2019 & 2032
- Table 25: Global Ethanolamines Industry Revenue Million Forecast, by Country 2019 & 2032
- Table 26: Saudi Arabia Ethanolamines Industry Revenue (Million) Forecast, by Application 2019 & 2032
- Table 27: South Africa Ethanolamines Industry Revenue (Million) Forecast, by Application 2019 & 2032
- Table 28: Rest of Middle East and Africa Ethanolamines Industry Revenue (Million) Forecast, by Application 2019 & 2032
- Table 29: Global Ethanolamines Industry Revenue Million Forecast, by Product Type 2019 & 2032
- Table 30: Global Ethanolamines Industry Revenue Million Forecast, by End-user Industry 2019 & 2032
- Table 31: Global Ethanolamines Industry Revenue Million Forecast, by Country 2019 & 2032
- Table 32: China Ethanolamines Industry Revenue (Million) Forecast, by Application 2019 & 2032
- Table 33: India Ethanolamines Industry Revenue (Million) Forecast, by Application 2019 & 2032
- Table 34: Japan Ethanolamines Industry Revenue (Million) Forecast, by Application 2019 & 2032
- Table 35: South Korea Ethanolamines Industry Revenue (Million) Forecast, by Application 2019 & 2032
- Table 36: Rest of Asia Pacific Ethanolamines Industry Revenue (Million) Forecast, by Application 2019 & 2032
- Table 37: Global Ethanolamines Industry Revenue Million Forecast, by Product Type 2019 & 2032
- Table 38: Global Ethanolamines Industry Revenue Million Forecast, by End-user Industry 2019 & 2032
- Table 39: Global Ethanolamines Industry Revenue Million Forecast, by Country 2019 & 2032
- Table 40: United States Ethanolamines Industry Revenue (Million) Forecast, by Application 2019 & 2032
- Table 41: Canada Ethanolamines Industry Revenue (Million) Forecast, by Application 2019 & 2032
- Table 42: Mexico Ethanolamines Industry Revenue (Million) Forecast, by Application 2019 & 2032
- Table 43: Global Ethanolamines Industry Revenue Million Forecast, by Product Type 2019 & 2032
- Table 44: Global Ethanolamines Industry Revenue Million Forecast, by End-user Industry 2019 & 2032
- Table 45: Global Ethanolamines Industry Revenue Million Forecast, by Country 2019 & 2032
- Table 46: Germany Ethanolamines Industry Revenue (Million) Forecast, by Application 2019 & 2032
- Table 47: United Kingdom Ethanolamines Industry Revenue (Million) Forecast, by Application 2019 & 2032
- Table 48: Italy Ethanolamines Industry Revenue (Million) Forecast, by Application 2019 & 2032
- Table 49: France Ethanolamines Industry Revenue (Million) Forecast, by Application 2019 & 2032
- Table 50: Rest of Europe Ethanolamines Industry Revenue (Million) Forecast, by Application 2019 & 2032
- Table 51: Global Ethanolamines Industry Revenue Million Forecast, by Product Type 2019 & 2032
- Table 52: Global Ethanolamines Industry Revenue Million Forecast, by End-user Industry 2019 & 2032
- Table 53: Global Ethanolamines Industry Revenue Million Forecast, by Country 2019 & 2032
- Table 54: Brazil Ethanolamines Industry Revenue (Million) Forecast, by Application 2019 & 2032
- Table 55: Argentina Ethanolamines Industry Revenue (Million) Forecast, by Application 2019 & 2032
- Table 56: Rest of South America Ethanolamines Industry Revenue (Million) Forecast, by Application 2019 & 2032
- Table 57: Global Ethanolamines Industry Revenue Million Forecast, by Product Type 2019 & 2032
- Table 58: Global Ethanolamines Industry Revenue Million Forecast, by End-user Industry 2019 & 2032
- Table 59: Global Ethanolamines Industry Revenue Million Forecast, by Country 2019 & 2032
- Table 60: Saudi Arabia Ethanolamines Industry Revenue (Million) Forecast, by Application 2019 & 2032
- Table 61: South Africa Ethanolamines Industry Revenue (Million) Forecast, by Application 2019 & 2032
- Table 62: Rest of Middle East and Africa Ethanolamines Industry Revenue (Million) Forecast, by Application 2019 & 2032
Frequently Asked Questions
1. What is the projected Compound Annual Growth Rate (CAGR) of the Ethanolamines Industry?
The projected CAGR is approximately > 4.00%.
2. Which companies are prominent players in the Ethanolamines Industry?
Key companies in the market include Sintez OKA Group of Companies, Indorama Ventures Limited, China Petrochemical Corporation, Nouryon, INEOS, OUCC, BASF SE, LyondellBasell Industries Holdings B V, SABIC, Dow, Jiaxing Jinyan Chemical Co Ltd.
3. What are the main segments of the Ethanolamines Industry?
The market segments include Product Type, End-user Industry.
4. Can you provide details about the market size?
The market size is estimated to be USD XX Million as of 2022.
5. What are some drivers contributing to market growth?
Rapid Industrialization Across the Globe; Growing Construction Activities in the Asia-Pacific Region.
6. What are the notable trends driving market growth?
Expanding Metallurgy and Metalworking Sector.
7. Are there any restraints impacting market growth?
Increasing Weed Resistance to Weaken the Demand for Glyphosate.
8. Can you provide examples of recent developments in the market?
April 2022: BASF and SINOPEC announced the expansion of the Verbund site run by BASF-YPC Co., Ltd. (BASF-YPC), a 50-50 joint venture of both firms in Nanjing. The joint venture partners will increase the capacity for producing ethanolamines and other chemicals.
9. What pricing options are available for accessing the report?
Pricing options include single-user, multi-user, and enterprise licenses priced at USD 4750, USD 5250, and USD 8750 respectively.
10. Is the market size provided in terms of value or volume?
The market size is provided in terms of value, measured in Million.
11. Are there any specific market keywords associated with the report?
Yes, the market keyword associated with the report is "Ethanolamines Industry," which aids in identifying and referencing the specific market segment covered.
12. How do I determine which pricing option suits my needs best?
The pricing options vary based on user requirements and access needs. Individual users may opt for single-user licenses, while businesses requiring broader access may choose multi-user or enterprise licenses for cost-effective access to the report.
13. Are there any additional resources or data provided in the Ethanolamines Industry report?
While the report offers comprehensive insights, it's advisable to review the specific contents or supplementary materials provided to ascertain if additional resources or data are available.
14. How can I stay updated on further developments or reports in the Ethanolamines Industry?
To stay informed about further developments, trends, and reports in the Ethanolamines Industry, consider subscribing to industry newsletters, following relevant companies and organizations, or regularly checking reputable industry news sources and publications.
Methodology
Step 1 - Identification of Relevant Samples Size from Population Database


Step 2 - Approaches for Defining Global Market Size (Value, Volume* & Price*)

Note*: In applicable scenarios
Step 3 - Data Sources
Primary Research
- Web Analytics
- Survey Reports
- Research Institute
- Latest Research Reports
- Opinion Leaders
Secondary Research
- Annual Reports
- White Paper
- Latest Press Release
- Industry Association
- Paid Database
- Investor Presentations

Step 4 - Data Triangulation
Involves using different sources of information in order to increase the validity of a study
These sources are likely to be stakeholders in a program - participants, other researchers, program staff, other community members, and so on.
Then we put all data in single framework & apply various statistical tools to find out the dynamic on the market.
During the analysis stage, feedback from the stakeholder groups would be compared to determine areas of agreement as well as areas of divergence
