

Key Insights
The global electronics and electrical ceramics market is experiencing robust growth, driven by the increasing demand for advanced electronic devices and the expansion of power grids globally. The market's compound annual growth rate (CAGR) exceeding 5% signifies a substantial and consistent expansion. Key drivers include the miniaturization of electronic components, the rising adoption of electric vehicles, and the growing need for energy-efficient solutions in various industries. Technological advancements in materials science, leading to improved performance and durability of ceramic components, further fuel market growth. Segment-wise, monolithic ceramics dominate the product type segment due to their widespread use in various applications. Within the end-user industry, consumer appliances and power grids represent significant market segments, fueled by the rising demand for smart home devices and renewable energy infrastructure. Alumina ceramics maintain a leading position in the material type segment due to their excellent electrical insulation properties and cost-effectiveness. However, the market also faces challenges, including the high cost of certain specialized ceramic materials and the potential for supply chain disruptions. Despite these restraints, the long-term outlook for the electronics and electrical ceramics market remains positive, with significant growth potential across various regions, particularly in Asia Pacific, driven by robust economic growth and increasing industrialization in countries like China and India. Major players in the market, including Heraeus Holding, Saint-Gobain, and NGK Insulators, are continuously investing in research and development to innovate and meet the evolving demands of the industry. Competitive landscape is characterized by both established players and emerging companies focusing on specific niche applications and technological advancements.
The forecast period (2025-2033) anticipates continued market expansion, fueled by ongoing technological advancements and rising demand across diverse sectors. The market is expected to benefit significantly from trends such as the Internet of Things (IoT), 5G deployment, and the growth of the renewable energy sector. These factors are projected to significantly increase the demand for high-performance and specialized ceramic materials. The strategic partnerships and mergers and acquisitions observed among market players further indicate the industry’s dynamic nature and the desire to capitalize on market opportunities. Further research into sustainable and environmentally friendly ceramic manufacturing processes is likely to play a significant role in shaping the future of this growing market. While regional variations may exist depending on factors like economic conditions and government policies, the overall global growth trajectory remains promising, creating lucrative opportunities for existing and new market participants.

Electronics and Electrical Ceramics Market: A Comprehensive Report (2019-2033)
This in-depth report provides a comprehensive analysis of the Electronics and Electrical Ceramics Market, offering invaluable insights for industry stakeholders, investors, and strategic decision-makers. Covering the period 2019-2033, with a focus on 2025, this study unveils market dynamics, trends, leading players, and future opportunities within this rapidly evolving sector. The report leverages extensive data analysis and expert insights to provide actionable intelligence for informed business strategies.
Electronics and Electrical Ceramics Market Market Dynamics & Concentration
The Electronics and Electrical Ceramics market is characterized by a moderately concentrated landscape, with key players holding significant market share. However, the market exhibits dynamic competition driven by continuous innovation in material science, manufacturing processes, and application development. The regulatory framework, varying across regions, impacts material specifications and production standards, influencing both market growth and competitive dynamics. The market is witnessing increasing M&A activity, as larger players seek to consolidate their positions and expand their product portfolios. Substitution by newer materials, particularly in niche applications, presents a challenge, though the inherent advantages of ceramics in terms of high-temperature stability and dielectric properties often maintain market dominance. End-user trends, primarily driven by the electronics and automotive industries, are shaping demand for specialized ceramics with enhanced performance characteristics.
- Market Concentration: The top 5 players account for approximately xx% of the global market share in 2025.
- M&A Activity: An estimated xx M&A deals were recorded between 2019 and 2024.
- Innovation Drivers: Advancements in nanotechnology, 3D printing, and material processing are key drivers of innovation.
- Regulatory Impacts: Stringent environmental regulations are influencing the adoption of eco-friendly ceramic manufacturing processes.
Electronics and Electrical Ceramics Market Industry Trends & Analysis
The Electronics and Electrical Ceramics market is experiencing robust growth, driven by the increasing demand for high-performance electronics and advanced technologies. Technological disruptions, particularly in areas like 5G infrastructure, electric vehicles, and medical devices, are significantly impacting market dynamics. Consumer preferences for smaller, faster, and more energy-efficient devices are fueling demand for miniaturized and high-performance ceramic components. Competitive dynamics are shaped by factors like pricing strategies, product differentiation, and technological advancements. The market is witnessing a CAGR of xx% during the forecast period (2025-2033), with a significant market penetration of xx% projected by 2033 in key application segments.

Leading Markets & Segments in Electronics and Electrical Ceramics Market
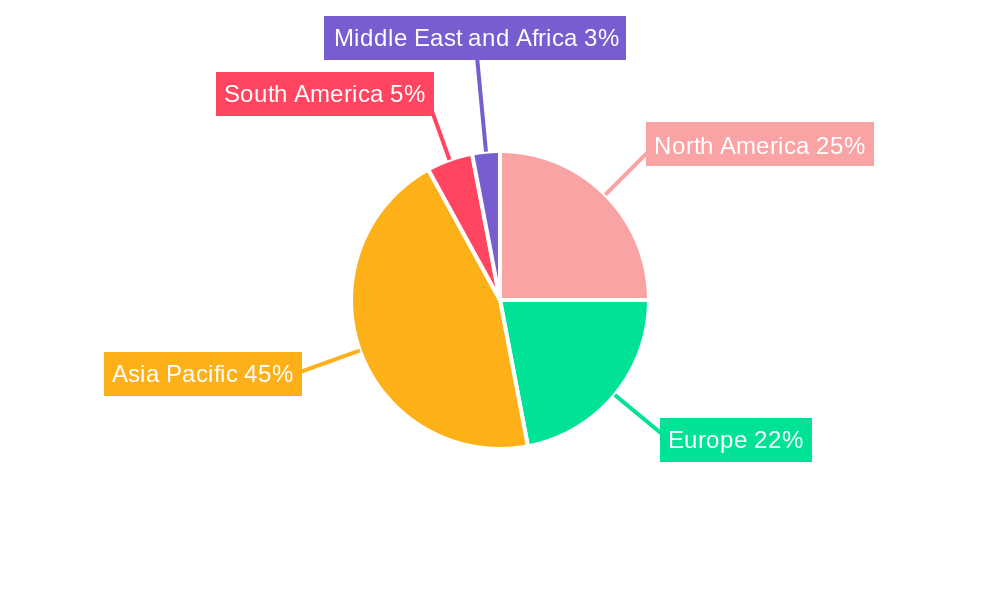
The Asia-Pacific region, particularly China and Japan, dominates the Electronics and Electrical Ceramics market, driven by robust growth in electronics manufacturing and expanding infrastructure. Within product types, Monolithic Ceramics hold the largest market share, followed by Ceramic Coatings. In terms of end-user industries, the Consumer Appliances segment is the leading consumer, with a significant contribution from Power Grids. Alumina Ceramics represents the largest material type segment.
- Key Drivers in Asia-Pacific:
- Rapid economic growth and industrialization.
- Extensive investments in infrastructure development.
- Growing electronics manufacturing base.
- Dominant Segments: Monolithic Ceramics (market share xx%), Consumer Appliances (market share xx%), Alumina Ceramics (market share xx%).
Electronics and Electrical Ceramics Market Product Developments
Recent years have witnessed significant advancements in ceramic materials and processing techniques. Innovations focus on improving dielectric properties, thermal stability, and mechanical strength. These advancements enable the development of ceramics suitable for high-frequency applications, extreme temperature environments, and demanding mechanical conditions. New applications are constantly emerging, particularly in areas like energy storage, sensors, and medical implants, driven by the unique properties and functionalities of these advanced ceramics. Competitive advantages are derived from superior material performance, innovative manufacturing processes, and cost-effective production strategies.
Key Drivers of Electronics and Electrical Ceramics Market Growth
Several factors are driving the growth of the Electronics and Electrical Ceramics market. Technological advancements in miniaturization and performance enhancement are key drivers, along with the growing demand for advanced electronics across various sectors. Economic expansion in developing countries is boosting investments in infrastructure and manufacturing facilities which, in turn, fuels the demand for specialized ceramics. Favorable regulatory frameworks in several regions are also stimulating market growth by promoting innovation and investment.
Challenges in the Electronics and Electrical Ceramics Market Market
The Electronics and Electrical Ceramics market faces certain challenges. Stringent environmental regulations necessitate the adoption of eco-friendly manufacturing processes, increasing production costs. Supply chain disruptions due to geopolitical factors and resource constraints can impact production timelines and availability. Intense competition among established players and the emergence of new entrants present pressure on pricing and profitability. These factors combined can potentially reduce the overall market growth rate by an estimated xx% by 2033.
Emerging Opportunities in Electronics and Electrical Ceramics Market
Significant opportunities exist for growth within the Electronics and Electrical Ceramics market. Technological breakthroughs in materials science are paving the way for next-generation ceramic components with enhanced performance. Strategic partnerships between manufacturers and technology developers are enabling the development of innovative applications. Market expansion strategies focused on emerging economies, particularly in Africa and Latin America, present significant potential for market growth. Furthermore, the increasing integration of ceramics in emerging fields such as renewable energy and aerospace technologies is likely to stimulate market growth.
Leading Players in the Electronics and Electrical Ceramics Market Sector
- Heraeus Holding
- Saint-Gobain
- NORITAKE CO LIMITED
- Aum Techno Ceramics
- AdValueTech
- NGK INSULATORS LTD
- KCM Corporation Co Ltd
- IBIDEN
- CoorsTek Inc
- NIPPON CARBIDE INDUSTRIES CO INC
- CeramTec
- TAYCA*List Not Exhaustive
- MARUWA Co Ltd
- Murata Manufacturing Co Ltd
- Kyocera Group
Key Milestones in Electronics and Electrical Ceramics Market Industry
- 2020: Introduction of a new high-temperature alumina ceramic by CoorsTek Inc.
- 2021: Merger between two leading ceramic manufacturers resulting in increased market share.
- 2022: Launch of a novel zirconia-based ceramic coating by Saint-Gobain.
- 2023: Significant investment in R&D by Heraeus Holding for next-generation ceramic materials.
- 2024: Successful commercialization of a 3D-printed ceramic component by a leading player.
Strategic Outlook for Electronics and Electrical Ceramics Market Market
The Electronics and Electrical Ceramics market holds significant future potential, driven by continuous technological innovation and expanding applications across diverse sectors. Strategic opportunities exist for companies to invest in R&D, develop advanced materials, and expand into new markets. Collaborations and strategic partnerships are crucial for accessing new technologies and expanding market reach. Focusing on sustainability and eco-friendly manufacturing processes will be crucial for long-term success in this sector. The market is poised for continued growth, with the potential for significant expansion driven by the trends outlined above.
Electronics and Electrical Ceramics Market Segmentation
-
1. Material Type
- 1.1. Alumina Ceramics
- 1.2. Titanate Ceramics
- 1.3. Zirconia Ceramics
- 1.4. Silica Ceramics
- 1.5. Others
-
2. Product Type
- 2.1. Monolithic Ceramics
- 2.2. Ceramic Matrix Composites
- 2.3. Ceramic Coatings
- 2.4. Others
-
3. End-user Industry
- 3.1. Consumer Appliances
- 3.2. Power Grids
- 3.3. Medical Devices
- 3.4. Others
Electronics and Electrical Ceramics Market Segmentation By Geography
-
1. Asia Pacific
- 1.1. China
- 1.2. India
- 1.3. Japan
- 1.4. South Korea
- 1.5. Rest of Asia Pacific
-
2. North America
- 2.1. United States
- 2.2. Canada
- 2.3. Mexico
-
3. Europe
- 3.1. Germany
- 3.2. United Kingdom
- 3.3. France
- 3.4. Italy
- 3.5. Rest of Europe
-
4. South America
- 4.1. Brazil
- 4.2. Argentina
- 4.3. Rest of South America
-
5. Middle East and Africa
- 5.1. Saudi Arabia
- 5.2. South Africa
- 5.3. Rest of Middle East and Africa
Electronics and Electrical Ceramics Market REPORT HIGHLIGHTS
| Aspects | Details |
|---|---|
| Study Period | 2019-2033 |
| Base Year | 2024 |
| Estimated Year | 2025 |
| Forecast Period | 2025-2033 |
| Historical Period | 2019-2024 |
| Growth Rate | CAGR of > 5.00% from 2019-2033 |
| Segmentation |
|
Table of Contents
- 1. Introduction
- 1.1. Research Scope
- 1.2. Market Segmentation
- 1.3. Research Methodology
- 1.4. Definitions and Assumptions
- 2. Executive Summary
- 2.1. Introduction
- 3. Market Dynamics
- 3.1. Introduction
- 3.2. Market Drivers
- 3.2.1. ; Increase Demand for Consumer Electronics; Upcoming Power Generation Projects in Asia-Pacific
- 3.3. Market Restrains
- 3.3.1. ; Higher Cost Compared to Other Materials like Metals and Alloys; Unfavorable Conditions Arising Due to COVID-19 Outbreak
- 3.4. Market Trends
- 3.4.1. Consumer Appliances Application to Dominate the Market
- 4. Market Factor Analysis
- 4.1. Porters Five Forces
- 4.2. Supply/Value Chain
- 4.3. PESTEL analysis
- 4.4. Market Entropy
- 4.5. Patent/Trademark Analysis
- 5. Global Electronics and Electrical Ceramics Market Analysis, Insights and Forecast, 2019-2031
- 5.1. Market Analysis, Insights and Forecast - by Material Type
- 5.1.1. Alumina Ceramics
- 5.1.2. Titanate Ceramics
- 5.1.3. Zirconia Ceramics
- 5.1.4. Silica Ceramics
- 5.1.5. Others
- 5.2. Market Analysis, Insights and Forecast - by Product Type
- 5.2.1. Monolithic Ceramics
- 5.2.2. Ceramic Matrix Composites
- 5.2.3. Ceramic Coatings
- 5.2.4. Others
- 5.3. Market Analysis, Insights and Forecast - by End-user Industry
- 5.3.1. Consumer Appliances
- 5.3.2. Power Grids
- 5.3.3. Medical Devices
- 5.3.4. Others
- 5.4. Market Analysis, Insights and Forecast - by Region
- 5.4.1. Asia Pacific
- 5.4.2. North America
- 5.4.3. Europe
- 5.4.4. South America
- 5.4.5. Middle East and Africa
- 5.1. Market Analysis, Insights and Forecast - by Material Type
- 6. Asia Pacific Electronics and Electrical Ceramics Market Analysis, Insights and Forecast, 2019-2031
- 6.1. Market Analysis, Insights and Forecast - by Material Type
- 6.1.1. Alumina Ceramics
- 6.1.2. Titanate Ceramics
- 6.1.3. Zirconia Ceramics
- 6.1.4. Silica Ceramics
- 6.1.5. Others
- 6.2. Market Analysis, Insights and Forecast - by Product Type
- 6.2.1. Monolithic Ceramics
- 6.2.2. Ceramic Matrix Composites
- 6.2.3. Ceramic Coatings
- 6.2.4. Others
- 6.3. Market Analysis, Insights and Forecast - by End-user Industry
- 6.3.1. Consumer Appliances
- 6.3.2. Power Grids
- 6.3.3. Medical Devices
- 6.3.4. Others
- 6.1. Market Analysis, Insights and Forecast - by Material Type
- 7. North America Electronics and Electrical Ceramics Market Analysis, Insights and Forecast, 2019-2031
- 7.1. Market Analysis, Insights and Forecast - by Material Type
- 7.1.1. Alumina Ceramics
- 7.1.2. Titanate Ceramics
- 7.1.3. Zirconia Ceramics
- 7.1.4. Silica Ceramics
- 7.1.5. Others
- 7.2. Market Analysis, Insights and Forecast - by Product Type
- 7.2.1. Monolithic Ceramics
- 7.2.2. Ceramic Matrix Composites
- 7.2.3. Ceramic Coatings
- 7.2.4. Others
- 7.3. Market Analysis, Insights and Forecast - by End-user Industry
- 7.3.1. Consumer Appliances
- 7.3.2. Power Grids
- 7.3.3. Medical Devices
- 7.3.4. Others
- 7.1. Market Analysis, Insights and Forecast - by Material Type
- 8. Europe Electronics and Electrical Ceramics Market Analysis, Insights and Forecast, 2019-2031
- 8.1. Market Analysis, Insights and Forecast - by Material Type
- 8.1.1. Alumina Ceramics
- 8.1.2. Titanate Ceramics
- 8.1.3. Zirconia Ceramics
- 8.1.4. Silica Ceramics
- 8.1.5. Others
- 8.2. Market Analysis, Insights and Forecast - by Product Type
- 8.2.1. Monolithic Ceramics
- 8.2.2. Ceramic Matrix Composites
- 8.2.3. Ceramic Coatings
- 8.2.4. Others
- 8.3. Market Analysis, Insights and Forecast - by End-user Industry
- 8.3.1. Consumer Appliances
- 8.3.2. Power Grids
- 8.3.3. Medical Devices
- 8.3.4. Others
- 8.1. Market Analysis, Insights and Forecast - by Material Type
- 9. South America Electronics and Electrical Ceramics Market Analysis, Insights and Forecast, 2019-2031
- 9.1. Market Analysis, Insights and Forecast - by Material Type
- 9.1.1. Alumina Ceramics
- 9.1.2. Titanate Ceramics
- 9.1.3. Zirconia Ceramics
- 9.1.4. Silica Ceramics
- 9.1.5. Others
- 9.2. Market Analysis, Insights and Forecast - by Product Type
- 9.2.1. Monolithic Ceramics
- 9.2.2. Ceramic Matrix Composites
- 9.2.3. Ceramic Coatings
- 9.2.4. Others
- 9.3. Market Analysis, Insights and Forecast - by End-user Industry
- 9.3.1. Consumer Appliances
- 9.3.2. Power Grids
- 9.3.3. Medical Devices
- 9.3.4. Others
- 9.1. Market Analysis, Insights and Forecast - by Material Type
- 10. Middle East and Africa Electronics and Electrical Ceramics Market Analysis, Insights and Forecast, 2019-2031
- 10.1. Market Analysis, Insights and Forecast - by Material Type
- 10.1.1. Alumina Ceramics
- 10.1.2. Titanate Ceramics
- 10.1.3. Zirconia Ceramics
- 10.1.4. Silica Ceramics
- 10.1.5. Others
- 10.2. Market Analysis, Insights and Forecast - by Product Type
- 10.2.1. Monolithic Ceramics
- 10.2.2. Ceramic Matrix Composites
- 10.2.3. Ceramic Coatings
- 10.2.4. Others
- 10.3. Market Analysis, Insights and Forecast - by End-user Industry
- 10.3.1. Consumer Appliances
- 10.3.2. Power Grids
- 10.3.3. Medical Devices
- 10.3.4. Others
- 10.1. Market Analysis, Insights and Forecast - by Material Type
- 11. Asia Pacific Electronics and Electrical Ceramics Market Analysis, Insights and Forecast, 2019-2031
- 11.1. Market Analysis, Insights and Forecast - By Country/Sub-region
- 11.1.1 China
- 11.1.2 India
- 11.1.3 Japan
- 11.1.4 South Korea
- 11.1.5 Rest of Asia Pacific
- 12. North America Electronics and Electrical Ceramics Market Analysis, Insights and Forecast, 2019-2031
- 12.1. Market Analysis, Insights and Forecast - By Country/Sub-region
- 12.1.1 United States
- 12.1.2 Canada
- 12.1.3 Mexico
- 13. Europe Electronics and Electrical Ceramics Market Analysis, Insights and Forecast, 2019-2031
- 13.1. Market Analysis, Insights and Forecast - By Country/Sub-region
- 13.1.1 Germany
- 13.1.2 United Kingdom
- 13.1.3 France
- 13.1.4 Italy
- 13.1.5 Rest of Europe
- 14. South America Electronics and Electrical Ceramics Market Analysis, Insights and Forecast, 2019-2031
- 14.1. Market Analysis, Insights and Forecast - By Country/Sub-region
- 14.1.1 Brazil
- 14.1.2 Argentina
- 14.1.3 Rest of South America
- 15. Middle East and Africa Electronics and Electrical Ceramics Market Analysis, Insights and Forecast, 2019-2031
- 15.1. Market Analysis, Insights and Forecast - By Country/Sub-region
- 15.1.1 Saudi Arabia
- 15.1.2 South Africa
- 15.1.3 Rest of Middle East and Africa
- 16. Competitive Analysis
- 16.1. Global Market Share Analysis 2024
- 16.2. Company Profiles
- 16.2.1 Heraeus Holding
- 16.2.1.1. Overview
- 16.2.1.2. Products
- 16.2.1.3. SWOT Analysis
- 16.2.1.4. Recent Developments
- 16.2.1.5. Financials (Based on Availability)
- 16.2.2 Saint-Gobain
- 16.2.2.1. Overview
- 16.2.2.2. Products
- 16.2.2.3. SWOT Analysis
- 16.2.2.4. Recent Developments
- 16.2.2.5. Financials (Based on Availability)
- 16.2.3 NORITAKE CO LIMITED
- 16.2.3.1. Overview
- 16.2.3.2. Products
- 16.2.3.3. SWOT Analysis
- 16.2.3.4. Recent Developments
- 16.2.3.5. Financials (Based on Availability)
- 16.2.4 Aum Techno Ceramics
- 16.2.4.1. Overview
- 16.2.4.2. Products
- 16.2.4.3. SWOT Analysis
- 16.2.4.4. Recent Developments
- 16.2.4.5. Financials (Based on Availability)
- 16.2.5 AdValueTech
- 16.2.5.1. Overview
- 16.2.5.2. Products
- 16.2.5.3. SWOT Analysis
- 16.2.5.4. Recent Developments
- 16.2.5.5. Financials (Based on Availability)
- 16.2.6 NGK INSULATORS LTD
- 16.2.6.1. Overview
- 16.2.6.2. Products
- 16.2.6.3. SWOT Analysis
- 16.2.6.4. Recent Developments
- 16.2.6.5. Financials (Based on Availability)
- 16.2.7 KCM Corporation Co Ltd
- 16.2.7.1. Overview
- 16.2.7.2. Products
- 16.2.7.3. SWOT Analysis
- 16.2.7.4. Recent Developments
- 16.2.7.5. Financials (Based on Availability)
- 16.2.8 IBIDEN
- 16.2.8.1. Overview
- 16.2.8.2. Products
- 16.2.8.3. SWOT Analysis
- 16.2.8.4. Recent Developments
- 16.2.8.5. Financials (Based on Availability)
- 16.2.9 CoorsTek Inc
- 16.2.9.1. Overview
- 16.2.9.2. Products
- 16.2.9.3. SWOT Analysis
- 16.2.9.4. Recent Developments
- 16.2.9.5. Financials (Based on Availability)
- 16.2.10 NIPPON CARBIDE INDUSTRIES CO INC
- 16.2.10.1. Overview
- 16.2.10.2. Products
- 16.2.10.3. SWOT Analysis
- 16.2.10.4. Recent Developments
- 16.2.10.5. Financials (Based on Availability)
- 16.2.11 CeramTec
- 16.2.11.1. Overview
- 16.2.11.2. Products
- 16.2.11.3. SWOT Analysis
- 16.2.11.4. Recent Developments
- 16.2.11.5. Financials (Based on Availability)
- 16.2.12 TAYCA*List Not Exhaustive
- 16.2.12.1. Overview
- 16.2.12.2. Products
- 16.2.12.3. SWOT Analysis
- 16.2.12.4. Recent Developments
- 16.2.12.5. Financials (Based on Availability)
- 16.2.13 MARUWA Co Ltd
- 16.2.13.1. Overview
- 16.2.13.2. Products
- 16.2.13.3. SWOT Analysis
- 16.2.13.4. Recent Developments
- 16.2.13.5. Financials (Based on Availability)
- 16.2.14 Murata Manufacturing Co Ltd
- 16.2.14.1. Overview
- 16.2.14.2. Products
- 16.2.14.3. SWOT Analysis
- 16.2.14.4. Recent Developments
- 16.2.14.5. Financials (Based on Availability)
- 16.2.15 Kyocera Group
- 16.2.15.1. Overview
- 16.2.15.2. Products
- 16.2.15.3. SWOT Analysis
- 16.2.15.4. Recent Developments
- 16.2.15.5. Financials (Based on Availability)
- 16.2.1 Heraeus Holding
List of Figures
- Figure 1: Global Electronics and Electrical Ceramics Market Revenue Breakdown (Million, %) by Region 2024 & 2032
- Figure 2: Asia Pacific Electronics and Electrical Ceramics Market Revenue (Million), by Country 2024 & 2032
- Figure 3: Asia Pacific Electronics and Electrical Ceramics Market Revenue Share (%), by Country 2024 & 2032
- Figure 4: North America Electronics and Electrical Ceramics Market Revenue (Million), by Country 2024 & 2032
- Figure 5: North America Electronics and Electrical Ceramics Market Revenue Share (%), by Country 2024 & 2032
- Figure 6: Europe Electronics and Electrical Ceramics Market Revenue (Million), by Country 2024 & 2032
- Figure 7: Europe Electronics and Electrical Ceramics Market Revenue Share (%), by Country 2024 & 2032
- Figure 8: South America Electronics and Electrical Ceramics Market Revenue (Million), by Country 2024 & 2032
- Figure 9: South America Electronics and Electrical Ceramics Market Revenue Share (%), by Country 2024 & 2032
- Figure 10: Middle East and Africa Electronics and Electrical Ceramics Market Revenue (Million), by Country 2024 & 2032
- Figure 11: Middle East and Africa Electronics and Electrical Ceramics Market Revenue Share (%), by Country 2024 & 2032
- Figure 12: Asia Pacific Electronics and Electrical Ceramics Market Revenue (Million), by Material Type 2024 & 2032
- Figure 13: Asia Pacific Electronics and Electrical Ceramics Market Revenue Share (%), by Material Type 2024 & 2032
- Figure 14: Asia Pacific Electronics and Electrical Ceramics Market Revenue (Million), by Product Type 2024 & 2032
- Figure 15: Asia Pacific Electronics and Electrical Ceramics Market Revenue Share (%), by Product Type 2024 & 2032
- Figure 16: Asia Pacific Electronics and Electrical Ceramics Market Revenue (Million), by End-user Industry 2024 & 2032
- Figure 17: Asia Pacific Electronics and Electrical Ceramics Market Revenue Share (%), by End-user Industry 2024 & 2032
- Figure 18: Asia Pacific Electronics and Electrical Ceramics Market Revenue (Million), by Country 2024 & 2032
- Figure 19: Asia Pacific Electronics and Electrical Ceramics Market Revenue Share (%), by Country 2024 & 2032
- Figure 20: North America Electronics and Electrical Ceramics Market Revenue (Million), by Material Type 2024 & 2032
- Figure 21: North America Electronics and Electrical Ceramics Market Revenue Share (%), by Material Type 2024 & 2032
- Figure 22: North America Electronics and Electrical Ceramics Market Revenue (Million), by Product Type 2024 & 2032
- Figure 23: North America Electronics and Electrical Ceramics Market Revenue Share (%), by Product Type 2024 & 2032
- Figure 24: North America Electronics and Electrical Ceramics Market Revenue (Million), by End-user Industry 2024 & 2032
- Figure 25: North America Electronics and Electrical Ceramics Market Revenue Share (%), by End-user Industry 2024 & 2032
- Figure 26: North America Electronics and Electrical Ceramics Market Revenue (Million), by Country 2024 & 2032
- Figure 27: North America Electronics and Electrical Ceramics Market Revenue Share (%), by Country 2024 & 2032
- Figure 28: Europe Electronics and Electrical Ceramics Market Revenue (Million), by Material Type 2024 & 2032
- Figure 29: Europe Electronics and Electrical Ceramics Market Revenue Share (%), by Material Type 2024 & 2032
- Figure 30: Europe Electronics and Electrical Ceramics Market Revenue (Million), by Product Type 2024 & 2032
- Figure 31: Europe Electronics and Electrical Ceramics Market Revenue Share (%), by Product Type 2024 & 2032
- Figure 32: Europe Electronics and Electrical Ceramics Market Revenue (Million), by End-user Industry 2024 & 2032
- Figure 33: Europe Electronics and Electrical Ceramics Market Revenue Share (%), by End-user Industry 2024 & 2032
- Figure 34: Europe Electronics and Electrical Ceramics Market Revenue (Million), by Country 2024 & 2032
- Figure 35: Europe Electronics and Electrical Ceramics Market Revenue Share (%), by Country 2024 & 2032
- Figure 36: South America Electronics and Electrical Ceramics Market Revenue (Million), by Material Type 2024 & 2032
- Figure 37: South America Electronics and Electrical Ceramics Market Revenue Share (%), by Material Type 2024 & 2032
- Figure 38: South America Electronics and Electrical Ceramics Market Revenue (Million), by Product Type 2024 & 2032
- Figure 39: South America Electronics and Electrical Ceramics Market Revenue Share (%), by Product Type 2024 & 2032
- Figure 40: South America Electronics and Electrical Ceramics Market Revenue (Million), by End-user Industry 2024 & 2032
- Figure 41: South America Electronics and Electrical Ceramics Market Revenue Share (%), by End-user Industry 2024 & 2032
- Figure 42: South America Electronics and Electrical Ceramics Market Revenue (Million), by Country 2024 & 2032
- Figure 43: South America Electronics and Electrical Ceramics Market Revenue Share (%), by Country 2024 & 2032
- Figure 44: Middle East and Africa Electronics and Electrical Ceramics Market Revenue (Million), by Material Type 2024 & 2032
- Figure 45: Middle East and Africa Electronics and Electrical Ceramics Market Revenue Share (%), by Material Type 2024 & 2032
- Figure 46: Middle East and Africa Electronics and Electrical Ceramics Market Revenue (Million), by Product Type 2024 & 2032
- Figure 47: Middle East and Africa Electronics and Electrical Ceramics Market Revenue Share (%), by Product Type 2024 & 2032
- Figure 48: Middle East and Africa Electronics and Electrical Ceramics Market Revenue (Million), by End-user Industry 2024 & 2032
- Figure 49: Middle East and Africa Electronics and Electrical Ceramics Market Revenue Share (%), by End-user Industry 2024 & 2032
- Figure 50: Middle East and Africa Electronics and Electrical Ceramics Market Revenue (Million), by Country 2024 & 2032
- Figure 51: Middle East and Africa Electronics and Electrical Ceramics Market Revenue Share (%), by Country 2024 & 2032
List of Tables
- Table 1: Global Electronics and Electrical Ceramics Market Revenue Million Forecast, by Region 2019 & 2032
- Table 2: Global Electronics and Electrical Ceramics Market Revenue Million Forecast, by Material Type 2019 & 2032
- Table 3: Global Electronics and Electrical Ceramics Market Revenue Million Forecast, by Product Type 2019 & 2032
- Table 4: Global Electronics and Electrical Ceramics Market Revenue Million Forecast, by End-user Industry 2019 & 2032
- Table 5: Global Electronics and Electrical Ceramics Market Revenue Million Forecast, by Region 2019 & 2032
- Table 6: Global Electronics and Electrical Ceramics Market Revenue Million Forecast, by Country 2019 & 2032
- Table 7: China Electronics and Electrical Ceramics Market Revenue (Million) Forecast, by Application 2019 & 2032
- Table 8: India Electronics and Electrical Ceramics Market Revenue (Million) Forecast, by Application 2019 & 2032
- Table 9: Japan Electronics and Electrical Ceramics Market Revenue (Million) Forecast, by Application 2019 & 2032
- Table 10: South Korea Electronics and Electrical Ceramics Market Revenue (Million) Forecast, by Application 2019 & 2032
- Table 11: Rest of Asia Pacific Electronics and Electrical Ceramics Market Revenue (Million) Forecast, by Application 2019 & 2032
- Table 12: Global Electronics and Electrical Ceramics Market Revenue Million Forecast, by Country 2019 & 2032
- Table 13: United States Electronics and Electrical Ceramics Market Revenue (Million) Forecast, by Application 2019 & 2032
- Table 14: Canada Electronics and Electrical Ceramics Market Revenue (Million) Forecast, by Application 2019 & 2032
- Table 15: Mexico Electronics and Electrical Ceramics Market Revenue (Million) Forecast, by Application 2019 & 2032
- Table 16: Global Electronics and Electrical Ceramics Market Revenue Million Forecast, by Country 2019 & 2032
- Table 17: Germany Electronics and Electrical Ceramics Market Revenue (Million) Forecast, by Application 2019 & 2032
- Table 18: United Kingdom Electronics and Electrical Ceramics Market Revenue (Million) Forecast, by Application 2019 & 2032
- Table 19: France Electronics and Electrical Ceramics Market Revenue (Million) Forecast, by Application 2019 & 2032
- Table 20: Italy Electronics and Electrical Ceramics Market Revenue (Million) Forecast, by Application 2019 & 2032
- Table 21: Rest of Europe Electronics and Electrical Ceramics Market Revenue (Million) Forecast, by Application 2019 & 2032
- Table 22: Global Electronics and Electrical Ceramics Market Revenue Million Forecast, by Country 2019 & 2032
- Table 23: Brazil Electronics and Electrical Ceramics Market Revenue (Million) Forecast, by Application 2019 & 2032
- Table 24: Argentina Electronics and Electrical Ceramics Market Revenue (Million) Forecast, by Application 2019 & 2032
- Table 25: Rest of South America Electronics and Electrical Ceramics Market Revenue (Million) Forecast, by Application 2019 & 2032
- Table 26: Global Electronics and Electrical Ceramics Market Revenue Million Forecast, by Country 2019 & 2032
- Table 27: Saudi Arabia Electronics and Electrical Ceramics Market Revenue (Million) Forecast, by Application 2019 & 2032
- Table 28: South Africa Electronics and Electrical Ceramics Market Revenue (Million) Forecast, by Application 2019 & 2032
- Table 29: Rest of Middle East and Africa Electronics and Electrical Ceramics Market Revenue (Million) Forecast, by Application 2019 & 2032
- Table 30: Global Electronics and Electrical Ceramics Market Revenue Million Forecast, by Material Type 2019 & 2032
- Table 31: Global Electronics and Electrical Ceramics Market Revenue Million Forecast, by Product Type 2019 & 2032
- Table 32: Global Electronics and Electrical Ceramics Market Revenue Million Forecast, by End-user Industry 2019 & 2032
- Table 33: Global Electronics and Electrical Ceramics Market Revenue Million Forecast, by Country 2019 & 2032
- Table 34: China Electronics and Electrical Ceramics Market Revenue (Million) Forecast, by Application 2019 & 2032
- Table 35: India Electronics and Electrical Ceramics Market Revenue (Million) Forecast, by Application 2019 & 2032
- Table 36: Japan Electronics and Electrical Ceramics Market Revenue (Million) Forecast, by Application 2019 & 2032
- Table 37: South Korea Electronics and Electrical Ceramics Market Revenue (Million) Forecast, by Application 2019 & 2032
- Table 38: Rest of Asia Pacific Electronics and Electrical Ceramics Market Revenue (Million) Forecast, by Application 2019 & 2032
- Table 39: Global Electronics and Electrical Ceramics Market Revenue Million Forecast, by Material Type 2019 & 2032
- Table 40: Global Electronics and Electrical Ceramics Market Revenue Million Forecast, by Product Type 2019 & 2032
- Table 41: Global Electronics and Electrical Ceramics Market Revenue Million Forecast, by End-user Industry 2019 & 2032
- Table 42: Global Electronics and Electrical Ceramics Market Revenue Million Forecast, by Country 2019 & 2032
- Table 43: United States Electronics and Electrical Ceramics Market Revenue (Million) Forecast, by Application 2019 & 2032
- Table 44: Canada Electronics and Electrical Ceramics Market Revenue (Million) Forecast, by Application 2019 & 2032
- Table 45: Mexico Electronics and Electrical Ceramics Market Revenue (Million) Forecast, by Application 2019 & 2032
- Table 46: Global Electronics and Electrical Ceramics Market Revenue Million Forecast, by Material Type 2019 & 2032
- Table 47: Global Electronics and Electrical Ceramics Market Revenue Million Forecast, by Product Type 2019 & 2032
- Table 48: Global Electronics and Electrical Ceramics Market Revenue Million Forecast, by End-user Industry 2019 & 2032
- Table 49: Global Electronics and Electrical Ceramics Market Revenue Million Forecast, by Country 2019 & 2032
- Table 50: Germany Electronics and Electrical Ceramics Market Revenue (Million) Forecast, by Application 2019 & 2032
- Table 51: United Kingdom Electronics and Electrical Ceramics Market Revenue (Million) Forecast, by Application 2019 & 2032
- Table 52: France Electronics and Electrical Ceramics Market Revenue (Million) Forecast, by Application 2019 & 2032
- Table 53: Italy Electronics and Electrical Ceramics Market Revenue (Million) Forecast, by Application 2019 & 2032
- Table 54: Rest of Europe Electronics and Electrical Ceramics Market Revenue (Million) Forecast, by Application 2019 & 2032
- Table 55: Global Electronics and Electrical Ceramics Market Revenue Million Forecast, by Material Type 2019 & 2032
- Table 56: Global Electronics and Electrical Ceramics Market Revenue Million Forecast, by Product Type 2019 & 2032
- Table 57: Global Electronics and Electrical Ceramics Market Revenue Million Forecast, by End-user Industry 2019 & 2032
- Table 58: Global Electronics and Electrical Ceramics Market Revenue Million Forecast, by Country 2019 & 2032
- Table 59: Brazil Electronics and Electrical Ceramics Market Revenue (Million) Forecast, by Application 2019 & 2032
- Table 60: Argentina Electronics and Electrical Ceramics Market Revenue (Million) Forecast, by Application 2019 & 2032
- Table 61: Rest of South America Electronics and Electrical Ceramics Market Revenue (Million) Forecast, by Application 2019 & 2032
- Table 62: Global Electronics and Electrical Ceramics Market Revenue Million Forecast, by Material Type 2019 & 2032
- Table 63: Global Electronics and Electrical Ceramics Market Revenue Million Forecast, by Product Type 2019 & 2032
- Table 64: Global Electronics and Electrical Ceramics Market Revenue Million Forecast, by End-user Industry 2019 & 2032
- Table 65: Global Electronics and Electrical Ceramics Market Revenue Million Forecast, by Country 2019 & 2032
- Table 66: Saudi Arabia Electronics and Electrical Ceramics Market Revenue (Million) Forecast, by Application 2019 & 2032
- Table 67: South Africa Electronics and Electrical Ceramics Market Revenue (Million) Forecast, by Application 2019 & 2032
- Table 68: Rest of Middle East and Africa Electronics and Electrical Ceramics Market Revenue (Million) Forecast, by Application 2019 & 2032
Frequently Asked Questions
1. What is the projected Compound Annual Growth Rate (CAGR) of the Electronics and Electrical Ceramics Market?
The projected CAGR is approximately > 5.00%.
2. Which companies are prominent players in the Electronics and Electrical Ceramics Market?
Key companies in the market include Heraeus Holding, Saint-Gobain, NORITAKE CO LIMITED, Aum Techno Ceramics, AdValueTech, NGK INSULATORS LTD, KCM Corporation Co Ltd, IBIDEN, CoorsTek Inc, NIPPON CARBIDE INDUSTRIES CO INC, CeramTec, TAYCA*List Not Exhaustive, MARUWA Co Ltd, Murata Manufacturing Co Ltd, Kyocera Group.
3. What are the main segments of the Electronics and Electrical Ceramics Market?
The market segments include Material Type, Product Type, End-user Industry.
4. Can you provide details about the market size?
The market size is estimated to be USD XX Million as of 2022.
5. What are some drivers contributing to market growth?
; Increase Demand for Consumer Electronics; Upcoming Power Generation Projects in Asia-Pacific.
6. What are the notable trends driving market growth?
Consumer Appliances Application to Dominate the Market.
7. Are there any restraints impacting market growth?
; Higher Cost Compared to Other Materials like Metals and Alloys; Unfavorable Conditions Arising Due to COVID-19 Outbreak.
8. Can you provide examples of recent developments in the market?
N/A
9. What pricing options are available for accessing the report?
Pricing options include single-user, multi-user, and enterprise licenses priced at USD 4750, USD 5250, and USD 8750 respectively.
10. Is the market size provided in terms of value or volume?
The market size is provided in terms of value, measured in Million.
11. Are there any specific market keywords associated with the report?
Yes, the market keyword associated with the report is "Electronics and Electrical Ceramics Market," which aids in identifying and referencing the specific market segment covered.
12. How do I determine which pricing option suits my needs best?
The pricing options vary based on user requirements and access needs. Individual users may opt for single-user licenses, while businesses requiring broader access may choose multi-user or enterprise licenses for cost-effective access to the report.
13. Are there any additional resources or data provided in the Electronics and Electrical Ceramics Market report?
While the report offers comprehensive insights, it's advisable to review the specific contents or supplementary materials provided to ascertain if additional resources or data are available.
14. How can I stay updated on further developments or reports in the Electronics and Electrical Ceramics Market?
To stay informed about further developments, trends, and reports in the Electronics and Electrical Ceramics Market, consider subscribing to industry newsletters, following relevant companies and organizations, or regularly checking reputable industry news sources and publications.
Methodology
Step 1 - Identification of Relevant Samples Size from Population Database


Step 2 - Approaches for Defining Global Market Size (Value, Volume* & Price*)

Note*: In applicable scenarios
Step 3 - Data Sources
Primary Research
- Web Analytics
- Survey Reports
- Research Institute
- Latest Research Reports
- Opinion Leaders
Secondary Research
- Annual Reports
- White Paper
- Latest Press Release
- Industry Association
- Paid Database
- Investor Presentations

Step 4 - Data Triangulation
Involves using different sources of information in order to increase the validity of a study
These sources are likely to be stakeholders in a program - participants, other researchers, program staff, other community members, and so on.
Then we put all data in single framework & apply various statistical tools to find out the dynamic on the market.
During the analysis stage, feedback from the stakeholder groups would be compared to determine areas of agreement as well as areas of divergence
