

Key Insights
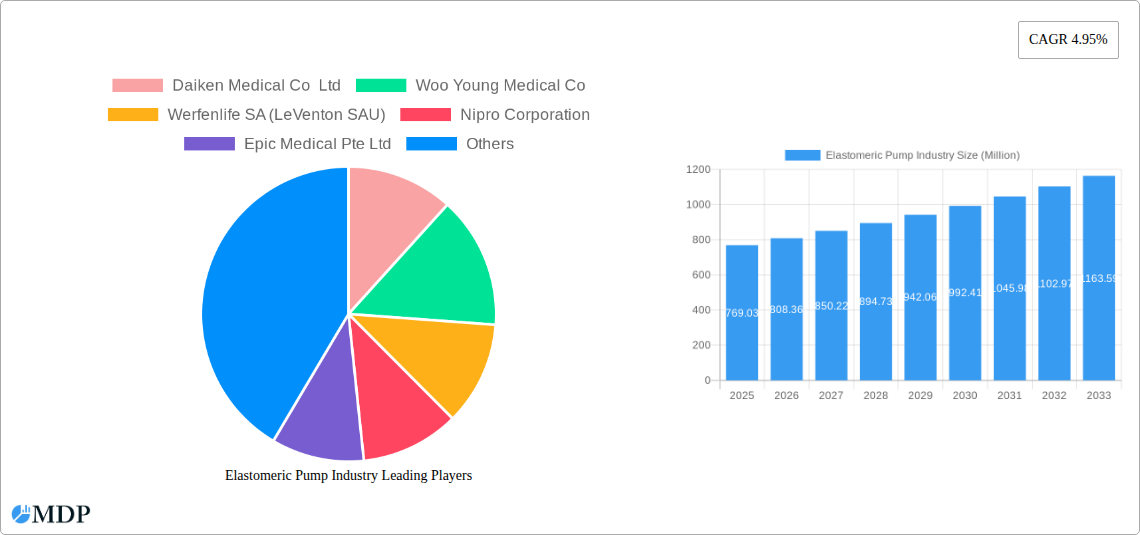
The elastomeric infusion pump market, valued at $769.03 million in 2025, is projected to experience robust growth, driven by a rising geriatric population requiring frequent drug administration, increasing prevalence of chronic diseases necessitating long-term infusion therapy, and a growing preference for ambulatory care settings. Hospitals and ambulatory surgical centers represent the largest end-user segments, fueled by the convenience and cost-effectiveness of elastomeric pumps compared to traditional infusion methods. Continuous rate elastomeric pumps currently dominate the product type segment, but variable rate pumps are witnessing significant growth owing to their enhanced flexibility and precision in drug delivery. Pain management remains the leading application area, but chemotherapy and chelation therapy applications are expanding steadily, further contributing to market expansion. Technological advancements leading to smaller, more user-friendly devices, along with the integration of smart features for improved monitoring and safety, are key market trends. However, potential restraints include the risk of device malfunction and associated complications, and the need for robust training and education for healthcare professionals in proper pump handling and patient management. Competitive landscape analysis indicates that major players like B. Braun Melsungen AG, Baxter International Inc., and Smiths Medical Inc. are focusing on product innovation and strategic partnerships to consolidate their market share. The Asia-Pacific region is expected to exhibit the fastest growth, driven by increasing healthcare infrastructure development and rising disposable incomes in emerging economies.
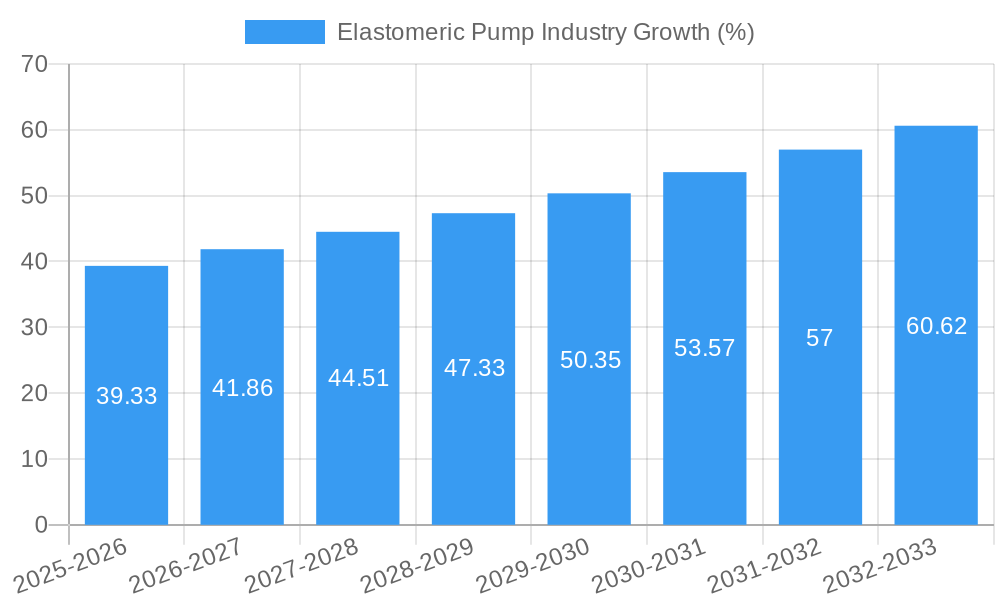
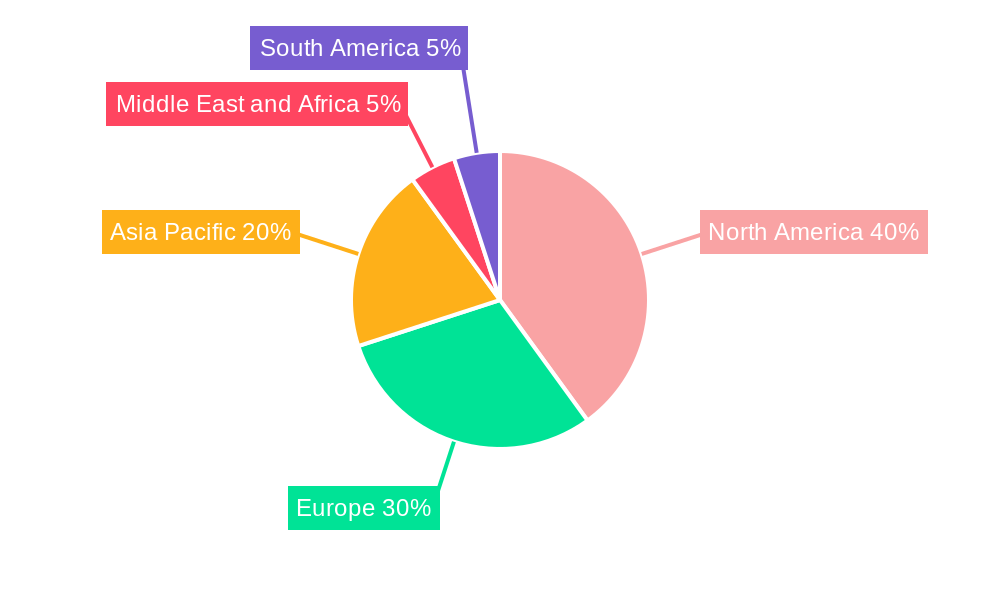
The forecast period (2025-2033) anticipates sustained market expansion, with a projected Compound Annual Growth Rate (CAGR) of 4.95%. This growth will be fueled by the factors mentioned above and further enhanced by technological advancements leading to improved safety, efficacy and patient comfort. North America, currently holding a significant market share, will maintain its dominance throughout the forecast period due to well-established healthcare infrastructure and high adoption rates. However, emerging markets in Asia-Pacific and other regions will display high growth potential, presenting lucrative opportunities for market expansion for existing and new players. Future growth will likely see a greater focus on personalized medicine, leading to the demand for more sophisticated, adaptable elastomeric pump systems tailored to individual patient needs.
Elastomeric Pump Industry: A Comprehensive Market Report (2019-2033)
This comprehensive report provides an in-depth analysis of the Elastomeric Pump industry, offering valuable insights for stakeholders seeking to understand market dynamics, growth opportunities, and competitive landscapes. Covering the period from 2019 to 2033, with a focus on 2025, this report presents a detailed forecast to 2033, analyzing key trends, drivers, and challenges shaping the industry's future. The global Elastomeric Pump market is projected to reach xx Million by 2033.
Elastomeric Pump Industry Market Dynamics & Concentration
The Elastomeric Pump market is characterized by a moderately concentrated landscape, with key players holding significant market shares. The market share of the top five players is estimated at approximately 55% in 2025. Innovation is a crucial driver, with companies constantly developing advanced features and functionalities to enhance pump efficacy and patient safety. Stringent regulatory frameworks, particularly in developed markets, influence product development and market entry strategies. Product substitutes, such as electronic infusion pumps, pose a competitive threat, forcing companies to emphasize the unique advantages of elastomeric pumps—primarily their portability and ease of use in ambulatory settings. End-user trends show a growing preference for variable-rate pumps for improved treatment precision. Mergers and acquisitions (M&A) are relatively frequent, driven by efforts to expand product portfolios and geographical reach. Between 2019 and 2024, an estimated xx M&A deals were recorded in the Elastomeric Pump sector.
- Market Concentration: Top 5 players hold ~55% market share (2025).
- Innovation Drivers: Improved safety, enhanced features, and technological advancements.
- Regulatory Frameworks: Stringent approvals in developed nations impact product launches.
- Product Substitutes: Electronic infusion pumps pose a competitive challenge.
- End-User Trends: Increasing demand for variable-rate pumps for precise drug delivery.
- M&A Activities: Approximately xx deals between 2019-2024, driving consolidation.
Elastomeric Pump Industry Industry Trends & Analysis
The Elastomeric Pump market exhibits robust growth, driven by rising prevalence of chronic diseases necessitating long-term infusions, coupled with increasing demand for ambulatory care and home healthcare. Technological disruptions, such as advancements in pump materials and control systems, further enhance market growth. Consumer preferences are shifting toward user-friendly, portable, and highly precise pumps. The competitive dynamics are intense, with companies focusing on product differentiation and strategic partnerships to gain market share. The CAGR for the Elastomeric Pump market is estimated at xx% from 2025 to 2033. Market penetration is expected to increase from xx% in 2025 to xx% by 2033.
Leading Markets & Segments in Elastomeric Pump Industry
The North American region dominates the Elastomeric Pump market, driven by high healthcare expenditure, a robust regulatory environment, and the significant presence of key players. Hospitals constitute the largest end-user segment, accounting for over 60% of market share, followed by ambulatory surgical centers. Variable-rate elastomeric infusion pumps represent a growing segment, attributed to their improved precision in drug delivery. Chemotherapy remains the primary application, followed by pain management.
- Key Drivers in North America: High healthcare spending, advanced infrastructure, and a mature regulatory landscape.
- Dominant End-User Segment: Hospitals (60%+ market share).
- Fastest-Growing Product Type: Variable-rate elastomeric infusion pumps.
- Largest Application Area: Chemotherapy.
Elastomeric Pump Industry Product Developments
Recent innovations in Elastomeric Pump technology have focused on improved accuracy, enhanced patient safety features (e.g., occlusion detection), and user-friendly interfaces. Miniaturization and the integration of wireless connectivity are emerging trends, enhancing portability and remote monitoring capabilities. These advancements cater to the increasing preference for home healthcare and ambulatory settings.
Key Drivers of Elastomeric Pump Industry Growth
Several factors propel the growth of the Elastomeric Pump industry: rising prevalence of chronic diseases, technological advancements leading to improved pump designs and functionalities, increasing demand for ambulatory care, and favorable regulatory support in several key markets. The growing adoption of home healthcare and the rising focus on patient-centric care further contributes to market expansion.
Challenges in the Elastomeric Pump Industry Market
The Elastomeric Pump market faces challenges including stringent regulatory approvals, potential supply chain disruptions impacting the availability of raw materials, and intense competition from substitute products. These factors may lead to variable pricing and pressure on profit margins. The impact of these challenges on the market is estimated to be xx Million in lost revenue by 2033.
Emerging Opportunities in Elastomeric Pump Industry
The Elastomeric Pump industry presents significant opportunities for growth. Technological breakthroughs, such as the development of biocompatible materials and advanced drug delivery systems, could enhance market potential. Strategic partnerships and collaborations amongst manufacturers, healthcare providers, and technology companies could unlock new avenues for market expansion. Expanding into emerging markets with high disease prevalence also presents significant growth prospects.
Leading Players in the Elastomeric Pump Industry Sector
- Daiken Medical Co Ltd
- Woo Young Medical Co
- Werfenlife SA (LeVenton SAU)
- Nipro Corporation
- Epic Medical Pte Ltd
- Ambu A/s
- Smiths Medical Inc (Smiths Group)
- B Braun Melsungen AG
- Baxter International Inc
- Avanos Medical Inc
Key Milestones in Elastomeric Pump Industry Industry
- March 2022: Shanghai MicroPort Lifesciences Co., Ltd. receives NMPA approval for its AutoEx Chemotherapy Infusion Pump. This significantly impacts the Chinese market.
- February 2021: Mindray Medical launches BeneFusion e series infusion systems, expanding its product portfolio and increasing competition.
Strategic Outlook for Elastomeric Pump Industry Market
The Elastomeric Pump market is poised for sustained growth, driven by ongoing technological innovations, increasing adoption of advanced therapies, and expanding healthcare infrastructure in emerging markets. Strategic partnerships, focused investments in research and development, and aggressive market expansion strategies will be crucial for companies to capitalize on the significant market opportunities.
Elastomeric Pump Industry Segmentation
-
1. Product Type
- 1.1. Continuous Rate Elastomeric Infusion Pumps
- 1.2. Variable Rate Elastomeric Infusion Pumps
-
2. Application
- 2.1. Pain Management
- 2.2. Chemotherapy
- 2.3. Chelation Therapy
- 2.4. Others
-
3. End User
- 3.1. Hospitals
- 3.2. Ambulatory Surgical Centers
- 3.3. Others
Elastomeric Pump Industry Segmentation By Geography
-
1. North America
- 1.1. United States
- 1.2. Canada
- 1.3. Mexico
-
2. Europe
- 2.1. Germany
- 2.2. United Kingdom
- 2.3. France
- 2.4. Italy
- 2.5. Spain
- 2.6. Rest of Europe
-
3. Asia Pacific
- 3.1. China
- 3.2. Japan
- 3.3. India
- 3.4. Australia
- 3.5. South Korea
- 3.6. Rest of Asia Pacific
-
4. Middle East and Africa
- 4.1. GCC
- 4.2. South Africa
- 4.3. Rest of Middle Eastst and Africa
-
5. South America
- 5.1. Brazil
- 5.2. Argentina
- 5.3. Rest of South America
Elastomeric Pump Industry REPORT HIGHLIGHTS
| Aspects | Details |
|---|---|
| Study Period | 2019-2033 |
| Base Year | 2024 |
| Estimated Year | 2025 |
| Forecast Period | 2025-2033 |
| Historical Period | 2019-2024 |
| Growth Rate | CAGR of 4.95% from 2019-2033 |
| Segmentation |
|
Table of Contents
- 1. Introduction
- 1.1. Research Scope
- 1.2. Market Segmentation
- 1.3. Research Methodology
- 1.4. Definitions and Assumptions
- 2. Executive Summary
- 2.1. Introduction
- 3. Market Dynamics
- 3.1. Introduction
- 3.2. Market Drivers
- 3.2.1. Advancements in Device Technologies and Advantages of the Elastomeric Pumps; Growing Burden of Chronic Diseases
- 3.3. Market Restrains
- 3.3.1. Safety Issues and Disadvantages Associated with the Pumps; High Cost in Long-Term Use and Strict Regulations
- 3.4. Market Trends
- 3.4.1. Chemotherapy Segment Expects to Register a High CAGR During the Forecast Period
- 4. Market Factor Analysis
- 4.1. Porters Five Forces
- 4.2. Supply/Value Chain
- 4.3. PESTEL analysis
- 4.4. Market Entropy
- 4.5. Patent/Trademark Analysis
- 5. Global Elastomeric Pump Industry Analysis, Insights and Forecast, 2019-2031
- 5.1. Market Analysis, Insights and Forecast - by Product Type
- 5.1.1. Continuous Rate Elastomeric Infusion Pumps
- 5.1.2. Variable Rate Elastomeric Infusion Pumps
- 5.2. Market Analysis, Insights and Forecast - by Application
- 5.2.1. Pain Management
- 5.2.2. Chemotherapy
- 5.2.3. Chelation Therapy
- 5.2.4. Others
- 5.3. Market Analysis, Insights and Forecast - by End User
- 5.3.1. Hospitals
- 5.3.2. Ambulatory Surgical Centers
- 5.3.3. Others
- 5.4. Market Analysis, Insights and Forecast - by Region
- 5.4.1. North America
- 5.4.2. Europe
- 5.4.3. Asia Pacific
- 5.4.4. Middle East and Africa
- 5.4.5. South America
- 5.1. Market Analysis, Insights and Forecast - by Product Type
- 6. North America Elastomeric Pump Industry Analysis, Insights and Forecast, 2019-2031
- 6.1. Market Analysis, Insights and Forecast - by Product Type
- 6.1.1. Continuous Rate Elastomeric Infusion Pumps
- 6.1.2. Variable Rate Elastomeric Infusion Pumps
- 6.2. Market Analysis, Insights and Forecast - by Application
- 6.2.1. Pain Management
- 6.2.2. Chemotherapy
- 6.2.3. Chelation Therapy
- 6.2.4. Others
- 6.3. Market Analysis, Insights and Forecast - by End User
- 6.3.1. Hospitals
- 6.3.2. Ambulatory Surgical Centers
- 6.3.3. Others
- 6.1. Market Analysis, Insights and Forecast - by Product Type
- 7. Europe Elastomeric Pump Industry Analysis, Insights and Forecast, 2019-2031
- 7.1. Market Analysis, Insights and Forecast - by Product Type
- 7.1.1. Continuous Rate Elastomeric Infusion Pumps
- 7.1.2. Variable Rate Elastomeric Infusion Pumps
- 7.2. Market Analysis, Insights and Forecast - by Application
- 7.2.1. Pain Management
- 7.2.2. Chemotherapy
- 7.2.3. Chelation Therapy
- 7.2.4. Others
- 7.3. Market Analysis, Insights and Forecast - by End User
- 7.3.1. Hospitals
- 7.3.2. Ambulatory Surgical Centers
- 7.3.3. Others
- 7.1. Market Analysis, Insights and Forecast - by Product Type
- 8. Asia Pacific Elastomeric Pump Industry Analysis, Insights and Forecast, 2019-2031
- 8.1. Market Analysis, Insights and Forecast - by Product Type
- 8.1.1. Continuous Rate Elastomeric Infusion Pumps
- 8.1.2. Variable Rate Elastomeric Infusion Pumps
- 8.2. Market Analysis, Insights and Forecast - by Application
- 8.2.1. Pain Management
- 8.2.2. Chemotherapy
- 8.2.3. Chelation Therapy
- 8.2.4. Others
- 8.3. Market Analysis, Insights and Forecast - by End User
- 8.3.1. Hospitals
- 8.3.2. Ambulatory Surgical Centers
- 8.3.3. Others
- 8.1. Market Analysis, Insights and Forecast - by Product Type
- 9. Middle East and Africa Elastomeric Pump Industry Analysis, Insights and Forecast, 2019-2031
- 9.1. Market Analysis, Insights and Forecast - by Product Type
- 9.1.1. Continuous Rate Elastomeric Infusion Pumps
- 9.1.2. Variable Rate Elastomeric Infusion Pumps
- 9.2. Market Analysis, Insights and Forecast - by Application
- 9.2.1. Pain Management
- 9.2.2. Chemotherapy
- 9.2.3. Chelation Therapy
- 9.2.4. Others
- 9.3. Market Analysis, Insights and Forecast - by End User
- 9.3.1. Hospitals
- 9.3.2. Ambulatory Surgical Centers
- 9.3.3. Others
- 9.1. Market Analysis, Insights and Forecast - by Product Type
- 10. South America Elastomeric Pump Industry Analysis, Insights and Forecast, 2019-2031
- 10.1. Market Analysis, Insights and Forecast - by Product Type
- 10.1.1. Continuous Rate Elastomeric Infusion Pumps
- 10.1.2. Variable Rate Elastomeric Infusion Pumps
- 10.2. Market Analysis, Insights and Forecast - by Application
- 10.2.1. Pain Management
- 10.2.2. Chemotherapy
- 10.2.3. Chelation Therapy
- 10.2.4. Others
- 10.3. Market Analysis, Insights and Forecast - by End User
- 10.3.1. Hospitals
- 10.3.2. Ambulatory Surgical Centers
- 10.3.3. Others
- 10.1. Market Analysis, Insights and Forecast - by Product Type
- 11. North America Elastomeric Pump Industry Analysis, Insights and Forecast, 2019-2031
- 11.1. Market Analysis, Insights and Forecast - By Country/Sub-region
- 11.1.1 United States
- 11.1.2 Canada
- 11.1.3 Mexico
- 12. Europe Elastomeric Pump Industry Analysis, Insights and Forecast, 2019-2031
- 12.1. Market Analysis, Insights and Forecast - By Country/Sub-region
- 12.1.1 Germany
- 12.1.2 United Kingdom
- 12.1.3 France
- 12.1.4 Italy
- 12.1.5 Spain
- 12.1.6 Rest of Europe
- 13. Asia Pacific Elastomeric Pump Industry Analysis, Insights and Forecast, 2019-2031
- 13.1. Market Analysis, Insights and Forecast - By Country/Sub-region
- 13.1.1 China
- 13.1.2 Japan
- 13.1.3 India
- 13.1.4 Australia
- 13.1.5 South Korea
- 13.1.6 Rest of Asia Pacific
- 14. Middle East and Africa Elastomeric Pump Industry Analysis, Insights and Forecast, 2019-2031
- 14.1. Market Analysis, Insights and Forecast - By Country/Sub-region
- 14.1.1 GCC
- 14.1.2 South Africa
- 14.1.3 Rest of Middle Eastst and Africa
- 15. South America Elastomeric Pump Industry Analysis, Insights and Forecast, 2019-2031
- 15.1. Market Analysis, Insights and Forecast - By Country/Sub-region
- 15.1.1 Brazil
- 15.1.2 Argentina
- 15.1.3 Rest of South America
- 16. Competitive Analysis
- 16.1. Global Market Share Analysis 2024
- 16.2. Company Profiles
- 16.2.1 Daiken Medical Co Ltd
- 16.2.1.1. Overview
- 16.2.1.2. Products
- 16.2.1.3. SWOT Analysis
- 16.2.1.4. Recent Developments
- 16.2.1.5. Financials (Based on Availability)
- 16.2.2 Woo Young Medical Co
- 16.2.2.1. Overview
- 16.2.2.2. Products
- 16.2.2.3. SWOT Analysis
- 16.2.2.4. Recent Developments
- 16.2.2.5. Financials (Based on Availability)
- 16.2.3 Werfenlife SA (LeVenton SAU)
- 16.2.3.1. Overview
- 16.2.3.2. Products
- 16.2.3.3. SWOT Analysis
- 16.2.3.4. Recent Developments
- 16.2.3.5. Financials (Based on Availability)
- 16.2.4 Nipro Corporation
- 16.2.4.1. Overview
- 16.2.4.2. Products
- 16.2.4.3. SWOT Analysis
- 16.2.4.4. Recent Developments
- 16.2.4.5. Financials (Based on Availability)
- 16.2.5 Epic Medical Pte Ltd
- 16.2.5.1. Overview
- 16.2.5.2. Products
- 16.2.5.3. SWOT Analysis
- 16.2.5.4. Recent Developments
- 16.2.5.5. Financials (Based on Availability)
- 16.2.6 Ambu A/s
- 16.2.6.1. Overview
- 16.2.6.2. Products
- 16.2.6.3. SWOT Analysis
- 16.2.6.4. Recent Developments
- 16.2.6.5. Financials (Based on Availability)
- 16.2.7 Smiths Medical Inc (Smiths Group)
- 16.2.7.1. Overview
- 16.2.7.2. Products
- 16.2.7.3. SWOT Analysis
- 16.2.7.4. Recent Developments
- 16.2.7.5. Financials (Based on Availability)
- 16.2.8 B Braun Melsungen AG
- 16.2.8.1. Overview
- 16.2.8.2. Products
- 16.2.8.3. SWOT Analysis
- 16.2.8.4. Recent Developments
- 16.2.8.5. Financials (Based on Availability)
- 16.2.9 Baxter International Inc
- 16.2.9.1. Overview
- 16.2.9.2. Products
- 16.2.9.3. SWOT Analysis
- 16.2.9.4. Recent Developments
- 16.2.9.5. Financials (Based on Availability)
- 16.2.10 Avanos Medical Inc
- 16.2.10.1. Overview
- 16.2.10.2. Products
- 16.2.10.3. SWOT Analysis
- 16.2.10.4. Recent Developments
- 16.2.10.5. Financials (Based on Availability)
- 16.2.1 Daiken Medical Co Ltd
List of Figures
- Figure 1: Global Elastomeric Pump Industry Revenue Breakdown (Million, %) by Region 2024 & 2032
- Figure 2: Global Elastomeric Pump Industry Volume Breakdown (K Unit, %) by Region 2024 & 2032
- Figure 3: North America Elastomeric Pump Industry Revenue (Million), by Country 2024 & 2032
- Figure 4: North America Elastomeric Pump Industry Volume (K Unit), by Country 2024 & 2032
- Figure 5: North America Elastomeric Pump Industry Revenue Share (%), by Country 2024 & 2032
- Figure 6: North America Elastomeric Pump Industry Volume Share (%), by Country 2024 & 2032
- Figure 7: Europe Elastomeric Pump Industry Revenue (Million), by Country 2024 & 2032
- Figure 8: Europe Elastomeric Pump Industry Volume (K Unit), by Country 2024 & 2032
- Figure 9: Europe Elastomeric Pump Industry Revenue Share (%), by Country 2024 & 2032
- Figure 10: Europe Elastomeric Pump Industry Volume Share (%), by Country 2024 & 2032
- Figure 11: Asia Pacific Elastomeric Pump Industry Revenue (Million), by Country 2024 & 2032
- Figure 12: Asia Pacific Elastomeric Pump Industry Volume (K Unit), by Country 2024 & 2032
- Figure 13: Asia Pacific Elastomeric Pump Industry Revenue Share (%), by Country 2024 & 2032
- Figure 14: Asia Pacific Elastomeric Pump Industry Volume Share (%), by Country 2024 & 2032
- Figure 15: Middle East and Africa Elastomeric Pump Industry Revenue (Million), by Country 2024 & 2032
- Figure 16: Middle East and Africa Elastomeric Pump Industry Volume (K Unit), by Country 2024 & 2032
- Figure 17: Middle East and Africa Elastomeric Pump Industry Revenue Share (%), by Country 2024 & 2032
- Figure 18: Middle East and Africa Elastomeric Pump Industry Volume Share (%), by Country 2024 & 2032
- Figure 19: South America Elastomeric Pump Industry Revenue (Million), by Country 2024 & 2032
- Figure 20: South America Elastomeric Pump Industry Volume (K Unit), by Country 2024 & 2032
- Figure 21: South America Elastomeric Pump Industry Revenue Share (%), by Country 2024 & 2032
- Figure 22: South America Elastomeric Pump Industry Volume Share (%), by Country 2024 & 2032
- Figure 23: North America Elastomeric Pump Industry Revenue (Million), by Product Type 2024 & 2032
- Figure 24: North America Elastomeric Pump Industry Volume (K Unit), by Product Type 2024 & 2032
- Figure 25: North America Elastomeric Pump Industry Revenue Share (%), by Product Type 2024 & 2032
- Figure 26: North America Elastomeric Pump Industry Volume Share (%), by Product Type 2024 & 2032
- Figure 27: North America Elastomeric Pump Industry Revenue (Million), by Application 2024 & 2032
- Figure 28: North America Elastomeric Pump Industry Volume (K Unit), by Application 2024 & 2032
- Figure 29: North America Elastomeric Pump Industry Revenue Share (%), by Application 2024 & 2032
- Figure 30: North America Elastomeric Pump Industry Volume Share (%), by Application 2024 & 2032
- Figure 31: North America Elastomeric Pump Industry Revenue (Million), by End User 2024 & 2032
- Figure 32: North America Elastomeric Pump Industry Volume (K Unit), by End User 2024 & 2032
- Figure 33: North America Elastomeric Pump Industry Revenue Share (%), by End User 2024 & 2032
- Figure 34: North America Elastomeric Pump Industry Volume Share (%), by End User 2024 & 2032
- Figure 35: North America Elastomeric Pump Industry Revenue (Million), by Country 2024 & 2032
- Figure 36: North America Elastomeric Pump Industry Volume (K Unit), by Country 2024 & 2032
- Figure 37: North America Elastomeric Pump Industry Revenue Share (%), by Country 2024 & 2032
- Figure 38: North America Elastomeric Pump Industry Volume Share (%), by Country 2024 & 2032
- Figure 39: Europe Elastomeric Pump Industry Revenue (Million), by Product Type 2024 & 2032
- Figure 40: Europe Elastomeric Pump Industry Volume (K Unit), by Product Type 2024 & 2032
- Figure 41: Europe Elastomeric Pump Industry Revenue Share (%), by Product Type 2024 & 2032
- Figure 42: Europe Elastomeric Pump Industry Volume Share (%), by Product Type 2024 & 2032
- Figure 43: Europe Elastomeric Pump Industry Revenue (Million), by Application 2024 & 2032
- Figure 44: Europe Elastomeric Pump Industry Volume (K Unit), by Application 2024 & 2032
- Figure 45: Europe Elastomeric Pump Industry Revenue Share (%), by Application 2024 & 2032
- Figure 46: Europe Elastomeric Pump Industry Volume Share (%), by Application 2024 & 2032
- Figure 47: Europe Elastomeric Pump Industry Revenue (Million), by End User 2024 & 2032
- Figure 48: Europe Elastomeric Pump Industry Volume (K Unit), by End User 2024 & 2032
- Figure 49: Europe Elastomeric Pump Industry Revenue Share (%), by End User 2024 & 2032
- Figure 50: Europe Elastomeric Pump Industry Volume Share (%), by End User 2024 & 2032
- Figure 51: Europe Elastomeric Pump Industry Revenue (Million), by Country 2024 & 2032
- Figure 52: Europe Elastomeric Pump Industry Volume (K Unit), by Country 2024 & 2032
- Figure 53: Europe Elastomeric Pump Industry Revenue Share (%), by Country 2024 & 2032
- Figure 54: Europe Elastomeric Pump Industry Volume Share (%), by Country 2024 & 2032
- Figure 55: Asia Pacific Elastomeric Pump Industry Revenue (Million), by Product Type 2024 & 2032
- Figure 56: Asia Pacific Elastomeric Pump Industry Volume (K Unit), by Product Type 2024 & 2032
- Figure 57: Asia Pacific Elastomeric Pump Industry Revenue Share (%), by Product Type 2024 & 2032
- Figure 58: Asia Pacific Elastomeric Pump Industry Volume Share (%), by Product Type 2024 & 2032
- Figure 59: Asia Pacific Elastomeric Pump Industry Revenue (Million), by Application 2024 & 2032
- Figure 60: Asia Pacific Elastomeric Pump Industry Volume (K Unit), by Application 2024 & 2032
- Figure 61: Asia Pacific Elastomeric Pump Industry Revenue Share (%), by Application 2024 & 2032
- Figure 62: Asia Pacific Elastomeric Pump Industry Volume Share (%), by Application 2024 & 2032
- Figure 63: Asia Pacific Elastomeric Pump Industry Revenue (Million), by End User 2024 & 2032
- Figure 64: Asia Pacific Elastomeric Pump Industry Volume (K Unit), by End User 2024 & 2032
- Figure 65: Asia Pacific Elastomeric Pump Industry Revenue Share (%), by End User 2024 & 2032
- Figure 66: Asia Pacific Elastomeric Pump Industry Volume Share (%), by End User 2024 & 2032
- Figure 67: Asia Pacific Elastomeric Pump Industry Revenue (Million), by Country 2024 & 2032
- Figure 68: Asia Pacific Elastomeric Pump Industry Volume (K Unit), by Country 2024 & 2032
- Figure 69: Asia Pacific Elastomeric Pump Industry Revenue Share (%), by Country 2024 & 2032
- Figure 70: Asia Pacific Elastomeric Pump Industry Volume Share (%), by Country 2024 & 2032
- Figure 71: Middle East and Africa Elastomeric Pump Industry Revenue (Million), by Product Type 2024 & 2032
- Figure 72: Middle East and Africa Elastomeric Pump Industry Volume (K Unit), by Product Type 2024 & 2032
- Figure 73: Middle East and Africa Elastomeric Pump Industry Revenue Share (%), by Product Type 2024 & 2032
- Figure 74: Middle East and Africa Elastomeric Pump Industry Volume Share (%), by Product Type 2024 & 2032
- Figure 75: Middle East and Africa Elastomeric Pump Industry Revenue (Million), by Application 2024 & 2032
- Figure 76: Middle East and Africa Elastomeric Pump Industry Volume (K Unit), by Application 2024 & 2032
- Figure 77: Middle East and Africa Elastomeric Pump Industry Revenue Share (%), by Application 2024 & 2032
- Figure 78: Middle East and Africa Elastomeric Pump Industry Volume Share (%), by Application 2024 & 2032
- Figure 79: Middle East and Africa Elastomeric Pump Industry Revenue (Million), by End User 2024 & 2032
- Figure 80: Middle East and Africa Elastomeric Pump Industry Volume (K Unit), by End User 2024 & 2032
- Figure 81: Middle East and Africa Elastomeric Pump Industry Revenue Share (%), by End User 2024 & 2032
- Figure 82: Middle East and Africa Elastomeric Pump Industry Volume Share (%), by End User 2024 & 2032
- Figure 83: Middle East and Africa Elastomeric Pump Industry Revenue (Million), by Country 2024 & 2032
- Figure 84: Middle East and Africa Elastomeric Pump Industry Volume (K Unit), by Country 2024 & 2032
- Figure 85: Middle East and Africa Elastomeric Pump Industry Revenue Share (%), by Country 2024 & 2032
- Figure 86: Middle East and Africa Elastomeric Pump Industry Volume Share (%), by Country 2024 & 2032
- Figure 87: South America Elastomeric Pump Industry Revenue (Million), by Product Type 2024 & 2032
- Figure 88: South America Elastomeric Pump Industry Volume (K Unit), by Product Type 2024 & 2032
- Figure 89: South America Elastomeric Pump Industry Revenue Share (%), by Product Type 2024 & 2032
- Figure 90: South America Elastomeric Pump Industry Volume Share (%), by Product Type 2024 & 2032
- Figure 91: South America Elastomeric Pump Industry Revenue (Million), by Application 2024 & 2032
- Figure 92: South America Elastomeric Pump Industry Volume (K Unit), by Application 2024 & 2032
- Figure 93: South America Elastomeric Pump Industry Revenue Share (%), by Application 2024 & 2032
- Figure 94: South America Elastomeric Pump Industry Volume Share (%), by Application 2024 & 2032
- Figure 95: South America Elastomeric Pump Industry Revenue (Million), by End User 2024 & 2032
- Figure 96: South America Elastomeric Pump Industry Volume (K Unit), by End User 2024 & 2032
- Figure 97: South America Elastomeric Pump Industry Revenue Share (%), by End User 2024 & 2032
- Figure 98: South America Elastomeric Pump Industry Volume Share (%), by End User 2024 & 2032
- Figure 99: South America Elastomeric Pump Industry Revenue (Million), by Country 2024 & 2032
- Figure 100: South America Elastomeric Pump Industry Volume (K Unit), by Country 2024 & 2032
- Figure 101: South America Elastomeric Pump Industry Revenue Share (%), by Country 2024 & 2032
- Figure 102: South America Elastomeric Pump Industry Volume Share (%), by Country 2024 & 2032
List of Tables
- Table 1: Global Elastomeric Pump Industry Revenue Million Forecast, by Region 2019 & 2032
- Table 2: Global Elastomeric Pump Industry Volume K Unit Forecast, by Region 2019 & 2032
- Table 3: Global Elastomeric Pump Industry Revenue Million Forecast, by Product Type 2019 & 2032
- Table 4: Global Elastomeric Pump Industry Volume K Unit Forecast, by Product Type 2019 & 2032
- Table 5: Global Elastomeric Pump Industry Revenue Million Forecast, by Application 2019 & 2032
- Table 6: Global Elastomeric Pump Industry Volume K Unit Forecast, by Application 2019 & 2032
- Table 7: Global Elastomeric Pump Industry Revenue Million Forecast, by End User 2019 & 2032
- Table 8: Global Elastomeric Pump Industry Volume K Unit Forecast, by End User 2019 & 2032
- Table 9: Global Elastomeric Pump Industry Revenue Million Forecast, by Region 2019 & 2032
- Table 10: Global Elastomeric Pump Industry Volume K Unit Forecast, by Region 2019 & 2032
- Table 11: Global Elastomeric Pump Industry Revenue Million Forecast, by Country 2019 & 2032
- Table 12: Global Elastomeric Pump Industry Volume K Unit Forecast, by Country 2019 & 2032
- Table 13: United States Elastomeric Pump Industry Revenue (Million) Forecast, by Application 2019 & 2032
- Table 14: United States Elastomeric Pump Industry Volume (K Unit) Forecast, by Application 2019 & 2032
- Table 15: Canada Elastomeric Pump Industry Revenue (Million) Forecast, by Application 2019 & 2032
- Table 16: Canada Elastomeric Pump Industry Volume (K Unit) Forecast, by Application 2019 & 2032
- Table 17: Mexico Elastomeric Pump Industry Revenue (Million) Forecast, by Application 2019 & 2032
- Table 18: Mexico Elastomeric Pump Industry Volume (K Unit) Forecast, by Application 2019 & 2032
- Table 19: Global Elastomeric Pump Industry Revenue Million Forecast, by Country 2019 & 2032
- Table 20: Global Elastomeric Pump Industry Volume K Unit Forecast, by Country 2019 & 2032
- Table 21: Germany Elastomeric Pump Industry Revenue (Million) Forecast, by Application 2019 & 2032
- Table 22: Germany Elastomeric Pump Industry Volume (K Unit) Forecast, by Application 2019 & 2032
- Table 23: United Kingdom Elastomeric Pump Industry Revenue (Million) Forecast, by Application 2019 & 2032
- Table 24: United Kingdom Elastomeric Pump Industry Volume (K Unit) Forecast, by Application 2019 & 2032
- Table 25: France Elastomeric Pump Industry Revenue (Million) Forecast, by Application 2019 & 2032
- Table 26: France Elastomeric Pump Industry Volume (K Unit) Forecast, by Application 2019 & 2032
- Table 27: Italy Elastomeric Pump Industry Revenue (Million) Forecast, by Application 2019 & 2032
- Table 28: Italy Elastomeric Pump Industry Volume (K Unit) Forecast, by Application 2019 & 2032
- Table 29: Spain Elastomeric Pump Industry Revenue (Million) Forecast, by Application 2019 & 2032
- Table 30: Spain Elastomeric Pump Industry Volume (K Unit) Forecast, by Application 2019 & 2032
- Table 31: Rest of Europe Elastomeric Pump Industry Revenue (Million) Forecast, by Application 2019 & 2032
- Table 32: Rest of Europe Elastomeric Pump Industry Volume (K Unit) Forecast, by Application 2019 & 2032
- Table 33: Global Elastomeric Pump Industry Revenue Million Forecast, by Country 2019 & 2032
- Table 34: Global Elastomeric Pump Industry Volume K Unit Forecast, by Country 2019 & 2032
- Table 35: China Elastomeric Pump Industry Revenue (Million) Forecast, by Application 2019 & 2032
- Table 36: China Elastomeric Pump Industry Volume (K Unit) Forecast, by Application 2019 & 2032
- Table 37: Japan Elastomeric Pump Industry Revenue (Million) Forecast, by Application 2019 & 2032
- Table 38: Japan Elastomeric Pump Industry Volume (K Unit) Forecast, by Application 2019 & 2032
- Table 39: India Elastomeric Pump Industry Revenue (Million) Forecast, by Application 2019 & 2032
- Table 40: India Elastomeric Pump Industry Volume (K Unit) Forecast, by Application 2019 & 2032
- Table 41: Australia Elastomeric Pump Industry Revenue (Million) Forecast, by Application 2019 & 2032
- Table 42: Australia Elastomeric Pump Industry Volume (K Unit) Forecast, by Application 2019 & 2032
- Table 43: South Korea Elastomeric Pump Industry Revenue (Million) Forecast, by Application 2019 & 2032
- Table 44: South Korea Elastomeric Pump Industry Volume (K Unit) Forecast, by Application 2019 & 2032
- Table 45: Rest of Asia Pacific Elastomeric Pump Industry Revenue (Million) Forecast, by Application 2019 & 2032
- Table 46: Rest of Asia Pacific Elastomeric Pump Industry Volume (K Unit) Forecast, by Application 2019 & 2032
- Table 47: Global Elastomeric Pump Industry Revenue Million Forecast, by Country 2019 & 2032
- Table 48: Global Elastomeric Pump Industry Volume K Unit Forecast, by Country 2019 & 2032
- Table 49: GCC Elastomeric Pump Industry Revenue (Million) Forecast, by Application 2019 & 2032
- Table 50: GCC Elastomeric Pump Industry Volume (K Unit) Forecast, by Application 2019 & 2032
- Table 51: South Africa Elastomeric Pump Industry Revenue (Million) Forecast, by Application 2019 & 2032
- Table 52: South Africa Elastomeric Pump Industry Volume (K Unit) Forecast, by Application 2019 & 2032
- Table 53: Rest of Middle Eastst and Africa Elastomeric Pump Industry Revenue (Million) Forecast, by Application 2019 & 2032
- Table 54: Rest of Middle Eastst and Africa Elastomeric Pump Industry Volume (K Unit) Forecast, by Application 2019 & 2032
- Table 55: Global Elastomeric Pump Industry Revenue Million Forecast, by Country 2019 & 2032
- Table 56: Global Elastomeric Pump Industry Volume K Unit Forecast, by Country 2019 & 2032
- Table 57: Brazil Elastomeric Pump Industry Revenue (Million) Forecast, by Application 2019 & 2032
- Table 58: Brazil Elastomeric Pump Industry Volume (K Unit) Forecast, by Application 2019 & 2032
- Table 59: Argentina Elastomeric Pump Industry Revenue (Million) Forecast, by Application 2019 & 2032
- Table 60: Argentina Elastomeric Pump Industry Volume (K Unit) Forecast, by Application 2019 & 2032
- Table 61: Rest of South America Elastomeric Pump Industry Revenue (Million) Forecast, by Application 2019 & 2032
- Table 62: Rest of South America Elastomeric Pump Industry Volume (K Unit) Forecast, by Application 2019 & 2032
- Table 63: Global Elastomeric Pump Industry Revenue Million Forecast, by Product Type 2019 & 2032
- Table 64: Global Elastomeric Pump Industry Volume K Unit Forecast, by Product Type 2019 & 2032
- Table 65: Global Elastomeric Pump Industry Revenue Million Forecast, by Application 2019 & 2032
- Table 66: Global Elastomeric Pump Industry Volume K Unit Forecast, by Application 2019 & 2032
- Table 67: Global Elastomeric Pump Industry Revenue Million Forecast, by End User 2019 & 2032
- Table 68: Global Elastomeric Pump Industry Volume K Unit Forecast, by End User 2019 & 2032
- Table 69: Global Elastomeric Pump Industry Revenue Million Forecast, by Country 2019 & 2032
- Table 70: Global Elastomeric Pump Industry Volume K Unit Forecast, by Country 2019 & 2032
- Table 71: United States Elastomeric Pump Industry Revenue (Million) Forecast, by Application 2019 & 2032
- Table 72: United States Elastomeric Pump Industry Volume (K Unit) Forecast, by Application 2019 & 2032
- Table 73: Canada Elastomeric Pump Industry Revenue (Million) Forecast, by Application 2019 & 2032
- Table 74: Canada Elastomeric Pump Industry Volume (K Unit) Forecast, by Application 2019 & 2032
- Table 75: Mexico Elastomeric Pump Industry Revenue (Million) Forecast, by Application 2019 & 2032
- Table 76: Mexico Elastomeric Pump Industry Volume (K Unit) Forecast, by Application 2019 & 2032
- Table 77: Global Elastomeric Pump Industry Revenue Million Forecast, by Product Type 2019 & 2032
- Table 78: Global Elastomeric Pump Industry Volume K Unit Forecast, by Product Type 2019 & 2032
- Table 79: Global Elastomeric Pump Industry Revenue Million Forecast, by Application 2019 & 2032
- Table 80: Global Elastomeric Pump Industry Volume K Unit Forecast, by Application 2019 & 2032
- Table 81: Global Elastomeric Pump Industry Revenue Million Forecast, by End User 2019 & 2032
- Table 82: Global Elastomeric Pump Industry Volume K Unit Forecast, by End User 2019 & 2032
- Table 83: Global Elastomeric Pump Industry Revenue Million Forecast, by Country 2019 & 2032
- Table 84: Global Elastomeric Pump Industry Volume K Unit Forecast, by Country 2019 & 2032
- Table 85: Germany Elastomeric Pump Industry Revenue (Million) Forecast, by Application 2019 & 2032
- Table 86: Germany Elastomeric Pump Industry Volume (K Unit) Forecast, by Application 2019 & 2032
- Table 87: United Kingdom Elastomeric Pump Industry Revenue (Million) Forecast, by Application 2019 & 2032
- Table 88: United Kingdom Elastomeric Pump Industry Volume (K Unit) Forecast, by Application 2019 & 2032
- Table 89: France Elastomeric Pump Industry Revenue (Million) Forecast, by Application 2019 & 2032
- Table 90: France Elastomeric Pump Industry Volume (K Unit) Forecast, by Application 2019 & 2032
- Table 91: Italy Elastomeric Pump Industry Revenue (Million) Forecast, by Application 2019 & 2032
- Table 92: Italy Elastomeric Pump Industry Volume (K Unit) Forecast, by Application 2019 & 2032
- Table 93: Spain Elastomeric Pump Industry Revenue (Million) Forecast, by Application 2019 & 2032
- Table 94: Spain Elastomeric Pump Industry Volume (K Unit) Forecast, by Application 2019 & 2032
- Table 95: Rest of Europe Elastomeric Pump Industry Revenue (Million) Forecast, by Application 2019 & 2032
- Table 96: Rest of Europe Elastomeric Pump Industry Volume (K Unit) Forecast, by Application 2019 & 2032
- Table 97: Global Elastomeric Pump Industry Revenue Million Forecast, by Product Type 2019 & 2032
- Table 98: Global Elastomeric Pump Industry Volume K Unit Forecast, by Product Type 2019 & 2032
- Table 99: Global Elastomeric Pump Industry Revenue Million Forecast, by Application 2019 & 2032
- Table 100: Global Elastomeric Pump Industry Volume K Unit Forecast, by Application 2019 & 2032
- Table 101: Global Elastomeric Pump Industry Revenue Million Forecast, by End User 2019 & 2032
- Table 102: Global Elastomeric Pump Industry Volume K Unit Forecast, by End User 2019 & 2032
- Table 103: Global Elastomeric Pump Industry Revenue Million Forecast, by Country 2019 & 2032
- Table 104: Global Elastomeric Pump Industry Volume K Unit Forecast, by Country 2019 & 2032
- Table 105: China Elastomeric Pump Industry Revenue (Million) Forecast, by Application 2019 & 2032
- Table 106: China Elastomeric Pump Industry Volume (K Unit) Forecast, by Application 2019 & 2032
- Table 107: Japan Elastomeric Pump Industry Revenue (Million) Forecast, by Application 2019 & 2032
- Table 108: Japan Elastomeric Pump Industry Volume (K Unit) Forecast, by Application 2019 & 2032
- Table 109: India Elastomeric Pump Industry Revenue (Million) Forecast, by Application 2019 & 2032
- Table 110: India Elastomeric Pump Industry Volume (K Unit) Forecast, by Application 2019 & 2032
- Table 111: Australia Elastomeric Pump Industry Revenue (Million) Forecast, by Application 2019 & 2032
- Table 112: Australia Elastomeric Pump Industry Volume (K Unit) Forecast, by Application 2019 & 2032
- Table 113: South Korea Elastomeric Pump Industry Revenue (Million) Forecast, by Application 2019 & 2032
- Table 114: South Korea Elastomeric Pump Industry Volume (K Unit) Forecast, by Application 2019 & 2032
- Table 115: Rest of Asia Pacific Elastomeric Pump Industry Revenue (Million) Forecast, by Application 2019 & 2032
- Table 116: Rest of Asia Pacific Elastomeric Pump Industry Volume (K Unit) Forecast, by Application 2019 & 2032
- Table 117: Global Elastomeric Pump Industry Revenue Million Forecast, by Product Type 2019 & 2032
- Table 118: Global Elastomeric Pump Industry Volume K Unit Forecast, by Product Type 2019 & 2032
- Table 119: Global Elastomeric Pump Industry Revenue Million Forecast, by Application 2019 & 2032
- Table 120: Global Elastomeric Pump Industry Volume K Unit Forecast, by Application 2019 & 2032
- Table 121: Global Elastomeric Pump Industry Revenue Million Forecast, by End User 2019 & 2032
- Table 122: Global Elastomeric Pump Industry Volume K Unit Forecast, by End User 2019 & 2032
- Table 123: Global Elastomeric Pump Industry Revenue Million Forecast, by Country 2019 & 2032
- Table 124: Global Elastomeric Pump Industry Volume K Unit Forecast, by Country 2019 & 2032
- Table 125: GCC Elastomeric Pump Industry Revenue (Million) Forecast, by Application 2019 & 2032
- Table 126: GCC Elastomeric Pump Industry Volume (K Unit) Forecast, by Application 2019 & 2032
- Table 127: South Africa Elastomeric Pump Industry Revenue (Million) Forecast, by Application 2019 & 2032
- Table 128: South Africa Elastomeric Pump Industry Volume (K Unit) Forecast, by Application 2019 & 2032
- Table 129: Rest of Middle Eastst and Africa Elastomeric Pump Industry Revenue (Million) Forecast, by Application 2019 & 2032
- Table 130: Rest of Middle Eastst and Africa Elastomeric Pump Industry Volume (K Unit) Forecast, by Application 2019 & 2032
- Table 131: Global Elastomeric Pump Industry Revenue Million Forecast, by Product Type 2019 & 2032
- Table 132: Global Elastomeric Pump Industry Volume K Unit Forecast, by Product Type 2019 & 2032
- Table 133: Global Elastomeric Pump Industry Revenue Million Forecast, by Application 2019 & 2032
- Table 134: Global Elastomeric Pump Industry Volume K Unit Forecast, by Application 2019 & 2032
- Table 135: Global Elastomeric Pump Industry Revenue Million Forecast, by End User 2019 & 2032
- Table 136: Global Elastomeric Pump Industry Volume K Unit Forecast, by End User 2019 & 2032
- Table 137: Global Elastomeric Pump Industry Revenue Million Forecast, by Country 2019 & 2032
- Table 138: Global Elastomeric Pump Industry Volume K Unit Forecast, by Country 2019 & 2032
- Table 139: Brazil Elastomeric Pump Industry Revenue (Million) Forecast, by Application 2019 & 2032
- Table 140: Brazil Elastomeric Pump Industry Volume (K Unit) Forecast, by Application 2019 & 2032
- Table 141: Argentina Elastomeric Pump Industry Revenue (Million) Forecast, by Application 2019 & 2032
- Table 142: Argentina Elastomeric Pump Industry Volume (K Unit) Forecast, by Application 2019 & 2032
- Table 143: Rest of South America Elastomeric Pump Industry Revenue (Million) Forecast, by Application 2019 & 2032
- Table 144: Rest of South America Elastomeric Pump Industry Volume (K Unit) Forecast, by Application 2019 & 2032
Frequently Asked Questions
1. What is the projected Compound Annual Growth Rate (CAGR) of the Elastomeric Pump Industry?
The projected CAGR is approximately 4.95%.
2. Which companies are prominent players in the Elastomeric Pump Industry?
Key companies in the market include Daiken Medical Co Ltd, Woo Young Medical Co, Werfenlife SA (LeVenton SAU), Nipro Corporation, Epic Medical Pte Ltd, Ambu A/s, Smiths Medical Inc (Smiths Group), B Braun Melsungen AG, Baxter International Inc, Avanos Medical Inc.
3. What are the main segments of the Elastomeric Pump Industry?
The market segments include Product Type, Application, End User.
4. Can you provide details about the market size?
The market size is estimated to be USD 769.03 Million as of 2022.
5. What are some drivers contributing to market growth?
Advancements in Device Technologies and Advantages of the Elastomeric Pumps; Growing Burden of Chronic Diseases.
6. What are the notable trends driving market growth?
Chemotherapy Segment Expects to Register a High CAGR During the Forecast Period.
7. Are there any restraints impacting market growth?
Safety Issues and Disadvantages Associated with the Pumps; High Cost in Long-Term Use and Strict Regulations.
8. Can you provide examples of recent developments in the market?
In March 2022, Shanghai MicroPort Lifesciences Co., Ltd. received marketing approval from China's National Medical Products Administration (NMPA) for its independently developed new AutoEx Chemotherapy Infusion Pump (AutoEx).
9. What pricing options are available for accessing the report?
Pricing options include single-user, multi-user, and enterprise licenses priced at USD 4750, USD 5250, and USD 8750 respectively.
10. Is the market size provided in terms of value or volume?
The market size is provided in terms of value, measured in Million and volume, measured in K Unit.
11. Are there any specific market keywords associated with the report?
Yes, the market keyword associated with the report is "Elastomeric Pump Industry," which aids in identifying and referencing the specific market segment covered.
12. How do I determine which pricing option suits my needs best?
The pricing options vary based on user requirements and access needs. Individual users may opt for single-user licenses, while businesses requiring broader access may choose multi-user or enterprise licenses for cost-effective access to the report.
13. Are there any additional resources or data provided in the Elastomeric Pump Industry report?
While the report offers comprehensive insights, it's advisable to review the specific contents or supplementary materials provided to ascertain if additional resources or data are available.
14. How can I stay updated on further developments or reports in the Elastomeric Pump Industry?
To stay informed about further developments, trends, and reports in the Elastomeric Pump Industry, consider subscribing to industry newsletters, following relevant companies and organizations, or regularly checking reputable industry news sources and publications.
Methodology
Step 1 - Identification of Relevant Samples Size from Population Database


Step 2 - Approaches for Defining Global Market Size (Value, Volume* & Price*)

Note*: In applicable scenarios
Step 3 - Data Sources
Primary Research
- Web Analytics
- Survey Reports
- Research Institute
- Latest Research Reports
- Opinion Leaders
Secondary Research
- Annual Reports
- White Paper
- Latest Press Release
- Industry Association
- Paid Database
- Investor Presentations

Step 4 - Data Triangulation
Involves using different sources of information in order to increase the validity of a study
These sources are likely to be stakeholders in a program - participants, other researchers, program staff, other community members, and so on.
Then we put all data in single framework & apply various statistical tools to find out the dynamic on the market.
During the analysis stage, feedback from the stakeholder groups would be compared to determine areas of agreement as well as areas of divergence
