

Key Insights
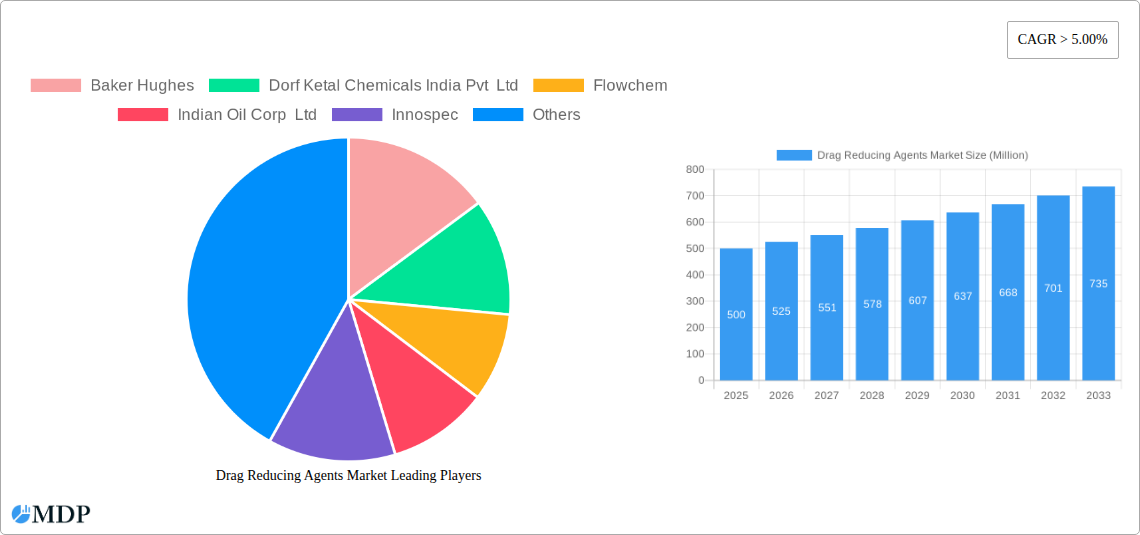
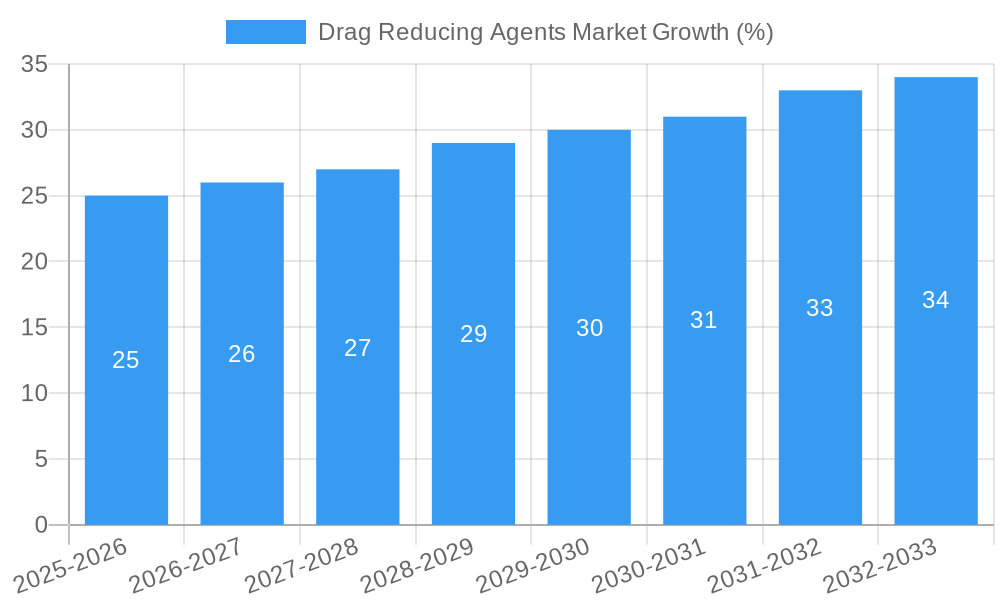
The Drag Reducing Agents (DRA) market is experiencing robust growth, driven by increasing demand from the oil and gas industry, particularly in enhanced oil recovery (EOR) operations. The market's Compound Annual Growth Rate (CAGR) exceeding 5% from 2019 to 2024 indicates significant expansion. This growth is fueled by the need to reduce pipeline friction, optimize energy efficiency, and minimize transportation costs associated with crude oil and other viscous fluids. Furthermore, ongoing technological advancements in DRA formulations, leading to improved performance and environmental compatibility, contribute significantly to market expansion. Key players like Baker Hughes, Dorf Ketal Chemicals India Pvt Ltd, and Flowchem are actively investing in research and development, introducing innovative DRA solutions tailored to specific applications and geographical conditions. The market segmentation likely includes types of DRA (e.g., polymeric, surfactant-based), application areas (e.g., pipelines, EOR), and geographical regions. The increasing adoption of DRA in unconventional oil and gas extraction, along with stringent environmental regulations promoting efficient resource utilization, are likely to propel the market further.
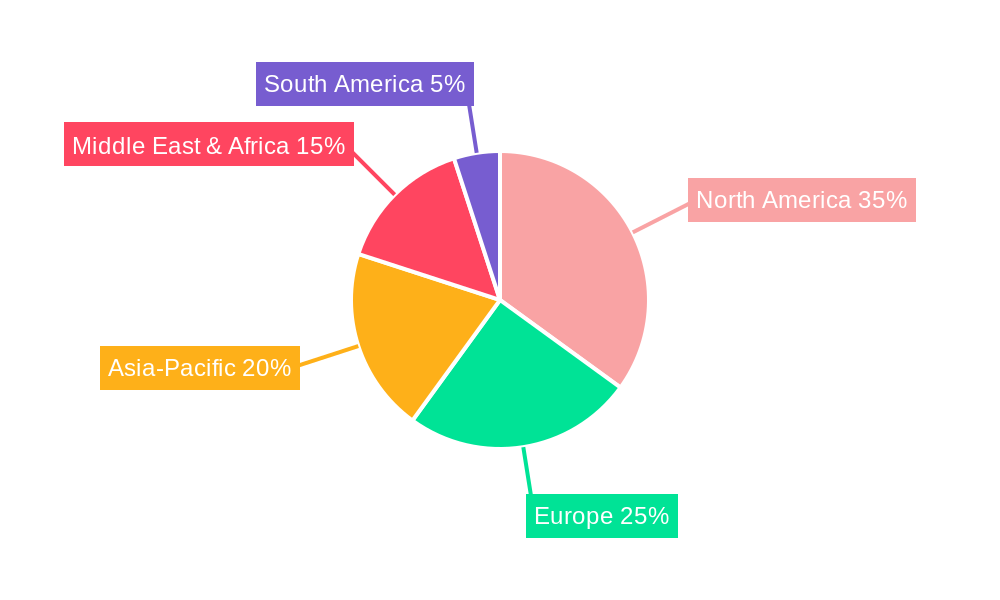
The forecast period of 2025-2033 suggests continued market growth, potentially exceeding the observed historical rate due to emerging markets adopting DRA technology and expansions in existing applications. However, restraints such as price volatility of raw materials and the potential for DRA incompatibility with certain pipeline materials could temper growth. Market players are actively focusing on strategies to mitigate these challenges through sustainable sourcing and customized product development. The regional distribution of the market is likely geographically diverse, with North America and regions with significant oil and gas production activities demonstrating higher market penetration. The competitive landscape is characterized by a blend of established multinational corporations and specialized chemical manufacturers. The market's future hinges on sustained exploration and production activities in the oil and gas sector, continued innovation in DRA technology, and favorable regulatory frameworks.
Drag Reducing Agents Market: A Comprehensive Report (2019-2033)
This in-depth report provides a comprehensive analysis of the Drag Reducing Agents (DRA) market, offering invaluable insights for industry stakeholders, investors, and researchers. Covering the period 2019-2033, with a base year of 2025 and a forecast period of 2025-2033, this report unveils the market dynamics, trends, and future prospects of this crucial sector. The global market size is predicted to reach xx Million by 2033, exhibiting a compelling CAGR of xx% during the forecast period.
Drag Reducing Agents Market Market Dynamics & Concentration
The Drag Reducing Agents market exhibits a moderately concentrated landscape, with several key players vying for market share. Market concentration is influenced by factors such as technological advancements, regulatory compliance, and the prevalence of mergers and acquisitions (M&A). Over the historical period (2019-2024), we observed approximately xx M&A deals, indicating a moderately active consolidation phase. While precise market share data for individual companies remains proprietary, the top five players are estimated to hold approximately xx% of the market. Innovation is a significant driver, with companies continuously developing new DRA formulations to enhance efficiency and address evolving industry needs. Regulatory frameworks, particularly concerning environmental impact and safety, significantly shape market dynamics. The presence of substitute products, although limited, necessitates continuous innovation and cost optimization strategies for leading players. End-user trends, predominantly in the oil & gas and chemical processing industries, are also key drivers influencing market demand.
- Market Concentration: Moderately concentrated, with top 5 players holding ~xx% market share.
- Innovation Drivers: Continuous development of enhanced DRA formulations.
- Regulatory Frameworks: Stringent environmental and safety regulations.
- Product Substitutes: Limited but exert pressure on pricing and innovation.
- End-User Trends: Driven by oil & gas and chemical processing industries' demands.
- M&A Activities: Approximately xx deals during 2019-2024.
Drag Reducing Agents Market Industry Trends & Analysis
The Drag Reducing Agents market is experiencing robust growth, propelled by several key factors. The increasing demand for efficient fluid transportation in various industries, particularly oil & gas, is a significant driver. Technological advancements, such as the development of high-performance DRA formulations with enhanced drag reduction capabilities, further fuel market expansion. Consumer preference for cost-effective and environmentally friendly solutions is also influencing market trends. The competitive landscape is marked by intense rivalry, with companies focusing on innovation, strategic partnerships, and M&A activities to gain a competitive edge. The market penetration rate of DRA in various applications is steadily increasing, indicating strong future growth potential. The global market is anticipated to reach xx Million by 2033, reflecting a significant expansion.
Leading Markets & Segments in Drag Reducing Agents Market
The North American region currently holds a dominant position in the global Drag Reducing Agents market, driven by robust oil & gas activities and a strong emphasis on infrastructure development. This dominance is attributed to several factors:
- Robust Oil & Gas Industry: High demand for efficient pipeline transportation.
- Favorable Regulatory Environment: Supportive policies promoting technological advancement.
- Advanced Infrastructure: Existing pipeline networks requiring efficient fluid management.
Other key regions such as Europe and Asia-Pacific are also experiencing significant growth, although at a comparatively slower pace. The oil & gas segment currently constitutes the largest market share, owing to the substantial volume of fluids transported across pipelines globally. However, other segments, such as the chemical processing industry, are also demonstrating promising growth potential. Government initiatives focusing on infrastructure development and energy efficiency further contribute to the overall market growth in these regions.
Drag Reducing Agents Market Product Developments
Recent product developments in the DRA market have focused on enhancing drag reduction efficiency, improving environmental compatibility, and broadening applications. New formulations with improved stability and performance at various temperatures and pressures are emerging. There is also an increasing focus on bio-based and biodegradable DRA options to address environmental concerns. These advancements are extending the applicability of DRAs to new sectors like water management and industrial fluids. This focus on sustainability and enhanced performance fuels the market's continued expansion.
Key Drivers of Drag Reducing Agents Market Growth
The growth of the Drag Reducing Agents market is fueled by several factors:
- Increasing Demand for Efficient Fluid Transportation: The oil & gas industry's reliance on pipelines drives significant demand.
- Technological Advancements: Development of high-performance, environmentally friendly DRAs.
- Stringent Environmental Regulations: Driving adoption of eco-friendly DRA solutions.
- Infrastructure Development: Expansion of pipeline networks globally.
These factors collectively contribute to the strong and sustained growth trajectory of the DRA market.
Challenges in the Drag Reducing Agents Market Market
The Drag Reducing Agents market faces several challenges:
- Fluctuating Crude Oil Prices: Impacting investment decisions in the oil & gas sector.
- Supply Chain Disruptions: Affecting the availability of raw materials and manufacturing capacity.
- Intense Competition: Leading to price pressures and margin erosion. This competition, combined with the fluctuating oil and gas sector, can result in a -xx% reduction in projected market growth during periods of instability.
Emerging Opportunities in Drag Reducing Agents Market
Emerging opportunities abound in the Drag Reducing Agents market. The increasing adoption of subsea applications, driven by advancements in underwater storage and injection technologies (as demonstrated by LiquidPower Specialty Products' partnership), presents a lucrative avenue for growth. The development of biodegradable and sustainable DRAs addresses environmental concerns, opening new market segments. Strategic partnerships and collaborations between DRA manufacturers and end-users will further accelerate market expansion.
Leading Players in the Drag Reducing Agents Market Sector
- Baker Hughes [Baker Hughes]
- Dorf Ketal Chemicals India Pvt Ltd
- Flowchem
- Indian Oil Corp Ltd
- Innospec
- Jiangyin Huaheng Auxiliary Co Ltd
- LiquidPower Specialty Products Inc [LiquidPower Specialty Products Inc]
- NuGenTec
- Oil Flux Americas
- The Zoranoc Oilfield Chemical
Key Milestones in Drag Reducing Agents Market Industry
- October 2021: LiquidPower Specialty Products Inc. (LSPI) partnered with Safe Marine Transfer, LLC (SMT) to supply DRAs for subsea applications, boosting subsea production efficiency.
- August 2022: Baker Hughes' acquisition of Quest Integrity strengthens its pipeline inspection capabilities, indirectly boosting DRA demand for pipeline maintenance and optimization.
Strategic Outlook for Drag Reducing Agents Market Market
The Drag Reducing Agents market is poised for continued growth, driven by technological innovation, expanding applications, and a growing focus on sustainability. Strategic partnerships, geographic expansion, and the development of novel DRA formulations will be key success factors for companies operating in this dynamic market. The increasing adoption in subsea applications and bio-based solutions presents significant opportunities for future market expansion.
Drag Reducing Agents Market Segmentation
-
1. Application
- 1.1. Low- and Medium-phase Crude Oil
- 1.2. Heavy/Asphaltic Crude
- 1.3. Multiphase Fluid
- 1.4. Refined Products
- 1.5. Other Applications
Drag Reducing Agents Market Segmentation By Geography
-
1. Asia Pacific
- 1.1. China
- 1.2. India
- 1.3. Japan
- 1.4. South Korea
- 1.5. Rest of Asia Pacific
-
2. North America
- 2.1. United States
- 2.2. Canada
- 2.3. Mexico
-
3. Europe
- 3.1. Germany
- 3.2. United Kingdom
- 3.3. France
- 3.4. Italy
- 3.5. Rest of Europe
-
4. South America
- 4.1. Brazil
- 4.2. Argentina
- 4.3. Rest of South America
-
5. Middle East and Africa
- 5.1. South Africa
- 5.2. Saudi Arabia
- 5.3. Rest of Middle East and Africa
Drag Reducing Agents Market REPORT HIGHLIGHTS
| Aspects | Details |
|---|---|
| Study Period | 2019-2033 |
| Base Year | 2024 |
| Estimated Year | 2025 |
| Forecast Period | 2025-2033 |
| Historical Period | 2019-2024 |
| Growth Rate | CAGR of > 5.00% from 2019-2033 |
| Segmentation |
|
Table of Contents
- 1. Introduction
- 1.1. Research Scope
- 1.2. Market Segmentation
- 1.3. Research Methodology
- 1.4. Definitions and Assumptions
- 2. Executive Summary
- 2.1. Introduction
- 3. Market Dynamics
- 3.1. Introduction
- 3.2. Market Drivers
- 3.2.1. Increasing Demand from Refineries; Other Drivers
- 3.3. Market Restrains
- 3.3.1. Increasing Demand from Refineries; Other Drivers
- 3.4. Market Trends
- 3.4.1. Crude Oil has a Substantial Market Share
- 4. Market Factor Analysis
- 4.1. Porters Five Forces
- 4.2. Supply/Value Chain
- 4.3. PESTEL analysis
- 4.4. Market Entropy
- 4.5. Patent/Trademark Analysis
- 5. Global Drag Reducing Agents Market Analysis, Insights and Forecast, 2019-2031
- 5.1. Market Analysis, Insights and Forecast - by Application
- 5.1.1. Low- and Medium-phase Crude Oil
- 5.1.2. Heavy/Asphaltic Crude
- 5.1.3. Multiphase Fluid
- 5.1.4. Refined Products
- 5.1.5. Other Applications
- 5.2. Market Analysis, Insights and Forecast - by Region
- 5.2.1. Asia Pacific
- 5.2.2. North America
- 5.2.3. Europe
- 5.2.4. South America
- 5.2.5. Middle East and Africa
- 5.1. Market Analysis, Insights and Forecast - by Application
- 6. Asia Pacific Drag Reducing Agents Market Analysis, Insights and Forecast, 2019-2031
- 6.1. Market Analysis, Insights and Forecast - by Application
- 6.1.1. Low- and Medium-phase Crude Oil
- 6.1.2. Heavy/Asphaltic Crude
- 6.1.3. Multiphase Fluid
- 6.1.4. Refined Products
- 6.1.5. Other Applications
- 6.1. Market Analysis, Insights and Forecast - by Application
- 7. North America Drag Reducing Agents Market Analysis, Insights and Forecast, 2019-2031
- 7.1. Market Analysis, Insights and Forecast - by Application
- 7.1.1. Low- and Medium-phase Crude Oil
- 7.1.2. Heavy/Asphaltic Crude
- 7.1.3. Multiphase Fluid
- 7.1.4. Refined Products
- 7.1.5. Other Applications
- 7.1. Market Analysis, Insights and Forecast - by Application
- 8. Europe Drag Reducing Agents Market Analysis, Insights and Forecast, 2019-2031
- 8.1. Market Analysis, Insights and Forecast - by Application
- 8.1.1. Low- and Medium-phase Crude Oil
- 8.1.2. Heavy/Asphaltic Crude
- 8.1.3. Multiphase Fluid
- 8.1.4. Refined Products
- 8.1.5. Other Applications
- 8.1. Market Analysis, Insights and Forecast - by Application
- 9. South America Drag Reducing Agents Market Analysis, Insights and Forecast, 2019-2031
- 9.1. Market Analysis, Insights and Forecast - by Application
- 9.1.1. Low- and Medium-phase Crude Oil
- 9.1.2. Heavy/Asphaltic Crude
- 9.1.3. Multiphase Fluid
- 9.1.4. Refined Products
- 9.1.5. Other Applications
- 9.1. Market Analysis, Insights and Forecast - by Application
- 10. Middle East and Africa Drag Reducing Agents Market Analysis, Insights and Forecast, 2019-2031
- 10.1. Market Analysis, Insights and Forecast - by Application
- 10.1.1. Low- and Medium-phase Crude Oil
- 10.1.2. Heavy/Asphaltic Crude
- 10.1.3. Multiphase Fluid
- 10.1.4. Refined Products
- 10.1.5. Other Applications
- 10.1. Market Analysis, Insights and Forecast - by Application
- 11. Competitive Analysis
- 11.1. Global Market Share Analysis 2024
- 11.2. Company Profiles
- 11.2.1 Baker Hughes
- 11.2.1.1. Overview
- 11.2.1.2. Products
- 11.2.1.3. SWOT Analysis
- 11.2.1.4. Recent Developments
- 11.2.1.5. Financials (Based on Availability)
- 11.2.2 Dorf Ketal Chemicals India Pvt Ltd
- 11.2.2.1. Overview
- 11.2.2.2. Products
- 11.2.2.3. SWOT Analysis
- 11.2.2.4. Recent Developments
- 11.2.2.5. Financials (Based on Availability)
- 11.2.3 Flowchem
- 11.2.3.1. Overview
- 11.2.3.2. Products
- 11.2.3.3. SWOT Analysis
- 11.2.3.4. Recent Developments
- 11.2.3.5. Financials (Based on Availability)
- 11.2.4 Indian Oil Corp Ltd
- 11.2.4.1. Overview
- 11.2.4.2. Products
- 11.2.4.3. SWOT Analysis
- 11.2.4.4. Recent Developments
- 11.2.4.5. Financials (Based on Availability)
- 11.2.5 Innospec
- 11.2.5.1. Overview
- 11.2.5.2. Products
- 11.2.5.3. SWOT Analysis
- 11.2.5.4. Recent Developments
- 11.2.5.5. Financials (Based on Availability)
- 11.2.6 Jiangyin Huaheng Auxiliary Co Ltd
- 11.2.6.1. Overview
- 11.2.6.2. Products
- 11.2.6.3. SWOT Analysis
- 11.2.6.4. Recent Developments
- 11.2.6.5. Financials (Based on Availability)
- 11.2.7 LiquidPower Specialty Products Inc
- 11.2.7.1. Overview
- 11.2.7.2. Products
- 11.2.7.3. SWOT Analysis
- 11.2.7.4. Recent Developments
- 11.2.7.5. Financials (Based on Availability)
- 11.2.8 NuGenTec
- 11.2.8.1. Overview
- 11.2.8.2. Products
- 11.2.8.3. SWOT Analysis
- 11.2.8.4. Recent Developments
- 11.2.8.5. Financials (Based on Availability)
- 11.2.9 Oil Flux Americas
- 11.2.9.1. Overview
- 11.2.9.2. Products
- 11.2.9.3. SWOT Analysis
- 11.2.9.4. Recent Developments
- 11.2.9.5. Financials (Based on Availability)
- 11.2.10 The Zoranoc Oilfield Chemical*List Not Exhaustive
- 11.2.10.1. Overview
- 11.2.10.2. Products
- 11.2.10.3. SWOT Analysis
- 11.2.10.4. Recent Developments
- 11.2.10.5. Financials (Based on Availability)
- 11.2.1 Baker Hughes
List of Figures
- Figure 1: Global Drag Reducing Agents Market Revenue Breakdown (Million, %) by Region 2024 & 2032
- Figure 2: Asia Pacific Drag Reducing Agents Market Revenue (Million), by Application 2024 & 2032
- Figure 3: Asia Pacific Drag Reducing Agents Market Revenue Share (%), by Application 2024 & 2032
- Figure 4: Asia Pacific Drag Reducing Agents Market Revenue (Million), by Country 2024 & 2032
- Figure 5: Asia Pacific Drag Reducing Agents Market Revenue Share (%), by Country 2024 & 2032
- Figure 6: North America Drag Reducing Agents Market Revenue (Million), by Application 2024 & 2032
- Figure 7: North America Drag Reducing Agents Market Revenue Share (%), by Application 2024 & 2032
- Figure 8: North America Drag Reducing Agents Market Revenue (Million), by Country 2024 & 2032
- Figure 9: North America Drag Reducing Agents Market Revenue Share (%), by Country 2024 & 2032
- Figure 10: Europe Drag Reducing Agents Market Revenue (Million), by Application 2024 & 2032
- Figure 11: Europe Drag Reducing Agents Market Revenue Share (%), by Application 2024 & 2032
- Figure 12: Europe Drag Reducing Agents Market Revenue (Million), by Country 2024 & 2032
- Figure 13: Europe Drag Reducing Agents Market Revenue Share (%), by Country 2024 & 2032
- Figure 14: South America Drag Reducing Agents Market Revenue (Million), by Application 2024 & 2032
- Figure 15: South America Drag Reducing Agents Market Revenue Share (%), by Application 2024 & 2032
- Figure 16: South America Drag Reducing Agents Market Revenue (Million), by Country 2024 & 2032
- Figure 17: South America Drag Reducing Agents Market Revenue Share (%), by Country 2024 & 2032
- Figure 18: Middle East and Africa Drag Reducing Agents Market Revenue (Million), by Application 2024 & 2032
- Figure 19: Middle East and Africa Drag Reducing Agents Market Revenue Share (%), by Application 2024 & 2032
- Figure 20: Middle East and Africa Drag Reducing Agents Market Revenue (Million), by Country 2024 & 2032
- Figure 21: Middle East and Africa Drag Reducing Agents Market Revenue Share (%), by Country 2024 & 2032
List of Tables
- Table 1: Global Drag Reducing Agents Market Revenue Million Forecast, by Region 2019 & 2032
- Table 2: Global Drag Reducing Agents Market Revenue Million Forecast, by Application 2019 & 2032
- Table 3: Global Drag Reducing Agents Market Revenue Million Forecast, by Region 2019 & 2032
- Table 4: Global Drag Reducing Agents Market Revenue Million Forecast, by Application 2019 & 2032
- Table 5: Global Drag Reducing Agents Market Revenue Million Forecast, by Country 2019 & 2032
- Table 6: China Drag Reducing Agents Market Revenue (Million) Forecast, by Application 2019 & 2032
- Table 7: India Drag Reducing Agents Market Revenue (Million) Forecast, by Application 2019 & 2032
- Table 8: Japan Drag Reducing Agents Market Revenue (Million) Forecast, by Application 2019 & 2032
- Table 9: South Korea Drag Reducing Agents Market Revenue (Million) Forecast, by Application 2019 & 2032
- Table 10: Rest of Asia Pacific Drag Reducing Agents Market Revenue (Million) Forecast, by Application 2019 & 2032
- Table 11: Global Drag Reducing Agents Market Revenue Million Forecast, by Application 2019 & 2032
- Table 12: Global Drag Reducing Agents Market Revenue Million Forecast, by Country 2019 & 2032
- Table 13: United States Drag Reducing Agents Market Revenue (Million) Forecast, by Application 2019 & 2032
- Table 14: Canada Drag Reducing Agents Market Revenue (Million) Forecast, by Application 2019 & 2032
- Table 15: Mexico Drag Reducing Agents Market Revenue (Million) Forecast, by Application 2019 & 2032
- Table 16: Global Drag Reducing Agents Market Revenue Million Forecast, by Application 2019 & 2032
- Table 17: Global Drag Reducing Agents Market Revenue Million Forecast, by Country 2019 & 2032
- Table 18: Germany Drag Reducing Agents Market Revenue (Million) Forecast, by Application 2019 & 2032
- Table 19: United Kingdom Drag Reducing Agents Market Revenue (Million) Forecast, by Application 2019 & 2032
- Table 20: France Drag Reducing Agents Market Revenue (Million) Forecast, by Application 2019 & 2032
- Table 21: Italy Drag Reducing Agents Market Revenue (Million) Forecast, by Application 2019 & 2032
- Table 22: Rest of Europe Drag Reducing Agents Market Revenue (Million) Forecast, by Application 2019 & 2032
- Table 23: Global Drag Reducing Agents Market Revenue Million Forecast, by Application 2019 & 2032
- Table 24: Global Drag Reducing Agents Market Revenue Million Forecast, by Country 2019 & 2032
- Table 25: Brazil Drag Reducing Agents Market Revenue (Million) Forecast, by Application 2019 & 2032
- Table 26: Argentina Drag Reducing Agents Market Revenue (Million) Forecast, by Application 2019 & 2032
- Table 27: Rest of South America Drag Reducing Agents Market Revenue (Million) Forecast, by Application 2019 & 2032
- Table 28: Global Drag Reducing Agents Market Revenue Million Forecast, by Application 2019 & 2032
- Table 29: Global Drag Reducing Agents Market Revenue Million Forecast, by Country 2019 & 2032
- Table 30: South Africa Drag Reducing Agents Market Revenue (Million) Forecast, by Application 2019 & 2032
- Table 31: Saudi Arabia Drag Reducing Agents Market Revenue (Million) Forecast, by Application 2019 & 2032
- Table 32: Rest of Middle East and Africa Drag Reducing Agents Market Revenue (Million) Forecast, by Application 2019 & 2032
Frequently Asked Questions
1. What is the projected Compound Annual Growth Rate (CAGR) of the Drag Reducing Agents Market?
The projected CAGR is approximately > 5.00%.
2. Which companies are prominent players in the Drag Reducing Agents Market?
Key companies in the market include Baker Hughes, Dorf Ketal Chemicals India Pvt Ltd, Flowchem, Indian Oil Corp Ltd, Innospec, Jiangyin Huaheng Auxiliary Co Ltd, LiquidPower Specialty Products Inc, NuGenTec, Oil Flux Americas, The Zoranoc Oilfield Chemical*List Not Exhaustive.
3. What are the main segments of the Drag Reducing Agents Market?
The market segments include Application.
4. Can you provide details about the market size?
The market size is estimated to be USD XX Million as of 2022.
5. What are some drivers contributing to market growth?
Increasing Demand from Refineries; Other Drivers.
6. What are the notable trends driving market growth?
Crude Oil has a Substantial Market Share.
7. Are there any restraints impacting market growth?
Increasing Demand from Refineries; Other Drivers.
8. Can you provide examples of recent developments in the market?
August 2022 : Baker Hughes announced an agreement to acquire Quest Integrity a subsidiary of Team, Inc, in the development and delivery of technology-enabled asset inspection and reliability management solutions for the pipeline, refinery, petrochemical, and power generation industries. Baker Hughes pipeline inspection services identify, describe, locate, and size abnormalities in a pipeline's wall that may need the use of drag reducers to decrease frictional pressure drops in a pipeline or conduit during fluid flow.
9. What pricing options are available for accessing the report?
Pricing options include single-user, multi-user, and enterprise licenses priced at USD 4750, USD 5250, and USD 8750 respectively.
10. Is the market size provided in terms of value or volume?
The market size is provided in terms of value, measured in Million.
11. Are there any specific market keywords associated with the report?
Yes, the market keyword associated with the report is "Drag Reducing Agents Market," which aids in identifying and referencing the specific market segment covered.
12. How do I determine which pricing option suits my needs best?
The pricing options vary based on user requirements and access needs. Individual users may opt for single-user licenses, while businesses requiring broader access may choose multi-user or enterprise licenses for cost-effective access to the report.
13. Are there any additional resources or data provided in the Drag Reducing Agents Market report?
While the report offers comprehensive insights, it's advisable to review the specific contents or supplementary materials provided to ascertain if additional resources or data are available.
14. How can I stay updated on further developments or reports in the Drag Reducing Agents Market?
To stay informed about further developments, trends, and reports in the Drag Reducing Agents Market, consider subscribing to industry newsletters, following relevant companies and organizations, or regularly checking reputable industry news sources and publications.
Methodology
Step 1 - Identification of Relevant Samples Size from Population Database


Step 2 - Approaches for Defining Global Market Size (Value, Volume* & Price*)

Note*: In applicable scenarios
Step 3 - Data Sources
Primary Research
- Web Analytics
- Survey Reports
- Research Institute
- Latest Research Reports
- Opinion Leaders
Secondary Research
- Annual Reports
- White Paper
- Latest Press Release
- Industry Association
- Paid Database
- Investor Presentations

Step 4 - Data Triangulation
Involves using different sources of information in order to increase the validity of a study
These sources are likely to be stakeholders in a program - participants, other researchers, program staff, other community members, and so on.
Then we put all data in single framework & apply various statistical tools to find out the dynamic on the market.
During the analysis stage, feedback from the stakeholder groups would be compared to determine areas of agreement as well as areas of divergence
