

Key Insights
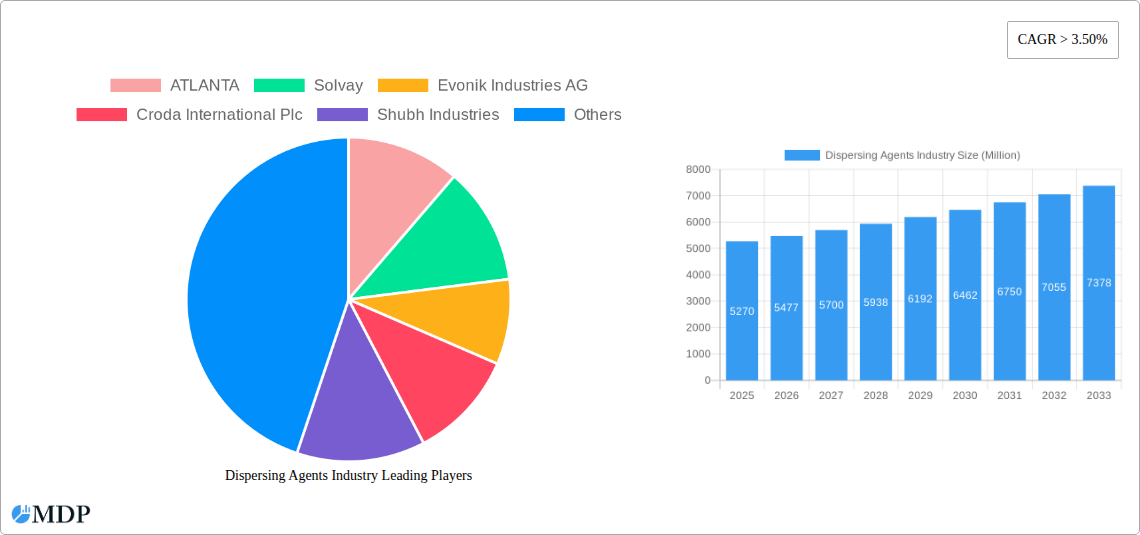
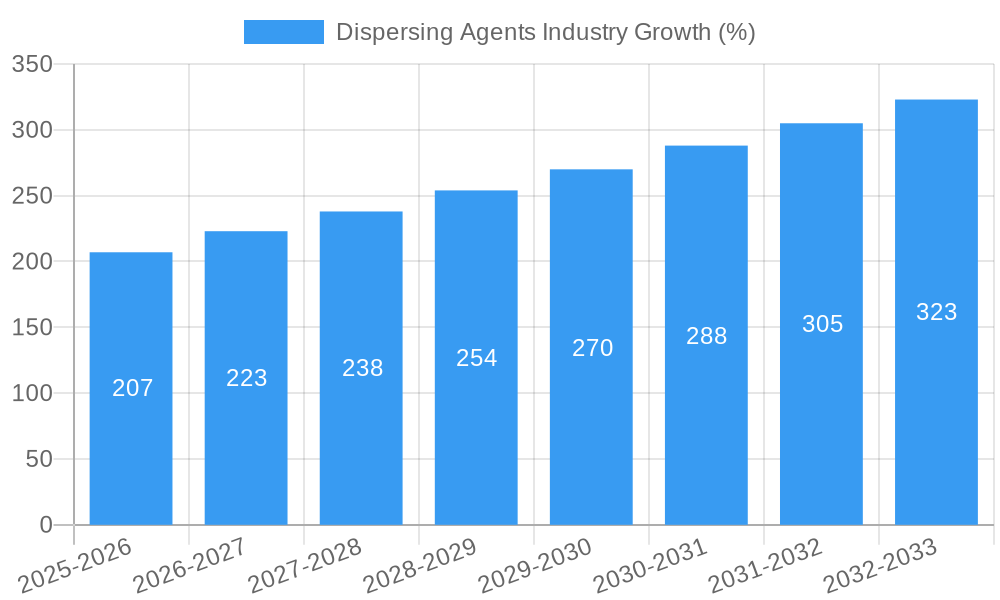
The global dispersing agents market, valued at $5.27 billion in 2025, is projected to experience robust growth, driven by a compound annual growth rate (CAGR) exceeding 3.50% from 2025 to 2033. This expansion is fueled by several key factors. The burgeoning construction industry, particularly in developing economies, necessitates high-performance dispersing agents for improved concrete mixability and workability. Similarly, the paints and coatings sector relies heavily on these agents to enhance pigment dispersion, leading to improved color consistency and film quality. The growing demand for environmentally friendly waterborne dispersing agents further contributes to market growth, as manufacturers prioritize sustainability and reduced VOC emissions. Increased adoption in oil and gas applications for enhanced drilling fluid performance and in the textile industry for improved dye dispersion also contribute to market expansion. Competition among established players like BASF, Evonik, and Clariant, alongside the emergence of regional players, fosters innovation and drives price competitiveness.
However, market growth faces certain restraints. Fluctuations in raw material prices, particularly those of polymers and resins, can impact production costs and profitability. Stringent environmental regulations regarding the use of certain solvents in dispersing agents necessitate the development and adoption of more eco-friendly alternatives, requiring significant research and development investments. Furthermore, economic downturns can significantly affect demand, particularly in construction and related industries. Despite these challenges, the overall market outlook remains positive, driven by the continuous demand for improved material performance across various applications. The segmentation by end-user industry (paints and coatings holding a significant share) and formation type (waterborne gaining increasing traction due to environmental concerns) provides granular insights into market dynamics and future growth potential.
Dispersing Agents Industry Market Report: 2019-2033
This comprehensive report provides a detailed analysis of the global dispersing agents market, encompassing market dynamics, leading players, key trends, and future growth opportunities. Valued at $XX Million in 2025, the market is projected to reach $XX Million by 2033, exhibiting a CAGR of XX% during the forecast period (2025-2033). The study period covers 2019-2033, with 2025 serving as the base and estimated year. This in-depth analysis is crucial for industry stakeholders, investors, and businesses seeking to navigate this dynamic market landscape.
Dispersing Agents Industry Market Dynamics & Concentration
The global dispersing agents market is characterized by a moderately concentrated landscape with several major players holding significant market share. ATLANTA, Solvay, Evonik Industries AG, and BASF SE are among the leading companies, collectively accounting for an estimated XX% of the market in 2025. Market concentration is influenced by factors such as economies of scale, technological advancements, and extensive distribution networks.
Innovation is a key driver, with companies constantly developing new dispersing agents with improved performance characteristics, such as enhanced stability, reduced viscosity, and improved environmental friendliness. Stringent environmental regulations, particularly regarding volatile organic compounds (VOCs), are shaping product development, pushing manufacturers towards eco-friendly formulations. The market also witnesses considerable M&A activity, with XX deals recorded between 2019 and 2024. These activities aim to expand product portfolios, access new markets, and enhance technological capabilities. Product substitution, primarily driven by advancements in nanotechnology and bio-based materials, presents both opportunities and challenges for established players. End-user trends, such as the growing demand for sustainable and high-performance coatings in various industries, influence market dynamics.
- Market Share (2025): Top 4 players - XX%
- M&A Deals (2019-2024): XX
- Key Innovation Drivers: Sustainability, Performance Enhancement, Regulatory Compliance.
- Major Substitutes: Nanotechnology-based dispersants, bio-based dispersants
Dispersing Agents Industry Industry Trends & Analysis
The dispersing agents market is experiencing robust growth, driven by several key factors. The increasing demand for high-performance coatings in diverse end-user industries, such as paints and coatings, construction, and oil and gas, fuels market expansion. Technological advancements, including the development of novel dispersing agents with enhanced properties, contribute to market growth. Consumer preference for eco-friendly products is also shaping market trends, leading to increased demand for biodegradable and sustainable options. The competitive landscape is characterized by intense competition, with companies focusing on innovation, cost optimization, and strategic partnerships to gain a competitive edge.
The market exhibits a notable shift towards waterborne dispersing agents due to their low VOC content and environmental benefits. This trend is expected to continue, with waterborne agents capturing an increasing market share during the forecast period. Technological disruptions, including the emergence of nanotechnology-based dispersants and bio-based alternatives, are reshaping the market dynamics. The CAGR for the overall market is projected at XX% during the forecast period. Market penetration of sustainable dispersing agents is gradually increasing, with an estimated XX% penetration rate in 2025.
Leading Markets & Segments in Dispersing Agents Industry
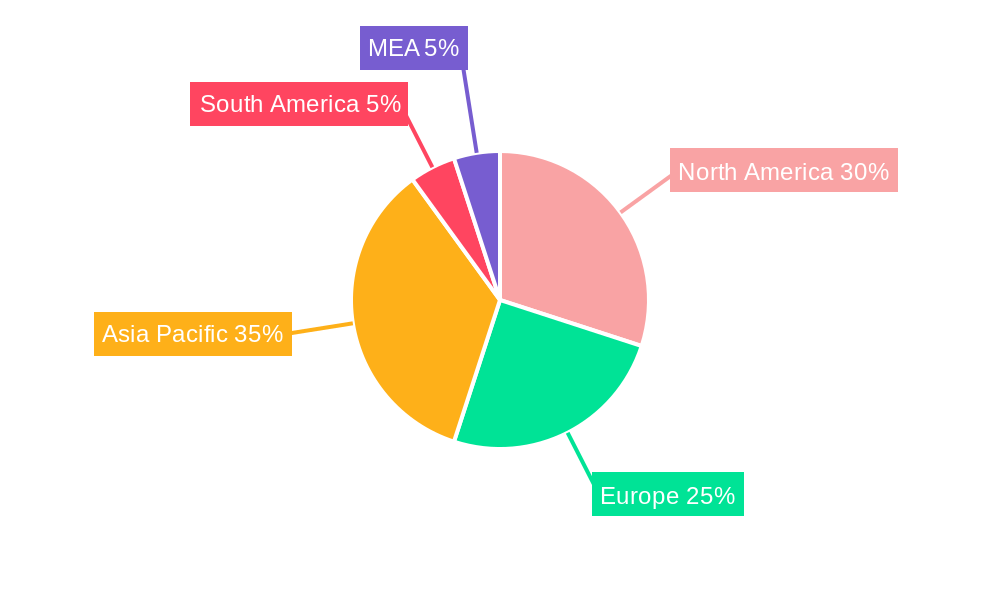
The Paints and Coatings segment is the dominant end-user industry for dispersing agents, accounting for the largest market share (XX%) in 2025. This is attributed to the extensive use of dispersing agents in various paint formulations to enhance pigment dispersion and improve coating properties. Geographically, Asia Pacific is expected to be the leading region, driven by rapid infrastructure development and industrial growth in countries like China and India.
Key Drivers by Segment:
- Paints and Coatings: Growing construction activities, automotive production, and demand for aesthetically pleasing and durable coatings.
- Oil and Gas: Demand for enhanced oil recovery techniques and improved drilling fluids.
- Construction: Rising infrastructure investments and urbanization.
- Pulp and Paper: Increased demand for high-quality paper and improved paper processing efficiency.
- Textile: Growing demand for high-performance textiles and functional fabrics.
- Other End-user Industries (Pharmaceutical, Agriculture, Detergent): Increasing demand for specialized formulations in diverse applications.
Dominance Analysis:
The dominance of the Paints and Coatings segment is primarily due to its large size and significant application of dispersing agents. The Asia Pacific region's leading position stems from its high rate of industrialization and significant investments in infrastructure development. Waterborne dispersing agents hold a significant market share due to their environmental benefits and growing regulatory pressures.
Dispersing Agents Industry Product Developments
Recent product innovations focus on enhancing sustainability and performance. Companies are actively developing biodegradable and readily dispersible agents that meet stringent environmental regulations. These innovations offer advantages such as improved pigment dispersion, reduced viscosity, and enhanced coating properties. The focus is shifting towards specialized products tailored to specific end-user applications, offering improved performance and cost-effectiveness. Technological trends like nanotechnology are enabling the development of high-performance dispersants with exceptional properties.
Key Drivers of Dispersing Agents Industry Growth
The dispersing agents market is propelled by several key factors:
- Technological Advancements: Development of eco-friendly and high-performance dispersing agents.
- Economic Growth: Expanding construction, automotive, and industrial sectors drive demand.
- Stringent Regulations: Increasing environmental regulations promote the adoption of sustainable products. For example, the EU's REACH regulation drives innovation in eco-friendly alternatives.
Challenges in the Dispersing Agents Industry Market
The market faces several challenges:
- Regulatory Hurdles: Stringent environmental regulations increase compliance costs.
- Supply Chain Disruptions: Global supply chain vulnerabilities can impact raw material availability and costs.
- Competitive Pressure: Intense competition requires continuous innovation and cost optimization.
Emerging Opportunities in Dispersing Agents Industry
Several factors offer significant long-term growth opportunities:
The rising demand for sustainable and high-performance products coupled with advancements in nanotechnology and bio-based materials will open new avenues for market expansion. Strategic partnerships and collaborations among key players will facilitate the development of innovative solutions and broader market reach. Furthermore, expanding into new and emerging markets presents lucrative growth prospects.
Leading Players in the Dispersing Agents Industry Sector
- ATLANTA
- Solvay
- Evonik Industries AG
- Croda International Plc
- Shubh Industries
- King Industries Inc
- Kemipex
- Ashland
- BASF SE
- Arkema Group
- ELEMENTS PLC
- Rudolf GmbH
- NICCA CHEMICAL CO LTD
- The Lubrizol Corporation
- CLARIANT
- UNIQCHEM
Key Milestones in Dispersing Agents Industry Industry
- July 2022: Evonik Industries AG launched TEGO Dispers 658, a readily biodegradable dispersing additive enhancing sustainability in pigment and colored coatings production.
- June 2022: CLARIANT launched a universal polymeric dispersing agent for high-quality pigment preparations, applicable to all water-based paint systems.
Strategic Outlook for Dispersing Agents Industry Market
The future of the dispersing agents market is bright, with significant growth potential driven by technological advancements, increasing demand from various end-user industries, and a growing focus on sustainability. Strategic partnerships, acquisitions, and investments in research and development will play a crucial role in shaping the market's future. Companies with a strong focus on innovation and sustainability are well-positioned to capitalize on the growing opportunities in this dynamic market.
Dispersing Agents Industry Segmentation
-
1. Formation Type
- 1.1. Waterborne
- 1.2. Oil-borne
- 1.3. Solvent-borne
-
2. End-user Industry
- 2.1. Paints and Coatings
- 2.2. Oil and Gas
- 2.3. Construction
- 2.4. Pulp and Paper
- 2.5. Textile
- 2.6. Others
Dispersing Agents Industry Segmentation By Geography
-
1. Asia Pacific
- 1.1. China
- 1.2. India
- 1.3. Japan
- 1.4. South Korea
- 1.5. Indonesia
- 1.6. Malaysia
- 1.7. Thailand
- 1.8. Vietnam
- 1.9. Rest of Asia Pacific
-
2. North America
- 2.1. United States
- 2.2. Canada
- 2.3. Mexico
-
3. Europe
- 3.1. Germany
- 3.2. United Kingdom
- 3.3. Italy
- 3.4. France
- 3.5. Spain
- 3.6. Russia
- 3.7. NORDIC Countries
- 3.8. Rest of Europe
-
4. South America
- 4.1. Brazil
- 4.2. Argentina
- 4.3. Colombia
- 4.4. Rest of South America
-
5. Middle East and Africa
- 5.1. Saudi Arabia
- 5.2. South Africa
- 5.3. Qatar
- 5.4. UAE
- 5.5. Egypt
- 5.6. Nigeria
- 5.7. Rest of Middle East and Africa
Dispersing Agents Industry REPORT HIGHLIGHTS
| Aspects | Details |
|---|---|
| Study Period | 2019-2033 |
| Base Year | 2024 |
| Estimated Year | 2025 |
| Forecast Period | 2025-2033 |
| Historical Period | 2019-2024 |
| Growth Rate | CAGR of > 3.50% from 2019-2033 |
| Segmentation |
|
Table of Contents
- 1. Introduction
- 1.1. Research Scope
- 1.2. Market Segmentation
- 1.3. Research Methodology
- 1.4. Definitions and Assumptions
- 2. Executive Summary
- 2.1. Introduction
- 3. Market Dynamics
- 3.1. Introduction
- 3.2. Market Drivers
- 3.2.1. Increasing Demand from the Paints and Coatings Industry; The Increasing Oil Drilling and Exploration Activities; Other Drivers
- 3.3. Market Restrains
- 3.3.1. The Increasing Prices of Raw materials; Other Restraints
- 3.4. Market Trends
- 3.4.1. Increasing demand from the Paints and Coatings Industry
- 4. Market Factor Analysis
- 4.1. Porters Five Forces
- 4.2. Supply/Value Chain
- 4.3. PESTEL analysis
- 4.4. Market Entropy
- 4.5. Patent/Trademark Analysis
- 5. Global Dispersing Agents Industry Analysis, Insights and Forecast, 2019-2031
- 5.1. Market Analysis, Insights and Forecast - by Formation Type
- 5.1.1. Waterborne
- 5.1.2. Oil-borne
- 5.1.3. Solvent-borne
- 5.2. Market Analysis, Insights and Forecast - by End-user Industry
- 5.2.1. Paints and Coatings
- 5.2.2. Oil and Gas
- 5.2.3. Construction
- 5.2.4. Pulp and Paper
- 5.2.5. Textile
- 5.2.6. Others
- 5.3. Market Analysis, Insights and Forecast - by Region
- 5.3.1. Asia Pacific
- 5.3.2. North America
- 5.3.3. Europe
- 5.3.4. South America
- 5.3.5. Middle East and Africa
- 5.1. Market Analysis, Insights and Forecast - by Formation Type
- 6. Asia Pacific Dispersing Agents Industry Analysis, Insights and Forecast, 2019-2031
- 6.1. Market Analysis, Insights and Forecast - by Formation Type
- 6.1.1. Waterborne
- 6.1.2. Oil-borne
- 6.1.3. Solvent-borne
- 6.2. Market Analysis, Insights and Forecast - by End-user Industry
- 6.2.1. Paints and Coatings
- 6.2.2. Oil and Gas
- 6.2.3. Construction
- 6.2.4. Pulp and Paper
- 6.2.5. Textile
- 6.2.6. Others
- 6.1. Market Analysis, Insights and Forecast - by Formation Type
- 7. North America Dispersing Agents Industry Analysis, Insights and Forecast, 2019-2031
- 7.1. Market Analysis, Insights and Forecast - by Formation Type
- 7.1.1. Waterborne
- 7.1.2. Oil-borne
- 7.1.3. Solvent-borne
- 7.2. Market Analysis, Insights and Forecast - by End-user Industry
- 7.2.1. Paints and Coatings
- 7.2.2. Oil and Gas
- 7.2.3. Construction
- 7.2.4. Pulp and Paper
- 7.2.5. Textile
- 7.2.6. Others
- 7.1. Market Analysis, Insights and Forecast - by Formation Type
- 8. Europe Dispersing Agents Industry Analysis, Insights and Forecast, 2019-2031
- 8.1. Market Analysis, Insights and Forecast - by Formation Type
- 8.1.1. Waterborne
- 8.1.2. Oil-borne
- 8.1.3. Solvent-borne
- 8.2. Market Analysis, Insights and Forecast - by End-user Industry
- 8.2.1. Paints and Coatings
- 8.2.2. Oil and Gas
- 8.2.3. Construction
- 8.2.4. Pulp and Paper
- 8.2.5. Textile
- 8.2.6. Others
- 8.1. Market Analysis, Insights and Forecast - by Formation Type
- 9. South America Dispersing Agents Industry Analysis, Insights and Forecast, 2019-2031
- 9.1. Market Analysis, Insights and Forecast - by Formation Type
- 9.1.1. Waterborne
- 9.1.2. Oil-borne
- 9.1.3. Solvent-borne
- 9.2. Market Analysis, Insights and Forecast - by End-user Industry
- 9.2.1. Paints and Coatings
- 9.2.2. Oil and Gas
- 9.2.3. Construction
- 9.2.4. Pulp and Paper
- 9.2.5. Textile
- 9.2.6. Others
- 9.1. Market Analysis, Insights and Forecast - by Formation Type
- 10. Middle East and Africa Dispersing Agents Industry Analysis, Insights and Forecast, 2019-2031
- 10.1. Market Analysis, Insights and Forecast - by Formation Type
- 10.1.1. Waterborne
- 10.1.2. Oil-borne
- 10.1.3. Solvent-borne
- 10.2. Market Analysis, Insights and Forecast - by End-user Industry
- 10.2.1. Paints and Coatings
- 10.2.2. Oil and Gas
- 10.2.3. Construction
- 10.2.4. Pulp and Paper
- 10.2.5. Textile
- 10.2.6. Others
- 10.1. Market Analysis, Insights and Forecast - by Formation Type
- 11. North America Dispersing Agents Industry Analysis, Insights and Forecast, 2019-2031
- 11.1. Market Analysis, Insights and Forecast - By Country/Sub-region
- 11.1.1 United States
- 11.1.2 Canada
- 11.1.3 Mexico
- 12. Europe Dispersing Agents Industry Analysis, Insights and Forecast, 2019-2031
- 12.1. Market Analysis, Insights and Forecast - By Country/Sub-region
- 12.1.1 Germany
- 12.1.2 United Kingdom
- 12.1.3 France
- 12.1.4 Spain
- 12.1.5 Italy
- 12.1.6 Spain
- 12.1.7 Belgium
- 12.1.8 Netherland
- 12.1.9 Nordics
- 12.1.10 Rest of Europe
- 13. Asia Pacific Dispersing Agents Industry Analysis, Insights and Forecast, 2019-2031
- 13.1. Market Analysis, Insights and Forecast - By Country/Sub-region
- 13.1.1 China
- 13.1.2 Japan
- 13.1.3 India
- 13.1.4 South Korea
- 13.1.5 Southeast Asia
- 13.1.6 Australia
- 13.1.7 Indonesia
- 13.1.8 Phillipes
- 13.1.9 Singapore
- 13.1.10 Thailandc
- 13.1.11 Rest of Asia Pacific
- 14. South America Dispersing Agents Industry Analysis, Insights and Forecast, 2019-2031
- 14.1. Market Analysis, Insights and Forecast - By Country/Sub-region
- 14.1.1 Brazil
- 14.1.2 Argentina
- 14.1.3 Peru
- 14.1.4 Chile
- 14.1.5 Colombia
- 14.1.6 Ecuador
- 14.1.7 Venezuela
- 14.1.8 Rest of South America
- 15. North America Dispersing Agents Industry Analysis, Insights and Forecast, 2019-2031
- 15.1. Market Analysis, Insights and Forecast - By Country/Sub-region
- 15.1.1 United States
- 15.1.2 Canada
- 15.1.3 Mexico
- 16. MEA Dispersing Agents Industry Analysis, Insights and Forecast, 2019-2031
- 16.1. Market Analysis, Insights and Forecast - By Country/Sub-region
- 16.1.1 United Arab Emirates
- 16.1.2 Saudi Arabia
- 16.1.3 South Africa
- 16.1.4 Rest of Middle East and Africa
- 17. Competitive Analysis
- 17.1. Global Market Share Analysis 2024
- 17.2. Company Profiles
- 17.2.1 ATLANTA
- 17.2.1.1. Overview
- 17.2.1.2. Products
- 17.2.1.3. SWOT Analysis
- 17.2.1.4. Recent Developments
- 17.2.1.5. Financials (Based on Availability)
- 17.2.2 Solvay
- 17.2.2.1. Overview
- 17.2.2.2. Products
- 17.2.2.3. SWOT Analysis
- 17.2.2.4. Recent Developments
- 17.2.2.5. Financials (Based on Availability)
- 17.2.3 Evonik Industries AG
- 17.2.3.1. Overview
- 17.2.3.2. Products
- 17.2.3.3. SWOT Analysis
- 17.2.3.4. Recent Developments
- 17.2.3.5. Financials (Based on Availability)
- 17.2.4 Croda International Plc
- 17.2.4.1. Overview
- 17.2.4.2. Products
- 17.2.4.3. SWOT Analysis
- 17.2.4.4. Recent Developments
- 17.2.4.5. Financials (Based on Availability)
- 17.2.5 Shubh Industries
- 17.2.5.1. Overview
- 17.2.5.2. Products
- 17.2.5.3. SWOT Analysis
- 17.2.5.4. Recent Developments
- 17.2.5.5. Financials (Based on Availability)
- 17.2.6 King Industries Inc
- 17.2.6.1. Overview
- 17.2.6.2. Products
- 17.2.6.3. SWOT Analysis
- 17.2.6.4. Recent Developments
- 17.2.6.5. Financials (Based on Availability)
- 17.2.7 Kemipex
- 17.2.7.1. Overview
- 17.2.7.2. Products
- 17.2.7.3. SWOT Analysis
- 17.2.7.4. Recent Developments
- 17.2.7.5. Financials (Based on Availability)
- 17.2.8 Ashland
- 17.2.8.1. Overview
- 17.2.8.2. Products
- 17.2.8.3. SWOT Analysis
- 17.2.8.4. Recent Developments
- 17.2.8.5. Financials (Based on Availability)
- 17.2.9 BASF SE
- 17.2.9.1. Overview
- 17.2.9.2. Products
- 17.2.9.3. SWOT Analysis
- 17.2.9.4. Recent Developments
- 17.2.9.5. Financials (Based on Availability)
- 17.2.10 Arkema Group
- 17.2.10.1. Overview
- 17.2.10.2. Products
- 17.2.10.3. SWOT Analysis
- 17.2.10.4. Recent Developments
- 17.2.10.5. Financials (Based on Availability)
- 17.2.11 ELEMENTS PLC
- 17.2.11.1. Overview
- 17.2.11.2. Products
- 17.2.11.3. SWOT Analysis
- 17.2.11.4. Recent Developments
- 17.2.11.5. Financials (Based on Availability)
- 17.2.12 Rudolf GmbH
- 17.2.12.1. Overview
- 17.2.12.2. Products
- 17.2.12.3. SWOT Analysis
- 17.2.12.4. Recent Developments
- 17.2.12.5. Financials (Based on Availability)
- 17.2.13 NICCA CHEMICAL CO LTD
- 17.2.13.1. Overview
- 17.2.13.2. Products
- 17.2.13.3. SWOT Analysis
- 17.2.13.4. Recent Developments
- 17.2.13.5. Financials (Based on Availability)
- 17.2.14 The Lubrizol Corporation
- 17.2.14.1. Overview
- 17.2.14.2. Products
- 17.2.14.3. SWOT Analysis
- 17.2.14.4. Recent Developments
- 17.2.14.5. Financials (Based on Availability)
- 17.2.15 CLARIANT
- 17.2.15.1. Overview
- 17.2.15.2. Products
- 17.2.15.3. SWOT Analysis
- 17.2.15.4. Recent Developments
- 17.2.15.5. Financials (Based on Availability)
- 17.2.16 UNIQCHEM
- 17.2.16.1. Overview
- 17.2.16.2. Products
- 17.2.16.3. SWOT Analysis
- 17.2.16.4. Recent Developments
- 17.2.16.5. Financials (Based on Availability)
- 17.2.1 ATLANTA
List of Figures
- Figure 1: Global Dispersing Agents Industry Revenue Breakdown (Million, %) by Region 2024 & 2032
- Figure 2: Global Dispersing Agents Industry Volume Breakdown (K Tons, %) by Region 2024 & 2032
- Figure 3: North America Dispersing Agents Industry Revenue (Million), by Country 2024 & 2032
- Figure 4: North America Dispersing Agents Industry Volume (K Tons), by Country 2024 & 2032
- Figure 5: North America Dispersing Agents Industry Revenue Share (%), by Country 2024 & 2032
- Figure 6: North America Dispersing Agents Industry Volume Share (%), by Country 2024 & 2032
- Figure 7: Europe Dispersing Agents Industry Revenue (Million), by Country 2024 & 2032
- Figure 8: Europe Dispersing Agents Industry Volume (K Tons), by Country 2024 & 2032
- Figure 9: Europe Dispersing Agents Industry Revenue Share (%), by Country 2024 & 2032
- Figure 10: Europe Dispersing Agents Industry Volume Share (%), by Country 2024 & 2032
- Figure 11: Asia Pacific Dispersing Agents Industry Revenue (Million), by Country 2024 & 2032
- Figure 12: Asia Pacific Dispersing Agents Industry Volume (K Tons), by Country 2024 & 2032
- Figure 13: Asia Pacific Dispersing Agents Industry Revenue Share (%), by Country 2024 & 2032
- Figure 14: Asia Pacific Dispersing Agents Industry Volume Share (%), by Country 2024 & 2032
- Figure 15: South America Dispersing Agents Industry Revenue (Million), by Country 2024 & 2032
- Figure 16: South America Dispersing Agents Industry Volume (K Tons), by Country 2024 & 2032
- Figure 17: South America Dispersing Agents Industry Revenue Share (%), by Country 2024 & 2032
- Figure 18: South America Dispersing Agents Industry Volume Share (%), by Country 2024 & 2032
- Figure 19: North America Dispersing Agents Industry Revenue (Million), by Country 2024 & 2032
- Figure 20: North America Dispersing Agents Industry Volume (K Tons), by Country 2024 & 2032
- Figure 21: North America Dispersing Agents Industry Revenue Share (%), by Country 2024 & 2032
- Figure 22: North America Dispersing Agents Industry Volume Share (%), by Country 2024 & 2032
- Figure 23: MEA Dispersing Agents Industry Revenue (Million), by Country 2024 & 2032
- Figure 24: MEA Dispersing Agents Industry Volume (K Tons), by Country 2024 & 2032
- Figure 25: MEA Dispersing Agents Industry Revenue Share (%), by Country 2024 & 2032
- Figure 26: MEA Dispersing Agents Industry Volume Share (%), by Country 2024 & 2032
- Figure 27: Asia Pacific Dispersing Agents Industry Revenue (Million), by Formation Type 2024 & 2032
- Figure 28: Asia Pacific Dispersing Agents Industry Volume (K Tons), by Formation Type 2024 & 2032
- Figure 29: Asia Pacific Dispersing Agents Industry Revenue Share (%), by Formation Type 2024 & 2032
- Figure 30: Asia Pacific Dispersing Agents Industry Volume Share (%), by Formation Type 2024 & 2032
- Figure 31: Asia Pacific Dispersing Agents Industry Revenue (Million), by End-user Industry 2024 & 2032
- Figure 32: Asia Pacific Dispersing Agents Industry Volume (K Tons), by End-user Industry 2024 & 2032
- Figure 33: Asia Pacific Dispersing Agents Industry Revenue Share (%), by End-user Industry 2024 & 2032
- Figure 34: Asia Pacific Dispersing Agents Industry Volume Share (%), by End-user Industry 2024 & 2032
- Figure 35: Asia Pacific Dispersing Agents Industry Revenue (Million), by Country 2024 & 2032
- Figure 36: Asia Pacific Dispersing Agents Industry Volume (K Tons), by Country 2024 & 2032
- Figure 37: Asia Pacific Dispersing Agents Industry Revenue Share (%), by Country 2024 & 2032
- Figure 38: Asia Pacific Dispersing Agents Industry Volume Share (%), by Country 2024 & 2032
- Figure 39: North America Dispersing Agents Industry Revenue (Million), by Formation Type 2024 & 2032
- Figure 40: North America Dispersing Agents Industry Volume (K Tons), by Formation Type 2024 & 2032
- Figure 41: North America Dispersing Agents Industry Revenue Share (%), by Formation Type 2024 & 2032
- Figure 42: North America Dispersing Agents Industry Volume Share (%), by Formation Type 2024 & 2032
- Figure 43: North America Dispersing Agents Industry Revenue (Million), by End-user Industry 2024 & 2032
- Figure 44: North America Dispersing Agents Industry Volume (K Tons), by End-user Industry 2024 & 2032
- Figure 45: North America Dispersing Agents Industry Revenue Share (%), by End-user Industry 2024 & 2032
- Figure 46: North America Dispersing Agents Industry Volume Share (%), by End-user Industry 2024 & 2032
- Figure 47: North America Dispersing Agents Industry Revenue (Million), by Country 2024 & 2032
- Figure 48: North America Dispersing Agents Industry Volume (K Tons), by Country 2024 & 2032
- Figure 49: North America Dispersing Agents Industry Revenue Share (%), by Country 2024 & 2032
- Figure 50: North America Dispersing Agents Industry Volume Share (%), by Country 2024 & 2032
- Figure 51: Europe Dispersing Agents Industry Revenue (Million), by Formation Type 2024 & 2032
- Figure 52: Europe Dispersing Agents Industry Volume (K Tons), by Formation Type 2024 & 2032
- Figure 53: Europe Dispersing Agents Industry Revenue Share (%), by Formation Type 2024 & 2032
- Figure 54: Europe Dispersing Agents Industry Volume Share (%), by Formation Type 2024 & 2032
- Figure 55: Europe Dispersing Agents Industry Revenue (Million), by End-user Industry 2024 & 2032
- Figure 56: Europe Dispersing Agents Industry Volume (K Tons), by End-user Industry 2024 & 2032
- Figure 57: Europe Dispersing Agents Industry Revenue Share (%), by End-user Industry 2024 & 2032
- Figure 58: Europe Dispersing Agents Industry Volume Share (%), by End-user Industry 2024 & 2032
- Figure 59: Europe Dispersing Agents Industry Revenue (Million), by Country 2024 & 2032
- Figure 60: Europe Dispersing Agents Industry Volume (K Tons), by Country 2024 & 2032
- Figure 61: Europe Dispersing Agents Industry Revenue Share (%), by Country 2024 & 2032
- Figure 62: Europe Dispersing Agents Industry Volume Share (%), by Country 2024 & 2032
- Figure 63: South America Dispersing Agents Industry Revenue (Million), by Formation Type 2024 & 2032
- Figure 64: South America Dispersing Agents Industry Volume (K Tons), by Formation Type 2024 & 2032
- Figure 65: South America Dispersing Agents Industry Revenue Share (%), by Formation Type 2024 & 2032
- Figure 66: South America Dispersing Agents Industry Volume Share (%), by Formation Type 2024 & 2032
- Figure 67: South America Dispersing Agents Industry Revenue (Million), by End-user Industry 2024 & 2032
- Figure 68: South America Dispersing Agents Industry Volume (K Tons), by End-user Industry 2024 & 2032
- Figure 69: South America Dispersing Agents Industry Revenue Share (%), by End-user Industry 2024 & 2032
- Figure 70: South America Dispersing Agents Industry Volume Share (%), by End-user Industry 2024 & 2032
- Figure 71: South America Dispersing Agents Industry Revenue (Million), by Country 2024 & 2032
- Figure 72: South America Dispersing Agents Industry Volume (K Tons), by Country 2024 & 2032
- Figure 73: South America Dispersing Agents Industry Revenue Share (%), by Country 2024 & 2032
- Figure 74: South America Dispersing Agents Industry Volume Share (%), by Country 2024 & 2032
- Figure 75: Middle East and Africa Dispersing Agents Industry Revenue (Million), by Formation Type 2024 & 2032
- Figure 76: Middle East and Africa Dispersing Agents Industry Volume (K Tons), by Formation Type 2024 & 2032
- Figure 77: Middle East and Africa Dispersing Agents Industry Revenue Share (%), by Formation Type 2024 & 2032
- Figure 78: Middle East and Africa Dispersing Agents Industry Volume Share (%), by Formation Type 2024 & 2032
- Figure 79: Middle East and Africa Dispersing Agents Industry Revenue (Million), by End-user Industry 2024 & 2032
- Figure 80: Middle East and Africa Dispersing Agents Industry Volume (K Tons), by End-user Industry 2024 & 2032
- Figure 81: Middle East and Africa Dispersing Agents Industry Revenue Share (%), by End-user Industry 2024 & 2032
- Figure 82: Middle East and Africa Dispersing Agents Industry Volume Share (%), by End-user Industry 2024 & 2032
- Figure 83: Middle East and Africa Dispersing Agents Industry Revenue (Million), by Country 2024 & 2032
- Figure 84: Middle East and Africa Dispersing Agents Industry Volume (K Tons), by Country 2024 & 2032
- Figure 85: Middle East and Africa Dispersing Agents Industry Revenue Share (%), by Country 2024 & 2032
- Figure 86: Middle East and Africa Dispersing Agents Industry Volume Share (%), by Country 2024 & 2032
List of Tables
- Table 1: Global Dispersing Agents Industry Revenue Million Forecast, by Region 2019 & 2032
- Table 2: Global Dispersing Agents Industry Volume K Tons Forecast, by Region 2019 & 2032
- Table 3: Global Dispersing Agents Industry Revenue Million Forecast, by Formation Type 2019 & 2032
- Table 4: Global Dispersing Agents Industry Volume K Tons Forecast, by Formation Type 2019 & 2032
- Table 5: Global Dispersing Agents Industry Revenue Million Forecast, by End-user Industry 2019 & 2032
- Table 6: Global Dispersing Agents Industry Volume K Tons Forecast, by End-user Industry 2019 & 2032
- Table 7: Global Dispersing Agents Industry Revenue Million Forecast, by Region 2019 & 2032
- Table 8: Global Dispersing Agents Industry Volume K Tons Forecast, by Region 2019 & 2032
- Table 9: Global Dispersing Agents Industry Revenue Million Forecast, by Country 2019 & 2032
- Table 10: Global Dispersing Agents Industry Volume K Tons Forecast, by Country 2019 & 2032
- Table 11: United States Dispersing Agents Industry Revenue (Million) Forecast, by Application 2019 & 2032
- Table 12: United States Dispersing Agents Industry Volume (K Tons) Forecast, by Application 2019 & 2032
- Table 13: Canada Dispersing Agents Industry Revenue (Million) Forecast, by Application 2019 & 2032
- Table 14: Canada Dispersing Agents Industry Volume (K Tons) Forecast, by Application 2019 & 2032
- Table 15: Mexico Dispersing Agents Industry Revenue (Million) Forecast, by Application 2019 & 2032
- Table 16: Mexico Dispersing Agents Industry Volume (K Tons) Forecast, by Application 2019 & 2032
- Table 17: Global Dispersing Agents Industry Revenue Million Forecast, by Country 2019 & 2032
- Table 18: Global Dispersing Agents Industry Volume K Tons Forecast, by Country 2019 & 2032
- Table 19: Germany Dispersing Agents Industry Revenue (Million) Forecast, by Application 2019 & 2032
- Table 20: Germany Dispersing Agents Industry Volume (K Tons) Forecast, by Application 2019 & 2032
- Table 21: United Kingdom Dispersing Agents Industry Revenue (Million) Forecast, by Application 2019 & 2032
- Table 22: United Kingdom Dispersing Agents Industry Volume (K Tons) Forecast, by Application 2019 & 2032
- Table 23: France Dispersing Agents Industry Revenue (Million) Forecast, by Application 2019 & 2032
- Table 24: France Dispersing Agents Industry Volume (K Tons) Forecast, by Application 2019 & 2032
- Table 25: Spain Dispersing Agents Industry Revenue (Million) Forecast, by Application 2019 & 2032
- Table 26: Spain Dispersing Agents Industry Volume (K Tons) Forecast, by Application 2019 & 2032
- Table 27: Italy Dispersing Agents Industry Revenue (Million) Forecast, by Application 2019 & 2032
- Table 28: Italy Dispersing Agents Industry Volume (K Tons) Forecast, by Application 2019 & 2032
- Table 29: Spain Dispersing Agents Industry Revenue (Million) Forecast, by Application 2019 & 2032
- Table 30: Spain Dispersing Agents Industry Volume (K Tons) Forecast, by Application 2019 & 2032
- Table 31: Belgium Dispersing Agents Industry Revenue (Million) Forecast, by Application 2019 & 2032
- Table 32: Belgium Dispersing Agents Industry Volume (K Tons) Forecast, by Application 2019 & 2032
- Table 33: Netherland Dispersing Agents Industry Revenue (Million) Forecast, by Application 2019 & 2032
- Table 34: Netherland Dispersing Agents Industry Volume (K Tons) Forecast, by Application 2019 & 2032
- Table 35: Nordics Dispersing Agents Industry Revenue (Million) Forecast, by Application 2019 & 2032
- Table 36: Nordics Dispersing Agents Industry Volume (K Tons) Forecast, by Application 2019 & 2032
- Table 37: Rest of Europe Dispersing Agents Industry Revenue (Million) Forecast, by Application 2019 & 2032
- Table 38: Rest of Europe Dispersing Agents Industry Volume (K Tons) Forecast, by Application 2019 & 2032
- Table 39: Global Dispersing Agents Industry Revenue Million Forecast, by Country 2019 & 2032
- Table 40: Global Dispersing Agents Industry Volume K Tons Forecast, by Country 2019 & 2032
- Table 41: China Dispersing Agents Industry Revenue (Million) Forecast, by Application 2019 & 2032
- Table 42: China Dispersing Agents Industry Volume (K Tons) Forecast, by Application 2019 & 2032
- Table 43: Japan Dispersing Agents Industry Revenue (Million) Forecast, by Application 2019 & 2032
- Table 44: Japan Dispersing Agents Industry Volume (K Tons) Forecast, by Application 2019 & 2032
- Table 45: India Dispersing Agents Industry Revenue (Million) Forecast, by Application 2019 & 2032
- Table 46: India Dispersing Agents Industry Volume (K Tons) Forecast, by Application 2019 & 2032
- Table 47: South Korea Dispersing Agents Industry Revenue (Million) Forecast, by Application 2019 & 2032
- Table 48: South Korea Dispersing Agents Industry Volume (K Tons) Forecast, by Application 2019 & 2032
- Table 49: Southeast Asia Dispersing Agents Industry Revenue (Million) Forecast, by Application 2019 & 2032
- Table 50: Southeast Asia Dispersing Agents Industry Volume (K Tons) Forecast, by Application 2019 & 2032
- Table 51: Australia Dispersing Agents Industry Revenue (Million) Forecast, by Application 2019 & 2032
- Table 52: Australia Dispersing Agents Industry Volume (K Tons) Forecast, by Application 2019 & 2032
- Table 53: Indonesia Dispersing Agents Industry Revenue (Million) Forecast, by Application 2019 & 2032
- Table 54: Indonesia Dispersing Agents Industry Volume (K Tons) Forecast, by Application 2019 & 2032
- Table 55: Phillipes Dispersing Agents Industry Revenue (Million) Forecast, by Application 2019 & 2032
- Table 56: Phillipes Dispersing Agents Industry Volume (K Tons) Forecast, by Application 2019 & 2032
- Table 57: Singapore Dispersing Agents Industry Revenue (Million) Forecast, by Application 2019 & 2032
- Table 58: Singapore Dispersing Agents Industry Volume (K Tons) Forecast, by Application 2019 & 2032
- Table 59: Thailandc Dispersing Agents Industry Revenue (Million) Forecast, by Application 2019 & 2032
- Table 60: Thailandc Dispersing Agents Industry Volume (K Tons) Forecast, by Application 2019 & 2032
- Table 61: Rest of Asia Pacific Dispersing Agents Industry Revenue (Million) Forecast, by Application 2019 & 2032
- Table 62: Rest of Asia Pacific Dispersing Agents Industry Volume (K Tons) Forecast, by Application 2019 & 2032
- Table 63: Global Dispersing Agents Industry Revenue Million Forecast, by Country 2019 & 2032
- Table 64: Global Dispersing Agents Industry Volume K Tons Forecast, by Country 2019 & 2032
- Table 65: Brazil Dispersing Agents Industry Revenue (Million) Forecast, by Application 2019 & 2032
- Table 66: Brazil Dispersing Agents Industry Volume (K Tons) Forecast, by Application 2019 & 2032
- Table 67: Argentina Dispersing Agents Industry Revenue (Million) Forecast, by Application 2019 & 2032
- Table 68: Argentina Dispersing Agents Industry Volume (K Tons) Forecast, by Application 2019 & 2032
- Table 69: Peru Dispersing Agents Industry Revenue (Million) Forecast, by Application 2019 & 2032
- Table 70: Peru Dispersing Agents Industry Volume (K Tons) Forecast, by Application 2019 & 2032
- Table 71: Chile Dispersing Agents Industry Revenue (Million) Forecast, by Application 2019 & 2032
- Table 72: Chile Dispersing Agents Industry Volume (K Tons) Forecast, by Application 2019 & 2032
- Table 73: Colombia Dispersing Agents Industry Revenue (Million) Forecast, by Application 2019 & 2032
- Table 74: Colombia Dispersing Agents Industry Volume (K Tons) Forecast, by Application 2019 & 2032
- Table 75: Ecuador Dispersing Agents Industry Revenue (Million) Forecast, by Application 2019 & 2032
- Table 76: Ecuador Dispersing Agents Industry Volume (K Tons) Forecast, by Application 2019 & 2032
- Table 77: Venezuela Dispersing Agents Industry Revenue (Million) Forecast, by Application 2019 & 2032
- Table 78: Venezuela Dispersing Agents Industry Volume (K Tons) Forecast, by Application 2019 & 2032
- Table 79: Rest of South America Dispersing Agents Industry Revenue (Million) Forecast, by Application 2019 & 2032
- Table 80: Rest of South America Dispersing Agents Industry Volume (K Tons) Forecast, by Application 2019 & 2032
- Table 81: Global Dispersing Agents Industry Revenue Million Forecast, by Country 2019 & 2032
- Table 82: Global Dispersing Agents Industry Volume K Tons Forecast, by Country 2019 & 2032
- Table 83: United States Dispersing Agents Industry Revenue (Million) Forecast, by Application 2019 & 2032
- Table 84: United States Dispersing Agents Industry Volume (K Tons) Forecast, by Application 2019 & 2032
- Table 85: Canada Dispersing Agents Industry Revenue (Million) Forecast, by Application 2019 & 2032
- Table 86: Canada Dispersing Agents Industry Volume (K Tons) Forecast, by Application 2019 & 2032
- Table 87: Mexico Dispersing Agents Industry Revenue (Million) Forecast, by Application 2019 & 2032
- Table 88: Mexico Dispersing Agents Industry Volume (K Tons) Forecast, by Application 2019 & 2032
- Table 89: Global Dispersing Agents Industry Revenue Million Forecast, by Country 2019 & 2032
- Table 90: Global Dispersing Agents Industry Volume K Tons Forecast, by Country 2019 & 2032
- Table 91: United Arab Emirates Dispersing Agents Industry Revenue (Million) Forecast, by Application 2019 & 2032
- Table 92: United Arab Emirates Dispersing Agents Industry Volume (K Tons) Forecast, by Application 2019 & 2032
- Table 93: Saudi Arabia Dispersing Agents Industry Revenue (Million) Forecast, by Application 2019 & 2032
- Table 94: Saudi Arabia Dispersing Agents Industry Volume (K Tons) Forecast, by Application 2019 & 2032
- Table 95: South Africa Dispersing Agents Industry Revenue (Million) Forecast, by Application 2019 & 2032
- Table 96: South Africa Dispersing Agents Industry Volume (K Tons) Forecast, by Application 2019 & 2032
- Table 97: Rest of Middle East and Africa Dispersing Agents Industry Revenue (Million) Forecast, by Application 2019 & 2032
- Table 98: Rest of Middle East and Africa Dispersing Agents Industry Volume (K Tons) Forecast, by Application 2019 & 2032
- Table 99: Global Dispersing Agents Industry Revenue Million Forecast, by Formation Type 2019 & 2032
- Table 100: Global Dispersing Agents Industry Volume K Tons Forecast, by Formation Type 2019 & 2032
- Table 101: Global Dispersing Agents Industry Revenue Million Forecast, by End-user Industry 2019 & 2032
- Table 102: Global Dispersing Agents Industry Volume K Tons Forecast, by End-user Industry 2019 & 2032
- Table 103: Global Dispersing Agents Industry Revenue Million Forecast, by Country 2019 & 2032
- Table 104: Global Dispersing Agents Industry Volume K Tons Forecast, by Country 2019 & 2032
- Table 105: China Dispersing Agents Industry Revenue (Million) Forecast, by Application 2019 & 2032
- Table 106: China Dispersing Agents Industry Volume (K Tons) Forecast, by Application 2019 & 2032
- Table 107: India Dispersing Agents Industry Revenue (Million) Forecast, by Application 2019 & 2032
- Table 108: India Dispersing Agents Industry Volume (K Tons) Forecast, by Application 2019 & 2032
- Table 109: Japan Dispersing Agents Industry Revenue (Million) Forecast, by Application 2019 & 2032
- Table 110: Japan Dispersing Agents Industry Volume (K Tons) Forecast, by Application 2019 & 2032
- Table 111: South Korea Dispersing Agents Industry Revenue (Million) Forecast, by Application 2019 & 2032
- Table 112: South Korea Dispersing Agents Industry Volume (K Tons) Forecast, by Application 2019 & 2032
- Table 113: Indonesia Dispersing Agents Industry Revenue (Million) Forecast, by Application 2019 & 2032
- Table 114: Indonesia Dispersing Agents Industry Volume (K Tons) Forecast, by Application 2019 & 2032
- Table 115: Malaysia Dispersing Agents Industry Revenue (Million) Forecast, by Application 2019 & 2032
- Table 116: Malaysia Dispersing Agents Industry Volume (K Tons) Forecast, by Application 2019 & 2032
- Table 117: Thailand Dispersing Agents Industry Revenue (Million) Forecast, by Application 2019 & 2032
- Table 118: Thailand Dispersing Agents Industry Volume (K Tons) Forecast, by Application 2019 & 2032
- Table 119: Vietnam Dispersing Agents Industry Revenue (Million) Forecast, by Application 2019 & 2032
- Table 120: Vietnam Dispersing Agents Industry Volume (K Tons) Forecast, by Application 2019 & 2032
- Table 121: Rest of Asia Pacific Dispersing Agents Industry Revenue (Million) Forecast, by Application 2019 & 2032
- Table 122: Rest of Asia Pacific Dispersing Agents Industry Volume (K Tons) Forecast, by Application 2019 & 2032
- Table 123: Global Dispersing Agents Industry Revenue Million Forecast, by Formation Type 2019 & 2032
- Table 124: Global Dispersing Agents Industry Volume K Tons Forecast, by Formation Type 2019 & 2032
- Table 125: Global Dispersing Agents Industry Revenue Million Forecast, by End-user Industry 2019 & 2032
- Table 126: Global Dispersing Agents Industry Volume K Tons Forecast, by End-user Industry 2019 & 2032
- Table 127: Global Dispersing Agents Industry Revenue Million Forecast, by Country 2019 & 2032
- Table 128: Global Dispersing Agents Industry Volume K Tons Forecast, by Country 2019 & 2032
- Table 129: United States Dispersing Agents Industry Revenue (Million) Forecast, by Application 2019 & 2032
- Table 130: United States Dispersing Agents Industry Volume (K Tons) Forecast, by Application 2019 & 2032
- Table 131: Canada Dispersing Agents Industry Revenue (Million) Forecast, by Application 2019 & 2032
- Table 132: Canada Dispersing Agents Industry Volume (K Tons) Forecast, by Application 2019 & 2032
- Table 133: Mexico Dispersing Agents Industry Revenue (Million) Forecast, by Application 2019 & 2032
- Table 134: Mexico Dispersing Agents Industry Volume (K Tons) Forecast, by Application 2019 & 2032
- Table 135: Global Dispersing Agents Industry Revenue Million Forecast, by Formation Type 2019 & 2032
- Table 136: Global Dispersing Agents Industry Volume K Tons Forecast, by Formation Type 2019 & 2032
- Table 137: Global Dispersing Agents Industry Revenue Million Forecast, by End-user Industry 2019 & 2032
- Table 138: Global Dispersing Agents Industry Volume K Tons Forecast, by End-user Industry 2019 & 2032
- Table 139: Global Dispersing Agents Industry Revenue Million Forecast, by Country 2019 & 2032
- Table 140: Global Dispersing Agents Industry Volume K Tons Forecast, by Country 2019 & 2032
- Table 141: Germany Dispersing Agents Industry Revenue (Million) Forecast, by Application 2019 & 2032
- Table 142: Germany Dispersing Agents Industry Volume (K Tons) Forecast, by Application 2019 & 2032
- Table 143: United Kingdom Dispersing Agents Industry Revenue (Million) Forecast, by Application 2019 & 2032
- Table 144: United Kingdom Dispersing Agents Industry Volume (K Tons) Forecast, by Application 2019 & 2032
- Table 145: Italy Dispersing Agents Industry Revenue (Million) Forecast, by Application 2019 & 2032
- Table 146: Italy Dispersing Agents Industry Volume (K Tons) Forecast, by Application 2019 & 2032
- Table 147: France Dispersing Agents Industry Revenue (Million) Forecast, by Application 2019 & 2032
- Table 148: France Dispersing Agents Industry Volume (K Tons) Forecast, by Application 2019 & 2032
- Table 149: Spain Dispersing Agents Industry Revenue (Million) Forecast, by Application 2019 & 2032
- Table 150: Spain Dispersing Agents Industry Volume (K Tons) Forecast, by Application 2019 & 2032
- Table 151: Russia Dispersing Agents Industry Revenue (Million) Forecast, by Application 2019 & 2032
- Table 152: Russia Dispersing Agents Industry Volume (K Tons) Forecast, by Application 2019 & 2032
- Table 153: NORDIC Countries Dispersing Agents Industry Revenue (Million) Forecast, by Application 2019 & 2032
- Table 154: NORDIC Countries Dispersing Agents Industry Volume (K Tons) Forecast, by Application 2019 & 2032
- Table 155: Rest of Europe Dispersing Agents Industry Revenue (Million) Forecast, by Application 2019 & 2032
- Table 156: Rest of Europe Dispersing Agents Industry Volume (K Tons) Forecast, by Application 2019 & 2032
- Table 157: Global Dispersing Agents Industry Revenue Million Forecast, by Formation Type 2019 & 2032
- Table 158: Global Dispersing Agents Industry Volume K Tons Forecast, by Formation Type 2019 & 2032
- Table 159: Global Dispersing Agents Industry Revenue Million Forecast, by End-user Industry 2019 & 2032
- Table 160: Global Dispersing Agents Industry Volume K Tons Forecast, by End-user Industry 2019 & 2032
- Table 161: Global Dispersing Agents Industry Revenue Million Forecast, by Country 2019 & 2032
- Table 162: Global Dispersing Agents Industry Volume K Tons Forecast, by Country 2019 & 2032
- Table 163: Brazil Dispersing Agents Industry Revenue (Million) Forecast, by Application 2019 & 2032
- Table 164: Brazil Dispersing Agents Industry Volume (K Tons) Forecast, by Application 2019 & 2032
- Table 165: Argentina Dispersing Agents Industry Revenue (Million) Forecast, by Application 2019 & 2032
- Table 166: Argentina Dispersing Agents Industry Volume (K Tons) Forecast, by Application 2019 & 2032
- Table 167: Colombia Dispersing Agents Industry Revenue (Million) Forecast, by Application 2019 & 2032
- Table 168: Colombia Dispersing Agents Industry Volume (K Tons) Forecast, by Application 2019 & 2032
- Table 169: Rest of South America Dispersing Agents Industry Revenue (Million) Forecast, by Application 2019 & 2032
- Table 170: Rest of South America Dispersing Agents Industry Volume (K Tons) Forecast, by Application 2019 & 2032
- Table 171: Global Dispersing Agents Industry Revenue Million Forecast, by Formation Type 2019 & 2032
- Table 172: Global Dispersing Agents Industry Volume K Tons Forecast, by Formation Type 2019 & 2032
- Table 173: Global Dispersing Agents Industry Revenue Million Forecast, by End-user Industry 2019 & 2032
- Table 174: Global Dispersing Agents Industry Volume K Tons Forecast, by End-user Industry 2019 & 2032
- Table 175: Global Dispersing Agents Industry Revenue Million Forecast, by Country 2019 & 2032
- Table 176: Global Dispersing Agents Industry Volume K Tons Forecast, by Country 2019 & 2032
- Table 177: Saudi Arabia Dispersing Agents Industry Revenue (Million) Forecast, by Application 2019 & 2032
- Table 178: Saudi Arabia Dispersing Agents Industry Volume (K Tons) Forecast, by Application 2019 & 2032
- Table 179: South Africa Dispersing Agents Industry Revenue (Million) Forecast, by Application 2019 & 2032
- Table 180: South Africa Dispersing Agents Industry Volume (K Tons) Forecast, by Application 2019 & 2032
- Table 181: Qatar Dispersing Agents Industry Revenue (Million) Forecast, by Application 2019 & 2032
- Table 182: Qatar Dispersing Agents Industry Volume (K Tons) Forecast, by Application 2019 & 2032
- Table 183: UAE Dispersing Agents Industry Revenue (Million) Forecast, by Application 2019 & 2032
- Table 184: UAE Dispersing Agents Industry Volume (K Tons) Forecast, by Application 2019 & 2032
- Table 185: Egypt Dispersing Agents Industry Revenue (Million) Forecast, by Application 2019 & 2032
- Table 186: Egypt Dispersing Agents Industry Volume (K Tons) Forecast, by Application 2019 & 2032
- Table 187: Nigeria Dispersing Agents Industry Revenue (Million) Forecast, by Application 2019 & 2032
- Table 188: Nigeria Dispersing Agents Industry Volume (K Tons) Forecast, by Application 2019 & 2032
- Table 189: Rest of Middle East and Africa Dispersing Agents Industry Revenue (Million) Forecast, by Application 2019 & 2032
- Table 190: Rest of Middle East and Africa Dispersing Agents Industry Volume (K Tons) Forecast, by Application 2019 & 2032
Frequently Asked Questions
1. What is the projected Compound Annual Growth Rate (CAGR) of the Dispersing Agents Industry?
The projected CAGR is approximately > 3.50%.
2. Which companies are prominent players in the Dispersing Agents Industry?
Key companies in the market include ATLANTA, Solvay, Evonik Industries AG, Croda International Plc, Shubh Industries, King Industries Inc, Kemipex, Ashland, BASF SE, Arkema Group, ELEMENTS PLC, Rudolf GmbH, NICCA CHEMICAL CO LTD, The Lubrizol Corporation, CLARIANT, UNIQCHEM.
3. What are the main segments of the Dispersing Agents Industry?
The market segments include Formation Type, End-user Industry.
4. Can you provide details about the market size?
The market size is estimated to be USD 5.27 Million as of 2022.
5. What are some drivers contributing to market growth?
Increasing Demand from the Paints and Coatings Industry; The Increasing Oil Drilling and Exploration Activities; Other Drivers.
6. What are the notable trends driving market growth?
Increasing demand from the Paints and Coatings Industry.
7. Are there any restraints impacting market growth?
The Increasing Prices of Raw materials; Other Restraints.
8. Can you provide examples of recent developments in the market?
July 2022: Evonik Industries AG launched its new sustainable dispersing additive, TEGO Dispers 658. The dispersing agent was readily biodegradable and improved the sustainability of pigment and colored coatings production while at the same time offering formulators a similar high-performance profile.
9. What pricing options are available for accessing the report?
Pricing options include single-user, multi-user, and enterprise licenses priced at USD 4750, USD 5250, and USD 8750 respectively.
10. Is the market size provided in terms of value or volume?
The market size is provided in terms of value, measured in Million and volume, measured in K Tons.
11. Are there any specific market keywords associated with the report?
Yes, the market keyword associated with the report is "Dispersing Agents Industry," which aids in identifying and referencing the specific market segment covered.
12. How do I determine which pricing option suits my needs best?
The pricing options vary based on user requirements and access needs. Individual users may opt for single-user licenses, while businesses requiring broader access may choose multi-user or enterprise licenses for cost-effective access to the report.
13. Are there any additional resources or data provided in the Dispersing Agents Industry report?
While the report offers comprehensive insights, it's advisable to review the specific contents or supplementary materials provided to ascertain if additional resources or data are available.
14. How can I stay updated on further developments or reports in the Dispersing Agents Industry?
To stay informed about further developments, trends, and reports in the Dispersing Agents Industry, consider subscribing to industry newsletters, following relevant companies and organizations, or regularly checking reputable industry news sources and publications.
Methodology
Step 1 - Identification of Relevant Samples Size from Population Database


Step 2 - Approaches for Defining Global Market Size (Value, Volume* & Price*)

Note*: In applicable scenarios
Step 3 - Data Sources
Primary Research
- Web Analytics
- Survey Reports
- Research Institute
- Latest Research Reports
- Opinion Leaders
Secondary Research
- Annual Reports
- White Paper
- Latest Press Release
- Industry Association
- Paid Database
- Investor Presentations

Step 4 - Data Triangulation
Involves using different sources of information in order to increase the validity of a study
These sources are likely to be stakeholders in a program - participants, other researchers, program staff, other community members, and so on.
Then we put all data in single framework & apply various statistical tools to find out the dynamic on the market.
During the analysis stage, feedback from the stakeholder groups would be compared to determine areas of agreement as well as areas of divergence
