

Key Insights
The global confectionery market, valued at $229.48 billion in 2025, is projected to experience robust growth, driven by several key factors. Rising disposable incomes, particularly in developing economies, are fueling increased consumer spending on discretionary items like confectionery. The popularity of convenient snacking options and the growing demand for premium and artisanal chocolates are further contributing to market expansion. Online retail channels are witnessing significant growth, offering consumers greater convenience and accessibility to a wider variety of confectionery products. However, increasing health concerns surrounding sugar consumption and the growing preference for healthier alternatives pose challenges to the industry. Manufacturers are responding to these concerns by introducing healthier options, such as sugar-free and low-sugar confectionery, and promoting products with added nutritional benefits like vitamins or fiber. Innovation in flavors, textures, and packaging also plays a significant role in driving market growth, particularly among younger consumers. The market is segmented by distribution channels (convenience stores, online retail, supermarkets/hypermarkets, others) and confectionery types (chocolate, other confectionery). Chocolate continues to dominate the market, yet the "others" segment, encompassing candies, gums, and other sweets, exhibits strong growth potential due to diverse product offerings and evolving consumer preferences. Competition is intense, with major players such as Nestlé, Lindt, Ferrero, Mars, and Mondelez vying for market share through strategic product launches, acquisitions, and expansion into new markets. Regional variations exist, with North America and Europe remaining significant markets, while Asia-Pacific demonstrates rapid expansion fueled by rising middle-class populations and changing lifestyles. The industry is expected to maintain a steady growth trajectory throughout the forecast period (2025-2033), albeit with potential fluctuations influenced by economic conditions and evolving consumer preferences.
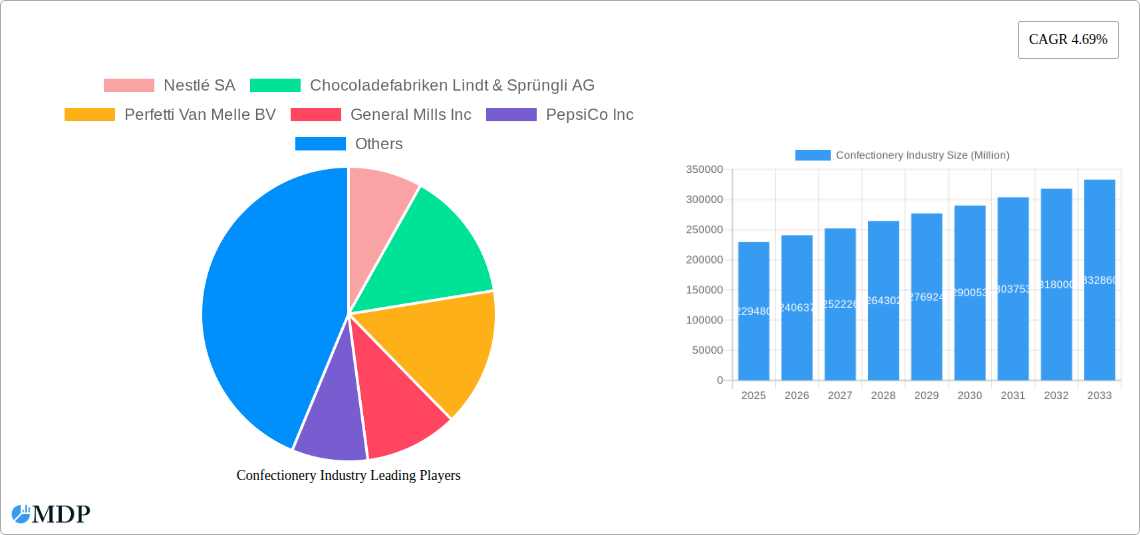
The projected Compound Annual Growth Rate (CAGR) of 4.69% indicates a steady expansion of the market, though specific growth rates for individual segments and regions may vary. The market's future trajectory will largely depend on the success of manufacturers in adapting to evolving consumer preferences and effectively addressing health and wellness concerns. Strategic partnerships, sustainable sourcing practices, and effective marketing campaigns will be crucial for securing a competitive edge in this dynamic market. Emerging trends such as personalized confectionery, incorporating functional ingredients, and leveraging sustainable packaging are likely to influence market developments in the coming years. While the overall market exhibits optimistic growth prospects, individual companies will need to continuously innovate and adapt to maintain profitability and market share in a competitive landscape characterized by diverse consumer demands and evolving preferences.
Confectionery Industry Market Report: 2019-2033
This comprehensive report provides an in-depth analysis of the global confectionery industry, offering invaluable insights for stakeholders seeking to navigate this dynamic market. With a focus on key players like Nestlé, Mars, and Ferrero, the report covers market sizing, segmentation, trends, and future projections for a study period spanning 2019-2033, with a base year of 2025. Expect actionable intelligence on market concentration, growth drivers, emerging opportunities, and potential challenges impacting the $XX Million industry.
Confectionery Industry Market Dynamics & Concentration
The global confectionery market, valued at $XX Million in 2024, is experiencing moderate consolidation, with a handful of multinational giants holding significant market share. Nestlé SA, Mars Incorporated, and Ferrero International SA are among the leading players, each commanding a double-digit percentage of the market. However, smaller regional players and emerging brands continue to innovate and capture niche segments.
Market concentration is influenced by several factors:
- Innovation: Constant product innovation, especially in healthier confectionery options and unique flavor profiles, drives market growth and allows companies to differentiate themselves.
- Regulatory Frameworks: Government regulations on sugar content, labeling, and marketing significantly impact product development and market access.
- Product Substitutes: The increasing popularity of healthier snacks and alternatives presents a competitive challenge to traditional confectionery products.
- End-User Trends: Shifting consumer preferences toward healthier choices, premiumization, and convenient formats influence product development and marketing strategies.
- Mergers & Acquisitions (M&A): The confectionery industry witnesses consistent M&A activity, as larger players seek to expand their market reach and product portfolios. Over the period 2019-2024, approximately xx M&A deals were recorded, contributing to market consolidation.
Confectionery Industry Industry Trends & Analysis
The confectionery market is experiencing a compound annual growth rate (CAGR) of approximately xx% during the forecast period (2025-2033). Several factors fuel this growth:
- Premiumization: Consumers increasingly seek premium and indulgent confectionery products, driving growth in the higher-priced segments.
- Health and Wellness: Growing health consciousness has led to the development of confectionery products with reduced sugar, natural ingredients, and added health benefits. Market penetration of these healthier options is projected to reach xx% by 2033.
- E-commerce Growth: Online retail channels are expanding rapidly, offering new opportunities for confectionery brands to reach consumers directly.
- Technological Disruptions: Technological advancements in production, packaging, and marketing are reshaping the industry landscape, enabling personalized products and enhancing consumer engagement.
- Competitive Dynamics: Intense competition among multinational companies and regional brands drives innovation and price competitiveness, benefiting consumers.
Leading Markets & Segments in Confectionery Industry
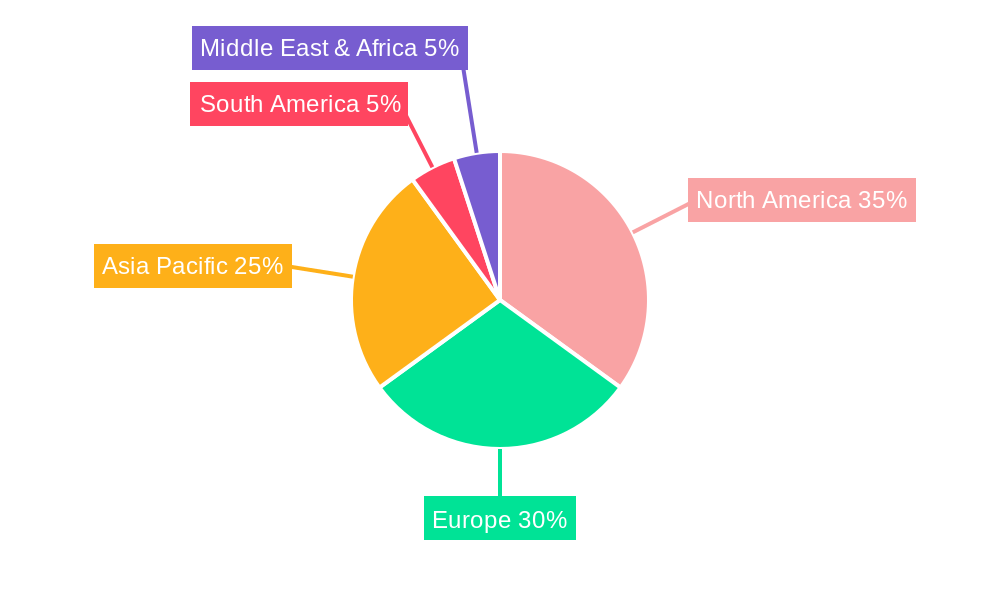
The North American market currently dominates the global confectionery industry, followed by Europe and Asia-Pacific. However, growth is expected to be strong in emerging markets due to rising disposable incomes and increasing urbanization.
Dominant Segments:
- Distribution Channel: Supermarket/hypermarkets remain the dominant distribution channel, accounting for approximately xx% of total sales, followed by convenience stores (xx%) and online retail stores (xx%). The “others” segment encompasses specialized stores and direct-to-consumer sales.
- Confections: Chocolate holds the largest market share within the confectionery segment, representing approximately xx% of total revenue, with “others” (including gummies, hard candies, etc.) comprising the remaining xx%.
Key Drivers:
- Economic Policies: Favorable economic conditions and rising disposable incomes stimulate confectionery consumption.
- Infrastructure: Well-developed retail infrastructure and efficient supply chains facilitate market access and distribution.
Confectionery Industry Product Developments
Recent product innovations focus on healthier options, premium ingredients, and unique flavor combinations. Companies are leveraging technological advancements like 3D printing to create customized confectionery items, and sustainable packaging solutions are gaining traction. These innovations aim to enhance the consumer experience while addressing growing health and environmental concerns.
Key Drivers of Confectionery Industry Growth
Several factors contribute to the sustained growth of the confectionery industry:
- Technological advancements: Automation in manufacturing, innovative packaging, and digital marketing techniques enhance efficiency and reach.
- Economic growth: Rising disposable incomes in emerging markets drive consumption of confectionery products.
- Favorable regulatory environment: Stable regulatory frameworks supporting the industry facilitate growth and investment.
Challenges in the Confectionery Industry Market
The confectionery industry faces significant hurdles:
- Health concerns: Growing awareness of the health implications of excessive sugar consumption impacts demand. This has led to a xx% decline in sales of certain product categories in recent years.
- Supply chain disruptions: Global events and economic volatility disrupt supply chains, impacting production and distribution.
- Intense competition: The industry is characterized by intense competition, requiring constant innovation and cost optimization.
Emerging Opportunities in Confectionery Industry
Significant opportunities exist for growth:
- Premiumization and personalization: Catering to the demand for high-quality, customized confectionery products presents a lucrative opportunity.
- Healthier options: Developing and marketing confectionery products with reduced sugar and natural ingredients meets the growing health-conscious consumer base.
- Expanding into new markets: Emerging markets with growing middle classes offer substantial untapped potential.
Leading Players in the Confectionery Industry Sector
- Nestlé SA
- Chocoladefabriken Lindt & Sprüngli AG
- Perfetti Van Melle BV
- General Mills Inc
- PepsiCo Inc
- August Storck KG
- Ferrero International SA
- Mars Incorporated
- Yıldız Holding A.Ş.
- Lotte Corporation
- HARIBO Holding GmbH & Co KG
- Mondelēz International Inc
- Meiji Holdings Company Ltd
- The Hershey Company
- Kellogg Company
Key Milestones in Confectionery Industry Industry
- July 2023: HARIBO® opened its first North American manufacturing facility, boosting US gummi production and supply.
- July 2023: Ferrara Candy Co. (Ferrero) acquired Dori Alimentos, expanding its presence in the Brazilian confectionery market.
- August 2023: Ferrero North America showcased new Kinder Chocolate products at the Sweets & Snacks Expo, signaling product innovation and market expansion.
Strategic Outlook for Confectionery Industry Market
The confectionery industry is poised for continued growth, driven by innovation, evolving consumer preferences, and expansion into new markets. Companies that successfully adapt to changing consumer demands, embrace technological advancements, and adopt sustainable practices are expected to thrive in the coming years. Strategic partnerships and acquisitions will likely continue to shape the industry landscape, fostering further consolidation and market expansion.
Confectionery Industry Segmentation
-
1. Confections
-
1.1. Chocolate
-
1.1.1. By Confectionery Variant
- 1.1.1.1. Dark Chocolate
- 1.1.1.2. Milk and White Chocolate
-
1.1.1. By Confectionery Variant
-
1.2. Gums
- 1.2.1. Bubble Gum
-
1.2.2. Chewing Gum
-
1.2.2.1. By Sugar Content
- 1.2.2.1.1. Sugar Chewing Gum
- 1.2.2.1.2. Sugar-free Chewing Gum
-
1.2.2.1. By Sugar Content
-
1.3. Snack Bar
- 1.3.1. Cereal Bar
- 1.3.2. Fruit & Nut Bar
- 1.3.3. Protein Bar
-
1.4. Sugar Confectionery
- 1.4.1. Hard Candy
- 1.4.2. Lollipops
- 1.4.3. Mints
- 1.4.4. Pastilles, Gummies, and Jellies
- 1.4.5. Toffees and Nougats
- 1.4.6. Others
-
1.1. Chocolate
-
2. Distribution Channel
- 2.1. Convenience Store
- 2.2. Online Retail Store
- 2.3. Supermarket/Hypermarket
- 2.4. Others
Confectionery Industry Segmentation By Geography
-
1. North America
- 1.1. United States
- 1.2. Canada
- 1.3. Mexico
-
2. South America
- 2.1. Brazil
- 2.2. Argentina
- 2.3. Rest of South America
-
3. Europe
- 3.1. United Kingdom
- 3.2. Germany
- 3.3. France
- 3.4. Italy
- 3.5. Spain
- 3.6. Russia
- 3.7. Benelux
- 3.8. Nordics
- 3.9. Rest of Europe
-
4. Middle East & Africa
- 4.1. Turkey
- 4.2. Israel
- 4.3. GCC
- 4.4. North Africa
- 4.5. South Africa
- 4.6. Rest of Middle East & Africa
-
5. Asia Pacific
- 5.1. China
- 5.2. India
- 5.3. Japan
- 5.4. South Korea
- 5.5. ASEAN
- 5.6. Oceania
- 5.7. Rest of Asia Pacific
Confectionery Industry REPORT HIGHLIGHTS
| Aspects | Details |
|---|---|
| Study Period | 2019-2033 |
| Base Year | 2024 |
| Estimated Year | 2025 |
| Forecast Period | 2025-2033 |
| Historical Period | 2019-2024 |
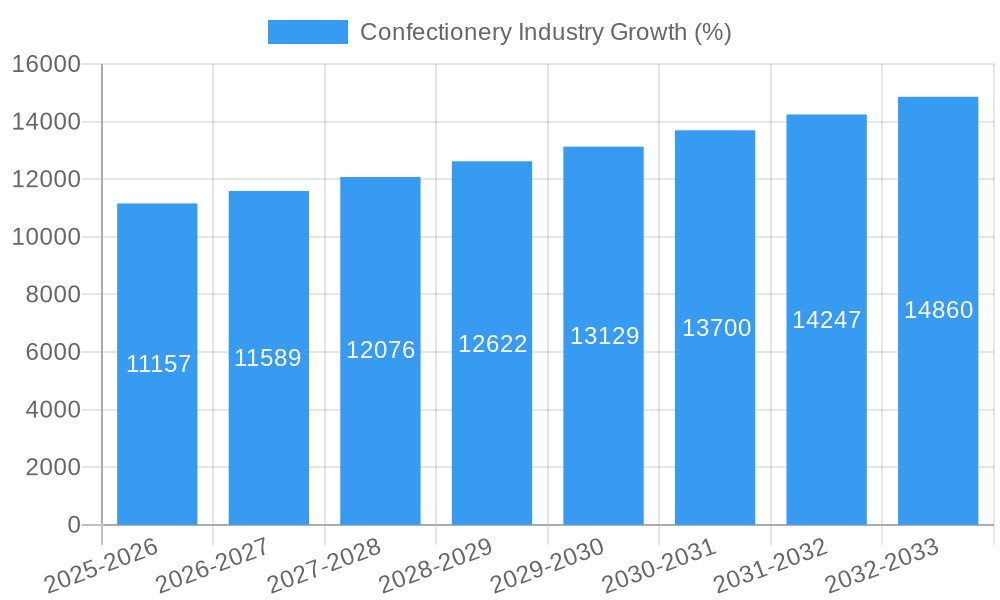
| Growth Rate | CAGR of 4.69% from 2019-2033 |
| Segmentation |
|
Table of Contents
- 1. Introduction
- 1.1. Research Scope
- 1.2. Market Segmentation
- 1.3. Research Methodology
- 1.4. Definitions and Assumptions
- 2. Executive Summary
- 2.1. Introduction
- 3. Market Dynamics
- 3.1. Introduction
- 3.2. Market Drivers
- 3.2.1. Increased Consumption of Baked Goods; Demand for Indigenous Fermented Foods
- 3.3. Market Restrains
- 3.3.1. Potential Side-effects of Yeast
- 3.4. Market Trends
- 3.4.1. OTHER KEY INDUSTRY TRENDS COVERED IN THE REPORT
- 4. Market Factor Analysis
- 4.1. Porters Five Forces
- 4.2. Supply/Value Chain
- 4.3. PESTEL analysis
- 4.4. Market Entropy
- 4.5. Patent/Trademark Analysis
- 5. Global Confectionery Industry Analysis, Insights and Forecast, 2019-2031
- 5.1. Market Analysis, Insights and Forecast - by Confections
- 5.1.1. Chocolate
- 5.1.1.1. By Confectionery Variant
- 5.1.1.1.1. Dark Chocolate
- 5.1.1.1.2. Milk and White Chocolate
- 5.1.1.1. By Confectionery Variant
- 5.1.2. Gums
- 5.1.2.1. Bubble Gum
- 5.1.2.2. Chewing Gum
- 5.1.2.2.1. By Sugar Content
- 5.1.2.2.1.1. Sugar Chewing Gum
- 5.1.2.2.1.2. Sugar-free Chewing Gum
- 5.1.2.2.1. By Sugar Content
- 5.1.3. Snack Bar
- 5.1.3.1. Cereal Bar
- 5.1.3.2. Fruit & Nut Bar
- 5.1.3.3. Protein Bar
- 5.1.4. Sugar Confectionery
- 5.1.4.1. Hard Candy
- 5.1.4.2. Lollipops
- 5.1.4.3. Mints
- 5.1.4.4. Pastilles, Gummies, and Jellies
- 5.1.4.5. Toffees and Nougats
- 5.1.4.6. Others
- 5.1.1. Chocolate
- 5.2. Market Analysis, Insights and Forecast - by Distribution Channel
- 5.2.1. Convenience Store
- 5.2.2. Online Retail Store
- 5.2.3. Supermarket/Hypermarket
- 5.2.4. Others
- 5.3. Market Analysis, Insights and Forecast - by Region
- 5.3.1. North America
- 5.3.2. South America
- 5.3.3. Europe
- 5.3.4. Middle East & Africa
- 5.3.5. Asia Pacific
- 5.1. Market Analysis, Insights and Forecast - by Confections
- 6. North America Confectionery Industry Analysis, Insights and Forecast, 2019-2031
- 6.1. Market Analysis, Insights and Forecast - by Confections
- 6.1.1. Chocolate
- 6.1.1.1. By Confectionery Variant
- 6.1.1.1.1. Dark Chocolate
- 6.1.1.1.2. Milk and White Chocolate
- 6.1.1.1. By Confectionery Variant
- 6.1.2. Gums
- 6.1.2.1. Bubble Gum
- 6.1.2.2. Chewing Gum
- 6.1.2.2.1. By Sugar Content
- 6.1.2.2.1.1. Sugar Chewing Gum
- 6.1.2.2.1.2. Sugar-free Chewing Gum
- 6.1.2.2.1. By Sugar Content
- 6.1.3. Snack Bar
- 6.1.3.1. Cereal Bar
- 6.1.3.2. Fruit & Nut Bar
- 6.1.3.3. Protein Bar
- 6.1.4. Sugar Confectionery
- 6.1.4.1. Hard Candy
- 6.1.4.2. Lollipops
- 6.1.4.3. Mints
- 6.1.4.4. Pastilles, Gummies, and Jellies
- 6.1.4.5. Toffees and Nougats
- 6.1.4.6. Others
- 6.1.1. Chocolate
- 6.2. Market Analysis, Insights and Forecast - by Distribution Channel
- 6.2.1. Convenience Store
- 6.2.2. Online Retail Store
- 6.2.3. Supermarket/Hypermarket
- 6.2.4. Others
- 6.1. Market Analysis, Insights and Forecast - by Confections
- 7. South America Confectionery Industry Analysis, Insights and Forecast, 2019-2031
- 7.1. Market Analysis, Insights and Forecast - by Confections
- 7.1.1. Chocolate
- 7.1.1.1. By Confectionery Variant
- 7.1.1.1.1. Dark Chocolate
- 7.1.1.1.2. Milk and White Chocolate
- 7.1.1.1. By Confectionery Variant
- 7.1.2. Gums
- 7.1.2.1. Bubble Gum
- 7.1.2.2. Chewing Gum
- 7.1.2.2.1. By Sugar Content
- 7.1.2.2.1.1. Sugar Chewing Gum
- 7.1.2.2.1.2. Sugar-free Chewing Gum
- 7.1.2.2.1. By Sugar Content
- 7.1.3. Snack Bar
- 7.1.3.1. Cereal Bar
- 7.1.3.2. Fruit & Nut Bar
- 7.1.3.3. Protein Bar
- 7.1.4. Sugar Confectionery
- 7.1.4.1. Hard Candy
- 7.1.4.2. Lollipops
- 7.1.4.3. Mints
- 7.1.4.4. Pastilles, Gummies, and Jellies
- 7.1.4.5. Toffees and Nougats
- 7.1.4.6. Others
- 7.1.1. Chocolate
- 7.2. Market Analysis, Insights and Forecast - by Distribution Channel
- 7.2.1. Convenience Store
- 7.2.2. Online Retail Store
- 7.2.3. Supermarket/Hypermarket
- 7.2.4. Others
- 7.1. Market Analysis, Insights and Forecast - by Confections
- 8. Europe Confectionery Industry Analysis, Insights and Forecast, 2019-2031
- 8.1. Market Analysis, Insights and Forecast - by Confections
- 8.1.1. Chocolate
- 8.1.1.1. By Confectionery Variant
- 8.1.1.1.1. Dark Chocolate
- 8.1.1.1.2. Milk and White Chocolate
- 8.1.1.1. By Confectionery Variant
- 8.1.2. Gums
- 8.1.2.1. Bubble Gum
- 8.1.2.2. Chewing Gum
- 8.1.2.2.1. By Sugar Content
- 8.1.2.2.1.1. Sugar Chewing Gum
- 8.1.2.2.1.2. Sugar-free Chewing Gum
- 8.1.2.2.1. By Sugar Content
- 8.1.3. Snack Bar
- 8.1.3.1. Cereal Bar
- 8.1.3.2. Fruit & Nut Bar
- 8.1.3.3. Protein Bar
- 8.1.4. Sugar Confectionery
- 8.1.4.1. Hard Candy
- 8.1.4.2. Lollipops
- 8.1.4.3. Mints
- 8.1.4.4. Pastilles, Gummies, and Jellies
- 8.1.4.5. Toffees and Nougats
- 8.1.4.6. Others
- 8.1.1. Chocolate
- 8.2. Market Analysis, Insights and Forecast - by Distribution Channel
- 8.2.1. Convenience Store
- 8.2.2. Online Retail Store
- 8.2.3. Supermarket/Hypermarket
- 8.2.4. Others
- 8.1. Market Analysis, Insights and Forecast - by Confections
- 9. Middle East & Africa Confectionery Industry Analysis, Insights and Forecast, 2019-2031
- 9.1. Market Analysis, Insights and Forecast - by Confections
- 9.1.1. Chocolate
- 9.1.1.1. By Confectionery Variant
- 9.1.1.1.1. Dark Chocolate
- 9.1.1.1.2. Milk and White Chocolate
- 9.1.1.1. By Confectionery Variant
- 9.1.2. Gums
- 9.1.2.1. Bubble Gum
- 9.1.2.2. Chewing Gum
- 9.1.2.2.1. By Sugar Content
- 9.1.2.2.1.1. Sugar Chewing Gum
- 9.1.2.2.1.2. Sugar-free Chewing Gum
- 9.1.2.2.1. By Sugar Content
- 9.1.3. Snack Bar
- 9.1.3.1. Cereal Bar
- 9.1.3.2. Fruit & Nut Bar
- 9.1.3.3. Protein Bar
- 9.1.4. Sugar Confectionery
- 9.1.4.1. Hard Candy
- 9.1.4.2. Lollipops
- 9.1.4.3. Mints
- 9.1.4.4. Pastilles, Gummies, and Jellies
- 9.1.4.5. Toffees and Nougats
- 9.1.4.6. Others
- 9.1.1. Chocolate
- 9.2. Market Analysis, Insights and Forecast - by Distribution Channel
- 9.2.1. Convenience Store
- 9.2.2. Online Retail Store
- 9.2.3. Supermarket/Hypermarket
- 9.2.4. Others
- 9.1. Market Analysis, Insights and Forecast - by Confections
- 10. Asia Pacific Confectionery Industry Analysis, Insights and Forecast, 2019-2031
- 10.1. Market Analysis, Insights and Forecast - by Confections
- 10.1.1. Chocolate
- 10.1.1.1. By Confectionery Variant
- 10.1.1.1.1. Dark Chocolate
- 10.1.1.1.2. Milk and White Chocolate
- 10.1.1.1. By Confectionery Variant
- 10.1.2. Gums
- 10.1.2.1. Bubble Gum
- 10.1.2.2. Chewing Gum
- 10.1.2.2.1. By Sugar Content
- 10.1.2.2.1.1. Sugar Chewing Gum
- 10.1.2.2.1.2. Sugar-free Chewing Gum
- 10.1.2.2.1. By Sugar Content
- 10.1.3. Snack Bar
- 10.1.3.1. Cereal Bar
- 10.1.3.2. Fruit & Nut Bar
- 10.1.3.3. Protein Bar
- 10.1.4. Sugar Confectionery
- 10.1.4.1. Hard Candy
- 10.1.4.2. Lollipops
- 10.1.4.3. Mints
- 10.1.4.4. Pastilles, Gummies, and Jellies
- 10.1.4.5. Toffees and Nougats
- 10.1.4.6. Others
- 10.1.1. Chocolate
- 10.2. Market Analysis, Insights and Forecast - by Distribution Channel
- 10.2.1. Convenience Store
- 10.2.2. Online Retail Store
- 10.2.3. Supermarket/Hypermarket
- 10.2.4. Others
- 10.1. Market Analysis, Insights and Forecast - by Confections
- 11. North America Confectionery Industry Analysis, Insights and Forecast, 2019-2031
- 11.1. Market Analysis, Insights and Forecast - By Country/Sub-region
- 11.1.1 United States
- 11.1.2 Canada
- 11.1.3 Mexico
- 11.1.4 Rest of North America
- 12. Europe Confectionery Industry Analysis, Insights and Forecast, 2019-2031
- 12.1. Market Analysis, Insights and Forecast - By Country/Sub-region
- 12.1.1 Germany
- 12.1.2 France
- 12.1.3 Italy
- 12.1.4 United Kingdom
- 12.1.5 Netherlands
- 12.1.6 Sweden
- 12.1.7 Rest of Europe
- 13. Asia Pacific Confectionery Industry Analysis, Insights and Forecast, 2019-2031
- 13.1. Market Analysis, Insights and Forecast - By Country/Sub-region
- 13.1.1 China
- 13.1.2 India
- 13.1.3 Japan
- 13.1.4 South Korea
- 13.1.5 Rest of Asia Pacific
- 14. South America Confectionery Industry Analysis, Insights and Forecast, 2019-2031
- 14.1. Market Analysis, Insights and Forecast - By Country/Sub-region
- 14.1.1 Brazil
- 14.1.2 Argentina
- 14.1.3 Rest of South America
- 15. Middle East Confectionery Industry Analysis, Insights and Forecast, 2019-2031
- 15.1. Market Analysis, Insights and Forecast - By Country/Sub-region
- 15.1.1 Middle East
- 15.1.2 Africa
- 16. Competitive Analysis
- 16.1. Global Market Share Analysis 2024
- 16.2. Company Profiles
- 16.2.1 Nestlé SA
- 16.2.1.1. Overview
- 16.2.1.2. Products
- 16.2.1.3. SWOT Analysis
- 16.2.1.4. Recent Developments
- 16.2.1.5. Financials (Based on Availability)
- 16.2.2 Chocoladefabriken Lindt & Sprüngli AG
- 16.2.2.1. Overview
- 16.2.2.2. Products
- 16.2.2.3. SWOT Analysis
- 16.2.2.4. Recent Developments
- 16.2.2.5. Financials (Based on Availability)
- 16.2.3 Perfetti Van Melle BV
- 16.2.3.1. Overview
- 16.2.3.2. Products
- 16.2.3.3. SWOT Analysis
- 16.2.3.4. Recent Developments
- 16.2.3.5. Financials (Based on Availability)
- 16.2.4 General Mills Inc
- 16.2.4.1. Overview
- 16.2.4.2. Products
- 16.2.4.3. SWOT Analysis
- 16.2.4.4. Recent Developments
- 16.2.4.5. Financials (Based on Availability)
- 16.2.5 PepsiCo Inc
- 16.2.5.1. Overview
- 16.2.5.2. Products
- 16.2.5.3. SWOT Analysis
- 16.2.5.4. Recent Developments
- 16.2.5.5. Financials (Based on Availability)
- 16.2.6 August Storck KG
- 16.2.6.1. Overview
- 16.2.6.2. Products
- 16.2.6.3. SWOT Analysis
- 16.2.6.4. Recent Developments
- 16.2.6.5. Financials (Based on Availability)
- 16.2.7 Ferrero International SA
- 16.2.7.1. Overview
- 16.2.7.2. Products
- 16.2.7.3. SWOT Analysis
- 16.2.7.4. Recent Developments
- 16.2.7.5. Financials (Based on Availability)
- 16.2.8 Mars Incorporated
- 16.2.8.1. Overview
- 16.2.8.2. Products
- 16.2.8.3. SWOT Analysis
- 16.2.8.4. Recent Developments
- 16.2.8.5. Financials (Based on Availability)
- 16.2.9 Yıldız Holding A
- 16.2.9.1. Overview
- 16.2.9.2. Products
- 16.2.9.3. SWOT Analysis
- 16.2.9.4. Recent Developments
- 16.2.9.5. Financials (Based on Availability)
- 16.2.10 Lotte Corporation
- 16.2.10.1. Overview
- 16.2.10.2. Products
- 16.2.10.3. SWOT Analysis
- 16.2.10.4. Recent Developments
- 16.2.10.5. Financials (Based on Availability)
- 16.2.11 HARIBO Holding GmbH & Co KG
- 16.2.11.1. Overview
- 16.2.11.2. Products
- 16.2.11.3. SWOT Analysis
- 16.2.11.4. Recent Developments
- 16.2.11.5. Financials (Based on Availability)
- 16.2.12 Mondelēz International Inc
- 16.2.12.1. Overview
- 16.2.12.2. Products
- 16.2.12.3. SWOT Analysis
- 16.2.12.4. Recent Developments
- 16.2.12.5. Financials (Based on Availability)
- 16.2.13 Meiji Holdings Company Ltd
- 16.2.13.1. Overview
- 16.2.13.2. Products
- 16.2.13.3. SWOT Analysis
- 16.2.13.4. Recent Developments
- 16.2.13.5. Financials (Based on Availability)
- 16.2.14 The Hershey Company
- 16.2.14.1. Overview
- 16.2.14.2. Products
- 16.2.14.3. SWOT Analysis
- 16.2.14.4. Recent Developments
- 16.2.14.5. Financials (Based on Availability)
- 16.2.15 Kellogg Company
- 16.2.15.1. Overview
- 16.2.15.2. Products
- 16.2.15.3. SWOT Analysis
- 16.2.15.4. Recent Developments
- 16.2.15.5. Financials (Based on Availability)
- 16.2.1 Nestlé SA
List of Figures
- Figure 1: Global Confectionery Industry Revenue Breakdown (Million, %) by Region 2024 & 2032
- Figure 2: Global Confectionery Industry Volume Breakdown (K Tons, %) by Region 2024 & 2032
- Figure 3: North America Confectionery Industry Revenue (Million), by Country 2024 & 2032
- Figure 4: North America Confectionery Industry Volume (K Tons), by Country 2024 & 2032
- Figure 5: North America Confectionery Industry Revenue Share (%), by Country 2024 & 2032
- Figure 6: North America Confectionery Industry Volume Share (%), by Country 2024 & 2032
- Figure 7: Europe Confectionery Industry Revenue (Million), by Country 2024 & 2032
- Figure 8: Europe Confectionery Industry Volume (K Tons), by Country 2024 & 2032
- Figure 9: Europe Confectionery Industry Revenue Share (%), by Country 2024 & 2032
- Figure 10: Europe Confectionery Industry Volume Share (%), by Country 2024 & 2032
- Figure 11: Asia Pacific Confectionery Industry Revenue (Million), by Country 2024 & 2032
- Figure 12: Asia Pacific Confectionery Industry Volume (K Tons), by Country 2024 & 2032
- Figure 13: Asia Pacific Confectionery Industry Revenue Share (%), by Country 2024 & 2032
- Figure 14: Asia Pacific Confectionery Industry Volume Share (%), by Country 2024 & 2032
- Figure 15: South America Confectionery Industry Revenue (Million), by Country 2024 & 2032
- Figure 16: South America Confectionery Industry Volume (K Tons), by Country 2024 & 2032
- Figure 17: South America Confectionery Industry Revenue Share (%), by Country 2024 & 2032
- Figure 18: South America Confectionery Industry Volume Share (%), by Country 2024 & 2032
- Figure 19: Middle East Confectionery Industry Revenue (Million), by Country 2024 & 2032
- Figure 20: Middle East Confectionery Industry Volume (K Tons), by Country 2024 & 2032
- Figure 21: Middle East Confectionery Industry Revenue Share (%), by Country 2024 & 2032
- Figure 22: Middle East Confectionery Industry Volume Share (%), by Country 2024 & 2032
- Figure 23: North America Confectionery Industry Revenue (Million), by Confections 2024 & 2032
- Figure 24: North America Confectionery Industry Volume (K Tons), by Confections 2024 & 2032
- Figure 25: North America Confectionery Industry Revenue Share (%), by Confections 2024 & 2032
- Figure 26: North America Confectionery Industry Volume Share (%), by Confections 2024 & 2032
- Figure 27: North America Confectionery Industry Revenue (Million), by Distribution Channel 2024 & 2032
- Figure 28: North America Confectionery Industry Volume (K Tons), by Distribution Channel 2024 & 2032
- Figure 29: North America Confectionery Industry Revenue Share (%), by Distribution Channel 2024 & 2032
- Figure 30: North America Confectionery Industry Volume Share (%), by Distribution Channel 2024 & 2032
- Figure 31: North America Confectionery Industry Revenue (Million), by Country 2024 & 2032
- Figure 32: North America Confectionery Industry Volume (K Tons), by Country 2024 & 2032
- Figure 33: North America Confectionery Industry Revenue Share (%), by Country 2024 & 2032
- Figure 34: North America Confectionery Industry Volume Share (%), by Country 2024 & 2032
- Figure 35: South America Confectionery Industry Revenue (Million), by Confections 2024 & 2032
- Figure 36: South America Confectionery Industry Volume (K Tons), by Confections 2024 & 2032
- Figure 37: South America Confectionery Industry Revenue Share (%), by Confections 2024 & 2032
- Figure 38: South America Confectionery Industry Volume Share (%), by Confections 2024 & 2032
- Figure 39: South America Confectionery Industry Revenue (Million), by Distribution Channel 2024 & 2032
- Figure 40: South America Confectionery Industry Volume (K Tons), by Distribution Channel 2024 & 2032
- Figure 41: South America Confectionery Industry Revenue Share (%), by Distribution Channel 2024 & 2032
- Figure 42: South America Confectionery Industry Volume Share (%), by Distribution Channel 2024 & 2032
- Figure 43: South America Confectionery Industry Revenue (Million), by Country 2024 & 2032
- Figure 44: South America Confectionery Industry Volume (K Tons), by Country 2024 & 2032
- Figure 45: South America Confectionery Industry Revenue Share (%), by Country 2024 & 2032
- Figure 46: South America Confectionery Industry Volume Share (%), by Country 2024 & 2032
- Figure 47: Europe Confectionery Industry Revenue (Million), by Confections 2024 & 2032
- Figure 48: Europe Confectionery Industry Volume (K Tons), by Confections 2024 & 2032
- Figure 49: Europe Confectionery Industry Revenue Share (%), by Confections 2024 & 2032
- Figure 50: Europe Confectionery Industry Volume Share (%), by Confections 2024 & 2032
- Figure 51: Europe Confectionery Industry Revenue (Million), by Distribution Channel 2024 & 2032
- Figure 52: Europe Confectionery Industry Volume (K Tons), by Distribution Channel 2024 & 2032
- Figure 53: Europe Confectionery Industry Revenue Share (%), by Distribution Channel 2024 & 2032
- Figure 54: Europe Confectionery Industry Volume Share (%), by Distribution Channel 2024 & 2032
- Figure 55: Europe Confectionery Industry Revenue (Million), by Country 2024 & 2032
- Figure 56: Europe Confectionery Industry Volume (K Tons), by Country 2024 & 2032
- Figure 57: Europe Confectionery Industry Revenue Share (%), by Country 2024 & 2032
- Figure 58: Europe Confectionery Industry Volume Share (%), by Country 2024 & 2032
- Figure 59: Middle East & Africa Confectionery Industry Revenue (Million), by Confections 2024 & 2032
- Figure 60: Middle East & Africa Confectionery Industry Volume (K Tons), by Confections 2024 & 2032
- Figure 61: Middle East & Africa Confectionery Industry Revenue Share (%), by Confections 2024 & 2032
- Figure 62: Middle East & Africa Confectionery Industry Volume Share (%), by Confections 2024 & 2032
- Figure 63: Middle East & Africa Confectionery Industry Revenue (Million), by Distribution Channel 2024 & 2032
- Figure 64: Middle East & Africa Confectionery Industry Volume (K Tons), by Distribution Channel 2024 & 2032
- Figure 65: Middle East & Africa Confectionery Industry Revenue Share (%), by Distribution Channel 2024 & 2032
- Figure 66: Middle East & Africa Confectionery Industry Volume Share (%), by Distribution Channel 2024 & 2032
- Figure 67: Middle East & Africa Confectionery Industry Revenue (Million), by Country 2024 & 2032
- Figure 68: Middle East & Africa Confectionery Industry Volume (K Tons), by Country 2024 & 2032
- Figure 69: Middle East & Africa Confectionery Industry Revenue Share (%), by Country 2024 & 2032
- Figure 70: Middle East & Africa Confectionery Industry Volume Share (%), by Country 2024 & 2032
- Figure 71: Asia Pacific Confectionery Industry Revenue (Million), by Confections 2024 & 2032
- Figure 72: Asia Pacific Confectionery Industry Volume (K Tons), by Confections 2024 & 2032
- Figure 73: Asia Pacific Confectionery Industry Revenue Share (%), by Confections 2024 & 2032
- Figure 74: Asia Pacific Confectionery Industry Volume Share (%), by Confections 2024 & 2032
- Figure 75: Asia Pacific Confectionery Industry Revenue (Million), by Distribution Channel 2024 & 2032
- Figure 76: Asia Pacific Confectionery Industry Volume (K Tons), by Distribution Channel 2024 & 2032
- Figure 77: Asia Pacific Confectionery Industry Revenue Share (%), by Distribution Channel 2024 & 2032
- Figure 78: Asia Pacific Confectionery Industry Volume Share (%), by Distribution Channel 2024 & 2032
- Figure 79: Asia Pacific Confectionery Industry Revenue (Million), by Country 2024 & 2032
- Figure 80: Asia Pacific Confectionery Industry Volume (K Tons), by Country 2024 & 2032
- Figure 81: Asia Pacific Confectionery Industry Revenue Share (%), by Country 2024 & 2032
- Figure 82: Asia Pacific Confectionery Industry Volume Share (%), by Country 2024 & 2032
List of Tables
- Table 1: Global Confectionery Industry Revenue Million Forecast, by Region 2019 & 2032
- Table 2: Global Confectionery Industry Volume K Tons Forecast, by Region 2019 & 2032
- Table 3: Global Confectionery Industry Revenue Million Forecast, by Confections 2019 & 2032
- Table 4: Global Confectionery Industry Volume K Tons Forecast, by Confections 2019 & 2032
- Table 5: Global Confectionery Industry Revenue Million Forecast, by Distribution Channel 2019 & 2032
- Table 6: Global Confectionery Industry Volume K Tons Forecast, by Distribution Channel 2019 & 2032
- Table 7: Global Confectionery Industry Revenue Million Forecast, by Region 2019 & 2032
- Table 8: Global Confectionery Industry Volume K Tons Forecast, by Region 2019 & 2032
- Table 9: Global Confectionery Industry Revenue Million Forecast, by Country 2019 & 2032
- Table 10: Global Confectionery Industry Volume K Tons Forecast, by Country 2019 & 2032
- Table 11: United States Confectionery Industry Revenue (Million) Forecast, by Application 2019 & 2032
- Table 12: United States Confectionery Industry Volume (K Tons) Forecast, by Application 2019 & 2032
- Table 13: Canada Confectionery Industry Revenue (Million) Forecast, by Application 2019 & 2032
- Table 14: Canada Confectionery Industry Volume (K Tons) Forecast, by Application 2019 & 2032
- Table 15: Mexico Confectionery Industry Revenue (Million) Forecast, by Application 2019 & 2032
- Table 16: Mexico Confectionery Industry Volume (K Tons) Forecast, by Application 2019 & 2032
- Table 17: Rest of North America Confectionery Industry Revenue (Million) Forecast, by Application 2019 & 2032
- Table 18: Rest of North America Confectionery Industry Volume (K Tons) Forecast, by Application 2019 & 2032
- Table 19: Global Confectionery Industry Revenue Million Forecast, by Country 2019 & 2032
- Table 20: Global Confectionery Industry Volume K Tons Forecast, by Country 2019 & 2032
- Table 21: Germany Confectionery Industry Revenue (Million) Forecast, by Application 2019 & 2032
- Table 22: Germany Confectionery Industry Volume (K Tons) Forecast, by Application 2019 & 2032
- Table 23: France Confectionery Industry Revenue (Million) Forecast, by Application 2019 & 2032
- Table 24: France Confectionery Industry Volume (K Tons) Forecast, by Application 2019 & 2032
- Table 25: Italy Confectionery Industry Revenue (Million) Forecast, by Application 2019 & 2032
- Table 26: Italy Confectionery Industry Volume (K Tons) Forecast, by Application 2019 & 2032
- Table 27: United Kingdom Confectionery Industry Revenue (Million) Forecast, by Application 2019 & 2032
- Table 28: United Kingdom Confectionery Industry Volume (K Tons) Forecast, by Application 2019 & 2032
- Table 29: Netherlands Confectionery Industry Revenue (Million) Forecast, by Application 2019 & 2032
- Table 30: Netherlands Confectionery Industry Volume (K Tons) Forecast, by Application 2019 & 2032
- Table 31: Sweden Confectionery Industry Revenue (Million) Forecast, by Application 2019 & 2032
- Table 32: Sweden Confectionery Industry Volume (K Tons) Forecast, by Application 2019 & 2032
- Table 33: Rest of Europe Confectionery Industry Revenue (Million) Forecast, by Application 2019 & 2032
- Table 34: Rest of Europe Confectionery Industry Volume (K Tons) Forecast, by Application 2019 & 2032
- Table 35: Global Confectionery Industry Revenue Million Forecast, by Country 2019 & 2032
- Table 36: Global Confectionery Industry Volume K Tons Forecast, by Country 2019 & 2032
- Table 37: China Confectionery Industry Revenue (Million) Forecast, by Application 2019 & 2032
- Table 38: China Confectionery Industry Volume (K Tons) Forecast, by Application 2019 & 2032
- Table 39: India Confectionery Industry Revenue (Million) Forecast, by Application 2019 & 2032
- Table 40: India Confectionery Industry Volume (K Tons) Forecast, by Application 2019 & 2032
- Table 41: Japan Confectionery Industry Revenue (Million) Forecast, by Application 2019 & 2032
- Table 42: Japan Confectionery Industry Volume (K Tons) Forecast, by Application 2019 & 2032
- Table 43: South Korea Confectionery Industry Revenue (Million) Forecast, by Application 2019 & 2032
- Table 44: South Korea Confectionery Industry Volume (K Tons) Forecast, by Application 2019 & 2032
- Table 45: Rest of Asia Pacific Confectionery Industry Revenue (Million) Forecast, by Application 2019 & 2032
- Table 46: Rest of Asia Pacific Confectionery Industry Volume (K Tons) Forecast, by Application 2019 & 2032
- Table 47: Global Confectionery Industry Revenue Million Forecast, by Country 2019 & 2032
- Table 48: Global Confectionery Industry Volume K Tons Forecast, by Country 2019 & 2032
- Table 49: Brazil Confectionery Industry Revenue (Million) Forecast, by Application 2019 & 2032
- Table 50: Brazil Confectionery Industry Volume (K Tons) Forecast, by Application 2019 & 2032
- Table 51: Argentina Confectionery Industry Revenue (Million) Forecast, by Application 2019 & 2032
- Table 52: Argentina Confectionery Industry Volume (K Tons) Forecast, by Application 2019 & 2032
- Table 53: Rest of South America Confectionery Industry Revenue (Million) Forecast, by Application 2019 & 2032
- Table 54: Rest of South America Confectionery Industry Volume (K Tons) Forecast, by Application 2019 & 2032
- Table 55: Global Confectionery Industry Revenue Million Forecast, by Country 2019 & 2032
- Table 56: Global Confectionery Industry Volume K Tons Forecast, by Country 2019 & 2032
- Table 57: Middle East Confectionery Industry Revenue (Million) Forecast, by Application 2019 & 2032
- Table 58: Middle East Confectionery Industry Volume (K Tons) Forecast, by Application 2019 & 2032
- Table 59: Africa Confectionery Industry Revenue (Million) Forecast, by Application 2019 & 2032
- Table 60: Africa Confectionery Industry Volume (K Tons) Forecast, by Application 2019 & 2032
- Table 61: Global Confectionery Industry Revenue Million Forecast, by Confections 2019 & 2032
- Table 62: Global Confectionery Industry Volume K Tons Forecast, by Confections 2019 & 2032
- Table 63: Global Confectionery Industry Revenue Million Forecast, by Distribution Channel 2019 & 2032
- Table 64: Global Confectionery Industry Volume K Tons Forecast, by Distribution Channel 2019 & 2032
- Table 65: Global Confectionery Industry Revenue Million Forecast, by Country 2019 & 2032
- Table 66: Global Confectionery Industry Volume K Tons Forecast, by Country 2019 & 2032
- Table 67: United States Confectionery Industry Revenue (Million) Forecast, by Application 2019 & 2032
- Table 68: United States Confectionery Industry Volume (K Tons) Forecast, by Application 2019 & 2032
- Table 69: Canada Confectionery Industry Revenue (Million) Forecast, by Application 2019 & 2032
- Table 70: Canada Confectionery Industry Volume (K Tons) Forecast, by Application 2019 & 2032
- Table 71: Mexico Confectionery Industry Revenue (Million) Forecast, by Application 2019 & 2032
- Table 72: Mexico Confectionery Industry Volume (K Tons) Forecast, by Application 2019 & 2032
- Table 73: Global Confectionery Industry Revenue Million Forecast, by Confections 2019 & 2032
- Table 74: Global Confectionery Industry Volume K Tons Forecast, by Confections 2019 & 2032
- Table 75: Global Confectionery Industry Revenue Million Forecast, by Distribution Channel 2019 & 2032
- Table 76: Global Confectionery Industry Volume K Tons Forecast, by Distribution Channel 2019 & 2032
- Table 77: Global Confectionery Industry Revenue Million Forecast, by Country 2019 & 2032
- Table 78: Global Confectionery Industry Volume K Tons Forecast, by Country 2019 & 2032
- Table 79: Brazil Confectionery Industry Revenue (Million) Forecast, by Application 2019 & 2032
- Table 80: Brazil Confectionery Industry Volume (K Tons) Forecast, by Application 2019 & 2032
- Table 81: Argentina Confectionery Industry Revenue (Million) Forecast, by Application 2019 & 2032
- Table 82: Argentina Confectionery Industry Volume (K Tons) Forecast, by Application 2019 & 2032
- Table 83: Rest of South America Confectionery Industry Revenue (Million) Forecast, by Application 2019 & 2032
- Table 84: Rest of South America Confectionery Industry Volume (K Tons) Forecast, by Application 2019 & 2032
- Table 85: Global Confectionery Industry Revenue Million Forecast, by Confections 2019 & 2032
- Table 86: Global Confectionery Industry Volume K Tons Forecast, by Confections 2019 & 2032
- Table 87: Global Confectionery Industry Revenue Million Forecast, by Distribution Channel 2019 & 2032
- Table 88: Global Confectionery Industry Volume K Tons Forecast, by Distribution Channel 2019 & 2032
- Table 89: Global Confectionery Industry Revenue Million Forecast, by Country 2019 & 2032
- Table 90: Global Confectionery Industry Volume K Tons Forecast, by Country 2019 & 2032
- Table 91: United Kingdom Confectionery Industry Revenue (Million) Forecast, by Application 2019 & 2032
- Table 92: United Kingdom Confectionery Industry Volume (K Tons) Forecast, by Application 2019 & 2032
- Table 93: Germany Confectionery Industry Revenue (Million) Forecast, by Application 2019 & 2032
- Table 94: Germany Confectionery Industry Volume (K Tons) Forecast, by Application 2019 & 2032
- Table 95: France Confectionery Industry Revenue (Million) Forecast, by Application 2019 & 2032
- Table 96: France Confectionery Industry Volume (K Tons) Forecast, by Application 2019 & 2032
- Table 97: Italy Confectionery Industry Revenue (Million) Forecast, by Application 2019 & 2032
- Table 98: Italy Confectionery Industry Volume (K Tons) Forecast, by Application 2019 & 2032
- Table 99: Spain Confectionery Industry Revenue (Million) Forecast, by Application 2019 & 2032
- Table 100: Spain Confectionery Industry Volume (K Tons) Forecast, by Application 2019 & 2032
- Table 101: Russia Confectionery Industry Revenue (Million) Forecast, by Application 2019 & 2032
- Table 102: Russia Confectionery Industry Volume (K Tons) Forecast, by Application 2019 & 2032
- Table 103: Benelux Confectionery Industry Revenue (Million) Forecast, by Application 2019 & 2032
- Table 104: Benelux Confectionery Industry Volume (K Tons) Forecast, by Application 2019 & 2032
- Table 105: Nordics Confectionery Industry Revenue (Million) Forecast, by Application 2019 & 2032
- Table 106: Nordics Confectionery Industry Volume (K Tons) Forecast, by Application 2019 & 2032
- Table 107: Rest of Europe Confectionery Industry Revenue (Million) Forecast, by Application 2019 & 2032
- Table 108: Rest of Europe Confectionery Industry Volume (K Tons) Forecast, by Application 2019 & 2032
- Table 109: Global Confectionery Industry Revenue Million Forecast, by Confections 2019 & 2032
- Table 110: Global Confectionery Industry Volume K Tons Forecast, by Confections 2019 & 2032
- Table 111: Global Confectionery Industry Revenue Million Forecast, by Distribution Channel 2019 & 2032
- Table 112: Global Confectionery Industry Volume K Tons Forecast, by Distribution Channel 2019 & 2032
- Table 113: Global Confectionery Industry Revenue Million Forecast, by Country 2019 & 2032
- Table 114: Global Confectionery Industry Volume K Tons Forecast, by Country 2019 & 2032
- Table 115: Turkey Confectionery Industry Revenue (Million) Forecast, by Application 2019 & 2032
- Table 116: Turkey Confectionery Industry Volume (K Tons) Forecast, by Application 2019 & 2032
- Table 117: Israel Confectionery Industry Revenue (Million) Forecast, by Application 2019 & 2032
- Table 118: Israel Confectionery Industry Volume (K Tons) Forecast, by Application 2019 & 2032
- Table 119: GCC Confectionery Industry Revenue (Million) Forecast, by Application 2019 & 2032
- Table 120: GCC Confectionery Industry Volume (K Tons) Forecast, by Application 2019 & 2032
- Table 121: North Africa Confectionery Industry Revenue (Million) Forecast, by Application 2019 & 2032
- Table 122: North Africa Confectionery Industry Volume (K Tons) Forecast, by Application 2019 & 2032
- Table 123: South Africa Confectionery Industry Revenue (Million) Forecast, by Application 2019 & 2032
- Table 124: South Africa Confectionery Industry Volume (K Tons) Forecast, by Application 2019 & 2032
- Table 125: Rest of Middle East & Africa Confectionery Industry Revenue (Million) Forecast, by Application 2019 & 2032
- Table 126: Rest of Middle East & Africa Confectionery Industry Volume (K Tons) Forecast, by Application 2019 & 2032
- Table 127: Global Confectionery Industry Revenue Million Forecast, by Confections 2019 & 2032
- Table 128: Global Confectionery Industry Volume K Tons Forecast, by Confections 2019 & 2032
- Table 129: Global Confectionery Industry Revenue Million Forecast, by Distribution Channel 2019 & 2032
- Table 130: Global Confectionery Industry Volume K Tons Forecast, by Distribution Channel 2019 & 2032
- Table 131: Global Confectionery Industry Revenue Million Forecast, by Country 2019 & 2032
- Table 132: Global Confectionery Industry Volume K Tons Forecast, by Country 2019 & 2032
- Table 133: China Confectionery Industry Revenue (Million) Forecast, by Application 2019 & 2032
- Table 134: China Confectionery Industry Volume (K Tons) Forecast, by Application 2019 & 2032
- Table 135: India Confectionery Industry Revenue (Million) Forecast, by Application 2019 & 2032
- Table 136: India Confectionery Industry Volume (K Tons) Forecast, by Application 2019 & 2032
- Table 137: Japan Confectionery Industry Revenue (Million) Forecast, by Application 2019 & 2032
- Table 138: Japan Confectionery Industry Volume (K Tons) Forecast, by Application 2019 & 2032
- Table 139: South Korea Confectionery Industry Revenue (Million) Forecast, by Application 2019 & 2032
- Table 140: South Korea Confectionery Industry Volume (K Tons) Forecast, by Application 2019 & 2032
- Table 141: ASEAN Confectionery Industry Revenue (Million) Forecast, by Application 2019 & 2032
- Table 142: ASEAN Confectionery Industry Volume (K Tons) Forecast, by Application 2019 & 2032
- Table 143: Oceania Confectionery Industry Revenue (Million) Forecast, by Application 2019 & 2032
- Table 144: Oceania Confectionery Industry Volume (K Tons) Forecast, by Application 2019 & 2032
- Table 145: Rest of Asia Pacific Confectionery Industry Revenue (Million) Forecast, by Application 2019 & 2032
- Table 146: Rest of Asia Pacific Confectionery Industry Volume (K Tons) Forecast, by Application 2019 & 2032
Frequently Asked Questions
1. What is the projected Compound Annual Growth Rate (CAGR) of the Confectionery Industry?
The projected CAGR is approximately 4.69%.
2. Which companies are prominent players in the Confectionery Industry?
Key companies in the market include Nestlé SA, Chocoladefabriken Lindt & Sprüngli AG, Perfetti Van Melle BV, General Mills Inc, PepsiCo Inc, August Storck KG, Ferrero International SA, Mars Incorporated, Yıldız Holding A, Lotte Corporation, HARIBO Holding GmbH & Co KG, Mondelēz International Inc, Meiji Holdings Company Ltd, The Hershey Company, Kellogg Company.
3. What are the main segments of the Confectionery Industry?
The market segments include Confections, Distribution Channel.
4. Can you provide details about the market size?
The market size is estimated to be USD 229480 Million as of 2022.
5. What are some drivers contributing to market growth?
Increased Consumption of Baked Goods; Demand for Indigenous Fermented Foods.
6. What are the notable trends driving market growth?
OTHER KEY INDUSTRY TRENDS COVERED IN THE REPORT.
7. Are there any restraints impacting market growth?
Potential Side-effects of Yeast.
8. Can you provide examples of recent developments in the market?
August 2023: Ferrero North America, in the United States, revealed new products and seasonal offerings, including Kinder Chocolate, at the Annual Sweets & Snacks Expo in Chicago.July 2023: HARIBO® officially began gummi production at its first-ever North American manufacturing facility, located in Pleasant Prairie, Wis. The brand-new, state-of-the-art factory was created to meet the growing demand by US consumers of the beloved gummi brand, which produces over 25 varieties of gummi treats in the US and more than 1,200 types globally.July 2023: Ferrero's sister company, Ferrara Candy Co., announced the acquisition of Brazilian snacks company Dori Alimentos, which sells a variety of chocolate and sugar confectionery brands, including Dori, Pettiz, and Jubes.
9. What pricing options are available for accessing the report?
Pricing options include single-user, multi-user, and enterprise licenses priced at USD 3800, USD 4500, and USD 5800 respectively.
10. Is the market size provided in terms of value or volume?
The market size is provided in terms of value, measured in Million and volume, measured in K Tons.
11. Are there any specific market keywords associated with the report?
Yes, the market keyword associated with the report is "Confectionery Industry," which aids in identifying and referencing the specific market segment covered.
12. How do I determine which pricing option suits my needs best?
The pricing options vary based on user requirements and access needs. Individual users may opt for single-user licenses, while businesses requiring broader access may choose multi-user or enterprise licenses for cost-effective access to the report.
13. Are there any additional resources or data provided in the Confectionery Industry report?
While the report offers comprehensive insights, it's advisable to review the specific contents or supplementary materials provided to ascertain if additional resources or data are available.
14. How can I stay updated on further developments or reports in the Confectionery Industry?
To stay informed about further developments, trends, and reports in the Confectionery Industry, consider subscribing to industry newsletters, following relevant companies and organizations, or regularly checking reputable industry news sources and publications.
Methodology
Step 1 - Identification of Relevant Samples Size from Population Database


Step 2 - Approaches for Defining Global Market Size (Value, Volume* & Price*)

Note*: In applicable scenarios
Step 3 - Data Sources
Primary Research
- Web Analytics
- Survey Reports
- Research Institute
- Latest Research Reports
- Opinion Leaders
Secondary Research
- Annual Reports
- White Paper
- Latest Press Release
- Industry Association
- Paid Database
- Investor Presentations

Step 4 - Data Triangulation
Involves using different sources of information in order to increase the validity of a study
These sources are likely to be stakeholders in a program - participants, other researchers, program staff, other community members, and so on.
Then we put all data in single framework & apply various statistical tools to find out the dynamic on the market.
During the analysis stage, feedback from the stakeholder groups would be compared to determine areas of agreement as well as areas of divergence
