

Key Insights
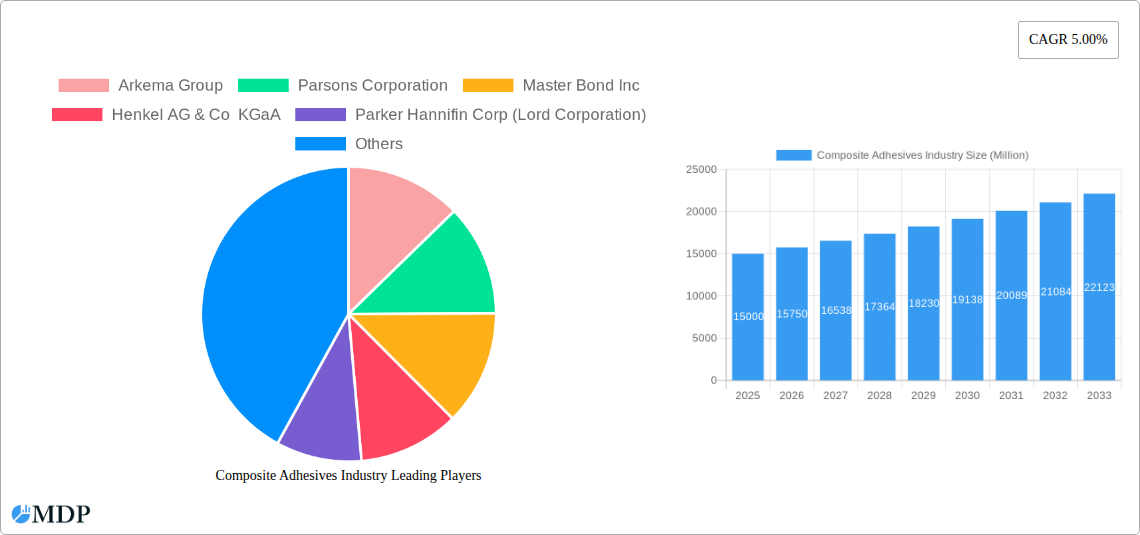
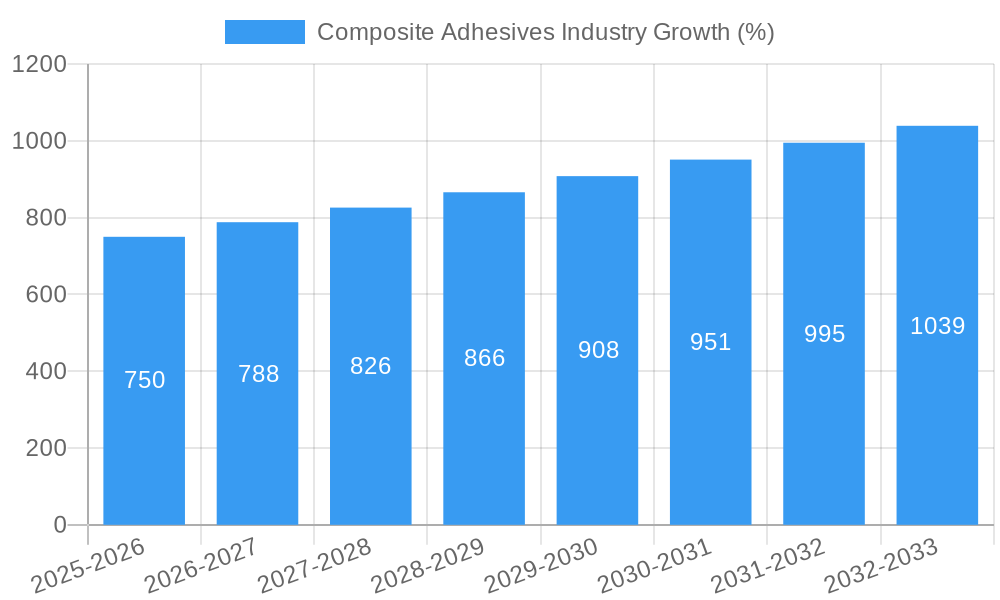
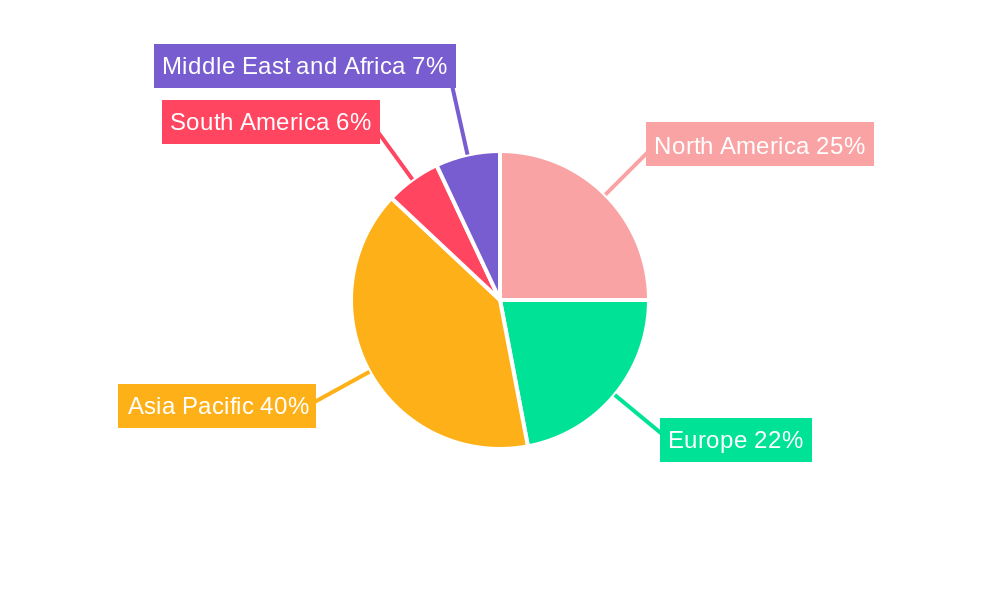
The global composite adhesives market is experiencing robust growth, projected to reach a substantial size driven by increasing demand across diverse sectors. A compound annual growth rate (CAGR) of 5.00% from 2019 to 2024 indicates a consistent upward trajectory. This expansion is fueled by several key factors. The burgeoning construction and infrastructure sectors globally are major contributors, requiring high-performance adhesives for bonding composite materials in buildings, bridges, and other structures. Similarly, the automotive and transportation industries utilize composite adhesives extensively for lightweighting vehicles and improving fuel efficiency. The growing electronics and renewable energy sectors also contribute significantly, with composite adhesives playing crucial roles in wind turbine blade construction and advanced electronic device assembly. Technological advancements in adhesive formulations, such as the development of higher-strength, more durable, and environmentally friendly options (e.g., bio-based adhesives), further propel market growth. The market segmentation reveals a strong preference for epoxy and polyurethane resins due to their versatility and performance characteristics. While the Asia-Pacific region currently dominates due to rapid industrialization and infrastructure development, North America and Europe maintain significant market shares, driven by strong demand from established industries. However, challenges remain, including fluctuating raw material prices and potential environmental regulations impacting the use of certain resin types.
Despite these challenges, the forecast period (2025-2033) anticipates sustained market expansion. The ongoing shift towards sustainable construction practices and increasing adoption of lightweight materials in various industries will continue to fuel demand. Furthermore, emerging applications in areas such as aerospace and medical devices promise further market growth. Key players are actively engaged in research and development, focusing on improving adhesive properties and expanding product portfolios to cater to evolving market needs. Strategic partnerships and mergers and acquisitions are likely to shape the competitive landscape, leading to greater innovation and market consolidation. The market's regional distribution is expected to remain relatively stable, with Asia-Pacific maintaining its leading position, followed by North America and Europe. However, growth in emerging economies in South America, the Middle East, and Africa is anticipated to increase their market share over the forecast period.
Dive Deep into the Thriving Composite Adhesives Market: A Comprehensive Industry Report (2019-2033)
This comprehensive report offers an in-depth analysis of the global Composite Adhesives industry, providing invaluable insights for stakeholders, investors, and industry professionals. With a meticulous study period spanning 2019-2033, including a base year of 2025 and a forecast period of 2025-2033, this report unveils the market's dynamics, trends, and future trajectory. The report covers a market valued at xx Million in 2025, projected to reach xx Million by 2033, exhibiting a compelling CAGR of xx%.
Composite Adhesives Industry Market Dynamics & Concentration
The global composite adhesives market is characterized by a moderately concentrated landscape with key players holding significant market share. Arkema Group, Henkel AG & Co KGaA, 3M, Sika AG, and others, command a substantial portion of the market. The level of concentration is influenced by factors such as economies of scale in production, strong brand recognition, and extensive distribution networks. However, the market is also witnessing increased competition from smaller, specialized players focusing on niche applications and innovative product offerings.
Market dynamics are primarily driven by continuous innovation in adhesive technology, stringent regulatory frameworks related to environmental compliance and product safety, and the emergence of substitute materials. The increasing demand for lightweight, high-strength materials across various end-use industries, coupled with the growing adoption of advanced manufacturing techniques (e.g., automation and robotics), fuels market growth. Significant M&A activity in recent years, with approximately xx deals recorded between 2019 and 2024, reflects the industry's consolidation trend and the quest for enhanced market presence.
- Market Share: Top 5 players hold approximately xx% of the global market.
- M&A Activity: xx deals recorded between 2019 and 2024.
- Innovation Drivers: Development of high-performance adhesives, eco-friendly formulations, and automation in application processes.
- Regulatory Frameworks: Stringent regulations concerning VOC emissions and hazardous substance content.
- Product Substitutes: Competition from alternative bonding technologies, including welding and mechanical fastening.
Composite Adhesives Industry Industry Trends & Analysis
The composite adhesives market is experiencing robust growth driven by several key trends. The increasing demand for lightweight and high-performance materials in the automotive and aerospace industries is a major catalyst. This trend is further amplified by the growing adoption of renewable energy sources, requiring innovative adhesive solutions for efficient and durable wind turbine components and solar panel installations. Technological advancements, such as the development of advanced resin systems (e.g., high-temperature resistant, UV-curable adhesives) and innovative application methods, also significantly impact the market trajectory. Consumer preferences for sustainable and environmentally friendly products are pushing manufacturers towards the development of bio-based and recyclable composite adhesives. Competitive dynamics are shaped by ongoing product differentiation, strategic partnerships, and geographical expansion strategies.
Leading Markets & Segments in Composite Adhesives Industry
The Building & Construction segment holds the largest market share within the end-user industry, fueled by infrastructure development projects globally. The automotive and transportation sector demonstrates high growth potential due to the increasing demand for lightweight vehicles to enhance fuel efficiency. Within resin types, Epoxy adhesives currently dominate the market owing to their versatility and superior performance characteristics. However, Polyurethane and Acrylic adhesives are gaining traction, driven by their specific advantages in certain applications (e.g., flexibility, UV resistance).
Dominant Region: North America and Europe currently hold the largest market share. Asia-Pacific is anticipated to experience the fastest growth in the forecast period.
Key Drivers (Building & Construction): Growing urbanization, infrastructure development investments, and government initiatives to promote sustainable construction practices.
Key Drivers (Automotive): Increasing demand for fuel-efficient vehicles, stringent emission regulations, and growing adoption of lightweight materials.
Key Drivers (Epoxy Resin): Superior bonding strength, excellent chemical resistance, and suitability for diverse applications.
Dominant Segment Analysis: The dominance of the Building & Construction segment is attributed to the significant investment in infrastructure globally. The automotive sector is expected to experience faster growth due to factors such as the increased demand for fuel-efficient and lightweight vehicles. The growth in the use of epoxy resins is primarily attributed to their versatility and performance characteristics, although other resins like polyurethane and acrylic show potential.
Composite Adhesives Industry Product Developments
Recent years have witnessed a surge in the development of high-performance composite adhesives with enhanced properties such as improved durability, increased thermal resistance, and better resistance to environmental factors (e.g., UV degradation, moisture). This includes the introduction of bio-based adhesives and adhesives designed for specific applications within sectors like aerospace, wind energy, and electronics. These developments reflect the market's response to evolving demands for sustainable and high-performance solutions. The competitive advantage is being increasingly determined by the ability to offer tailored solutions and efficient application technologies.
Key Drivers of Composite Adhesives Industry Growth
The growth of the composite adhesives market is propelled by several key factors. Technological advancements in adhesive chemistry are leading to the development of improved products with enhanced properties. Government regulations promoting sustainable materials and efficient manufacturing processes are driving the demand for environmentally friendly adhesives. Furthermore, the increasing adoption of composite materials across various industries, including automotive, aerospace, and renewable energy, is a primary growth catalyst.
Challenges in the Composite Adhesives Industry Market
The composite adhesives market faces several challenges, including fluctuating raw material prices and supply chain disruptions. The industry also navigates stringent regulatory requirements concerning environmental compliance and worker safety. Intense competition from established players and the emergence of new entrants add to the complexity of the market. These challenges necessitate continuous innovation, efficient supply chain management, and adherence to regulatory standards to ensure sustained profitability.
Emerging Opportunities in Composite Adhesives Industry
The composite adhesives industry presents significant opportunities for growth. Emerging technologies, such as 3D printing and advanced manufacturing techniques, are creating new avenues for application and market expansion. Strategic collaborations and mergers and acquisitions are enabling companies to leverage technological advancements and expand their market reach. The increasing focus on sustainability and the development of bio-based adhesives present compelling opportunities for environmentally conscious manufacturers.
Leading Players in the Composite Adhesives Industry Sector
- Arkema Group
- Parsons Corporation
- Master Bond Inc
- Henkel AG & Co KGaA
- Parker Hannifin Corp (Lord Corporation)
- Pidilite Industries Ltd
- Sika AG
- Permabond LLC
- H B Fuller Company
- 3M
Key Milestones in Composite Adhesives Industry Industry
- 2020: Introduction of a new generation of high-temperature resistant epoxy adhesive by Henkel.
- 2021: Acquisition of a smaller adhesive manufacturer by Sika, expanding its product portfolio.
- 2022: Launch of a bio-based polyurethane adhesive by Arkema, focusing on sustainability.
- 2023: Development of a new UV-curable adhesive technology by 3M, enhancing application speed and efficiency.
Strategic Outlook for Composite Adhesives Industry Market
The composite adhesives market holds significant potential for future growth. Continued innovation in adhesive technology, coupled with the increasing adoption of composite materials in diverse industries, will drive market expansion. Strategic alliances, investments in R&D, and aggressive expansion strategies will be crucial for companies to capitalize on emerging opportunities and achieve sustainable growth in this dynamic market.
Composite Adhesives Industry Segmentation
-
1. Resin Type
- 1.1. Epoxy
- 1.2. Polyurethane
- 1.3. Acrylic
- 1.4. Cyanoacrylate
- 1.5. Other Resin Types
-
2. End-user Industry
- 2.1. Building and Construction
- 2.2. Electrical and Electronics
- 2.3. Energy
- 2.4. Automotive and Transportation
- 2.5. Healthcare
- 2.6. Other End-user Industries
Composite Adhesives Industry Segmentation By Geography
-
1. Asia Pacific
- 1.1. China
- 1.2. India
- 1.3. Japan
- 1.4. South Korea
- 1.5. Malaysia
- 1.6. Thailand
- 1.7. Indonesia
- 1.8. Vietnam
- 1.9. Rest of Asia Pacific
-
2. North America
- 2.1. United States
- 2.2. Canada
- 2.3. Mexico
-
3. Europe
- 3.1. Germany
- 3.2. United Kingdom
- 3.3. Italy
- 3.4. France
- 3.5. Spain
- 3.6. NORDIC Countries
- 3.7. Turkey
- 3.8. Russia
- 3.9. Rest of Europe
-
4. South America
- 4.1. Brazil
- 4.2. Argentina
- 4.3. Colombia
- 4.4. Rest of South America
-
5. Middle East and Africa
- 5.1. Saudi Arabia
- 5.2. South Africa
- 5.3. Nigeria
- 5.4. Qatar
- 5.5. Egypt
- 5.6. United Arab Emirates
- 5.7. Rest of Middle East and Africa
Composite Adhesives Industry REPORT HIGHLIGHTS
| Aspects | Details |
|---|---|
| Study Period | 2019-2033 |
| Base Year | 2024 |
| Estimated Year | 2025 |
| Forecast Period | 2025-2033 |
| Historical Period | 2019-2024 |
| Growth Rate | CAGR of 5.00% from 2019-2033 |
| Segmentation |
|
Table of Contents
- 1. Introduction
- 1.1. Research Scope
- 1.2. Market Segmentation
- 1.3. Research Methodology
- 1.4. Definitions and Assumptions
- 2. Executive Summary
- 2.1. Introduction
- 3. Market Dynamics
- 3.1. Introduction
- 3.2. Market Drivers
- 3.2.1. ; Increasing Demand for Adhesives over Conventional Binding Techniques; Other Driver
- 3.3. Market Restrains
- 3.3.1. ; Slowdown in Global Automotive Production; Other Restraint
- 3.4. Market Trends
- 3.4.1. Increasing Demand for Epoxy Resin Type
- 4. Market Factor Analysis
- 4.1. Porters Five Forces
- 4.2. Supply/Value Chain
- 4.3. PESTEL analysis
- 4.4. Market Entropy
- 4.5. Patent/Trademark Analysis
- 5. Global Composite Adhesives Industry Analysis, Insights and Forecast, 2019-2031
- 5.1. Market Analysis, Insights and Forecast - by Resin Type
- 5.1.1. Epoxy
- 5.1.2. Polyurethane
- 5.1.3. Acrylic
- 5.1.4. Cyanoacrylate
- 5.1.5. Other Resin Types
- 5.2. Market Analysis, Insights and Forecast - by End-user Industry
- 5.2.1. Building and Construction
- 5.2.2. Electrical and Electronics
- 5.2.3. Energy
- 5.2.4. Automotive and Transportation
- 5.2.5. Healthcare
- 5.2.6. Other End-user Industries
- 5.3. Market Analysis, Insights and Forecast - by Region
- 5.3.1. Asia Pacific
- 5.3.2. North America
- 5.3.3. Europe
- 5.3.4. South America
- 5.3.5. Middle East and Africa
- 5.1. Market Analysis, Insights and Forecast - by Resin Type
- 6. Asia Pacific Composite Adhesives Industry Analysis, Insights and Forecast, 2019-2031
- 6.1. Market Analysis, Insights and Forecast - by Resin Type
- 6.1.1. Epoxy
- 6.1.2. Polyurethane
- 6.1.3. Acrylic
- 6.1.4. Cyanoacrylate
- 6.1.5. Other Resin Types
- 6.2. Market Analysis, Insights and Forecast - by End-user Industry
- 6.2.1. Building and Construction
- 6.2.2. Electrical and Electronics
- 6.2.3. Energy
- 6.2.4. Automotive and Transportation
- 6.2.5. Healthcare
- 6.2.6. Other End-user Industries
- 6.1. Market Analysis, Insights and Forecast - by Resin Type
- 7. North America Composite Adhesives Industry Analysis, Insights and Forecast, 2019-2031
- 7.1. Market Analysis, Insights and Forecast - by Resin Type
- 7.1.1. Epoxy
- 7.1.2. Polyurethane
- 7.1.3. Acrylic
- 7.1.4. Cyanoacrylate
- 7.1.5. Other Resin Types
- 7.2. Market Analysis, Insights and Forecast - by End-user Industry
- 7.2.1. Building and Construction
- 7.2.2. Electrical and Electronics
- 7.2.3. Energy
- 7.2.4. Automotive and Transportation
- 7.2.5. Healthcare
- 7.2.6. Other End-user Industries
- 7.1. Market Analysis, Insights and Forecast - by Resin Type
- 8. Europe Composite Adhesives Industry Analysis, Insights and Forecast, 2019-2031
- 8.1. Market Analysis, Insights and Forecast - by Resin Type
- 8.1.1. Epoxy
- 8.1.2. Polyurethane
- 8.1.3. Acrylic
- 8.1.4. Cyanoacrylate
- 8.1.5. Other Resin Types
- 8.2. Market Analysis, Insights and Forecast - by End-user Industry
- 8.2.1. Building and Construction
- 8.2.2. Electrical and Electronics
- 8.2.3. Energy
- 8.2.4. Automotive and Transportation
- 8.2.5. Healthcare
- 8.2.6. Other End-user Industries
- 8.1. Market Analysis, Insights and Forecast - by Resin Type
- 9. South America Composite Adhesives Industry Analysis, Insights and Forecast, 2019-2031
- 9.1. Market Analysis, Insights and Forecast - by Resin Type
- 9.1.1. Epoxy
- 9.1.2. Polyurethane
- 9.1.3. Acrylic
- 9.1.4. Cyanoacrylate
- 9.1.5. Other Resin Types
- 9.2. Market Analysis, Insights and Forecast - by End-user Industry
- 9.2.1. Building and Construction
- 9.2.2. Electrical and Electronics
- 9.2.3. Energy
- 9.2.4. Automotive and Transportation
- 9.2.5. Healthcare
- 9.2.6. Other End-user Industries
- 9.1. Market Analysis, Insights and Forecast - by Resin Type
- 10. Middle East and Africa Composite Adhesives Industry Analysis, Insights and Forecast, 2019-2031
- 10.1. Market Analysis, Insights and Forecast - by Resin Type
- 10.1.1. Epoxy
- 10.1.2. Polyurethane
- 10.1.3. Acrylic
- 10.1.4. Cyanoacrylate
- 10.1.5. Other Resin Types
- 10.2. Market Analysis, Insights and Forecast - by End-user Industry
- 10.2.1. Building and Construction
- 10.2.2. Electrical and Electronics
- 10.2.3. Energy
- 10.2.4. Automotive and Transportation
- 10.2.5. Healthcare
- 10.2.6. Other End-user Industries
- 10.1. Market Analysis, Insights and Forecast - by Resin Type
- 11. Asia Pacific Composite Adhesives Industry Analysis, Insights and Forecast, 2019-2031
- 11.1. Market Analysis, Insights and Forecast - By Country/Sub-region
- 11.1.1 China
- 11.1.2 India
- 11.1.3 Japan
- 11.1.4 South Korea
- 11.1.5 Rest of Asia Pacific
- 12. North America Composite Adhesives Industry Analysis, Insights and Forecast, 2019-2031
- 12.1. Market Analysis, Insights and Forecast - By Country/Sub-region
- 12.1.1 United States
- 12.1.2 Canada
- 12.1.3 Mexico
- 13. Europe Composite Adhesives Industry Analysis, Insights and Forecast, 2019-2031
- 13.1. Market Analysis, Insights and Forecast - By Country/Sub-region
- 13.1.1 Germany
- 13.1.2 United Kingdom
- 13.1.3 Italy
- 13.1.4 France
- 13.1.5 Rest of Europe
- 14. South America Composite Adhesives Industry Analysis, Insights and Forecast, 2019-2031
- 14.1. Market Analysis, Insights and Forecast - By Country/Sub-region
- 14.1.1 Brazil
- 14.1.2 Argentina
- 14.1.3 Rest of South America
- 15. Middle East and Africa Composite Adhesives Industry Analysis, Insights and Forecast, 2019-2031
- 15.1. Market Analysis, Insights and Forecast - By Country/Sub-region
- 15.1.1 Saudi Arabia
- 15.1.2 South Africa
- 15.1.3 Rest of Middle East and Africa
- 16. Competitive Analysis
- 16.1. Global Market Share Analysis 2024
- 16.2. Company Profiles
- 16.2.1 Arkema Group
- 16.2.1.1. Overview
- 16.2.1.2. Products
- 16.2.1.3. SWOT Analysis
- 16.2.1.4. Recent Developments
- 16.2.1.5. Financials (Based on Availability)
- 16.2.2 Parsons Corporation
- 16.2.2.1. Overview
- 16.2.2.2. Products
- 16.2.2.3. SWOT Analysis
- 16.2.2.4. Recent Developments
- 16.2.2.5. Financials (Based on Availability)
- 16.2.3 Master Bond Inc
- 16.2.3.1. Overview
- 16.2.3.2. Products
- 16.2.3.3. SWOT Analysis
- 16.2.3.4. Recent Developments
- 16.2.3.5. Financials (Based on Availability)
- 16.2.4 Henkel AG & Co KGaA
- 16.2.4.1. Overview
- 16.2.4.2. Products
- 16.2.4.3. SWOT Analysis
- 16.2.4.4. Recent Developments
- 16.2.4.5. Financials (Based on Availability)
- 16.2.5 Parker Hannifin Corp (Lord Corporation)
- 16.2.5.1. Overview
- 16.2.5.2. Products
- 16.2.5.3. SWOT Analysis
- 16.2.5.4. Recent Developments
- 16.2.5.5. Financials (Based on Availability)
- 16.2.6 Pidilite Industries Ltd
- 16.2.6.1. Overview
- 16.2.6.2. Products
- 16.2.6.3. SWOT Analysis
- 16.2.6.4. Recent Developments
- 16.2.6.5. Financials (Based on Availability)
- 16.2.7 Sika AG*List Not Exhaustive
- 16.2.7.1. Overview
- 16.2.7.2. Products
- 16.2.7.3. SWOT Analysis
- 16.2.7.4. Recent Developments
- 16.2.7.5. Financials (Based on Availability)
- 16.2.8 Permabond LLC
- 16.2.8.1. Overview
- 16.2.8.2. Products
- 16.2.8.3. SWOT Analysis
- 16.2.8.4. Recent Developments
- 16.2.8.5. Financials (Based on Availability)
- 16.2.9 H B Fuller Company
- 16.2.9.1. Overview
- 16.2.9.2. Products
- 16.2.9.3. SWOT Analysis
- 16.2.9.4. Recent Developments
- 16.2.9.5. Financials (Based on Availability)
- 16.2.10 3M
- 16.2.10.1. Overview
- 16.2.10.2. Products
- 16.2.10.3. SWOT Analysis
- 16.2.10.4. Recent Developments
- 16.2.10.5. Financials (Based on Availability)
- 16.2.1 Arkema Group
List of Figures
- Figure 1: Global Composite Adhesives Industry Revenue Breakdown (Million, %) by Region 2024 & 2032
- Figure 2: Asia Pacific Composite Adhesives Industry Revenue (Million), by Country 2024 & 2032
- Figure 3: Asia Pacific Composite Adhesives Industry Revenue Share (%), by Country 2024 & 2032
- Figure 4: North America Composite Adhesives Industry Revenue (Million), by Country 2024 & 2032
- Figure 5: North America Composite Adhesives Industry Revenue Share (%), by Country 2024 & 2032
- Figure 6: Europe Composite Adhesives Industry Revenue (Million), by Country 2024 & 2032
- Figure 7: Europe Composite Adhesives Industry Revenue Share (%), by Country 2024 & 2032
- Figure 8: South America Composite Adhesives Industry Revenue (Million), by Country 2024 & 2032
- Figure 9: South America Composite Adhesives Industry Revenue Share (%), by Country 2024 & 2032
- Figure 10: Middle East and Africa Composite Adhesives Industry Revenue (Million), by Country 2024 & 2032
- Figure 11: Middle East and Africa Composite Adhesives Industry Revenue Share (%), by Country 2024 & 2032
- Figure 12: Asia Pacific Composite Adhesives Industry Revenue (Million), by Resin Type 2024 & 2032
- Figure 13: Asia Pacific Composite Adhesives Industry Revenue Share (%), by Resin Type 2024 & 2032
- Figure 14: Asia Pacific Composite Adhesives Industry Revenue (Million), by End-user Industry 2024 & 2032
- Figure 15: Asia Pacific Composite Adhesives Industry Revenue Share (%), by End-user Industry 2024 & 2032
- Figure 16: Asia Pacific Composite Adhesives Industry Revenue (Million), by Country 2024 & 2032
- Figure 17: Asia Pacific Composite Adhesives Industry Revenue Share (%), by Country 2024 & 2032
- Figure 18: North America Composite Adhesives Industry Revenue (Million), by Resin Type 2024 & 2032
- Figure 19: North America Composite Adhesives Industry Revenue Share (%), by Resin Type 2024 & 2032
- Figure 20: North America Composite Adhesives Industry Revenue (Million), by End-user Industry 2024 & 2032
- Figure 21: North America Composite Adhesives Industry Revenue Share (%), by End-user Industry 2024 & 2032
- Figure 22: North America Composite Adhesives Industry Revenue (Million), by Country 2024 & 2032
- Figure 23: North America Composite Adhesives Industry Revenue Share (%), by Country 2024 & 2032
- Figure 24: Europe Composite Adhesives Industry Revenue (Million), by Resin Type 2024 & 2032
- Figure 25: Europe Composite Adhesives Industry Revenue Share (%), by Resin Type 2024 & 2032
- Figure 26: Europe Composite Adhesives Industry Revenue (Million), by End-user Industry 2024 & 2032
- Figure 27: Europe Composite Adhesives Industry Revenue Share (%), by End-user Industry 2024 & 2032
- Figure 28: Europe Composite Adhesives Industry Revenue (Million), by Country 2024 & 2032
- Figure 29: Europe Composite Adhesives Industry Revenue Share (%), by Country 2024 & 2032
- Figure 30: South America Composite Adhesives Industry Revenue (Million), by Resin Type 2024 & 2032
- Figure 31: South America Composite Adhesives Industry Revenue Share (%), by Resin Type 2024 & 2032
- Figure 32: South America Composite Adhesives Industry Revenue (Million), by End-user Industry 2024 & 2032
- Figure 33: South America Composite Adhesives Industry Revenue Share (%), by End-user Industry 2024 & 2032
- Figure 34: South America Composite Adhesives Industry Revenue (Million), by Country 2024 & 2032
- Figure 35: South America Composite Adhesives Industry Revenue Share (%), by Country 2024 & 2032
- Figure 36: Middle East and Africa Composite Adhesives Industry Revenue (Million), by Resin Type 2024 & 2032
- Figure 37: Middle East and Africa Composite Adhesives Industry Revenue Share (%), by Resin Type 2024 & 2032
- Figure 38: Middle East and Africa Composite Adhesives Industry Revenue (Million), by End-user Industry 2024 & 2032
- Figure 39: Middle East and Africa Composite Adhesives Industry Revenue Share (%), by End-user Industry 2024 & 2032
- Figure 40: Middle East and Africa Composite Adhesives Industry Revenue (Million), by Country 2024 & 2032
- Figure 41: Middle East and Africa Composite Adhesives Industry Revenue Share (%), by Country 2024 & 2032
List of Tables
- Table 1: Global Composite Adhesives Industry Revenue Million Forecast, by Region 2019 & 2032
- Table 2: Global Composite Adhesives Industry Revenue Million Forecast, by Resin Type 2019 & 2032
- Table 3: Global Composite Adhesives Industry Revenue Million Forecast, by End-user Industry 2019 & 2032
- Table 4: Global Composite Adhesives Industry Revenue Million Forecast, by Region 2019 & 2032
- Table 5: Global Composite Adhesives Industry Revenue Million Forecast, by Country 2019 & 2032
- Table 6: China Composite Adhesives Industry Revenue (Million) Forecast, by Application 2019 & 2032
- Table 7: India Composite Adhesives Industry Revenue (Million) Forecast, by Application 2019 & 2032
- Table 8: Japan Composite Adhesives Industry Revenue (Million) Forecast, by Application 2019 & 2032
- Table 9: South Korea Composite Adhesives Industry Revenue (Million) Forecast, by Application 2019 & 2032
- Table 10: Rest of Asia Pacific Composite Adhesives Industry Revenue (Million) Forecast, by Application 2019 & 2032
- Table 11: Global Composite Adhesives Industry Revenue Million Forecast, by Country 2019 & 2032
- Table 12: United States Composite Adhesives Industry Revenue (Million) Forecast, by Application 2019 & 2032
- Table 13: Canada Composite Adhesives Industry Revenue (Million) Forecast, by Application 2019 & 2032
- Table 14: Mexico Composite Adhesives Industry Revenue (Million) Forecast, by Application 2019 & 2032
- Table 15: Global Composite Adhesives Industry Revenue Million Forecast, by Country 2019 & 2032
- Table 16: Germany Composite Adhesives Industry Revenue (Million) Forecast, by Application 2019 & 2032
- Table 17: United Kingdom Composite Adhesives Industry Revenue (Million) Forecast, by Application 2019 & 2032
- Table 18: Italy Composite Adhesives Industry Revenue (Million) Forecast, by Application 2019 & 2032
- Table 19: France Composite Adhesives Industry Revenue (Million) Forecast, by Application 2019 & 2032
- Table 20: Rest of Europe Composite Adhesives Industry Revenue (Million) Forecast, by Application 2019 & 2032
- Table 21: Global Composite Adhesives Industry Revenue Million Forecast, by Country 2019 & 2032
- Table 22: Brazil Composite Adhesives Industry Revenue (Million) Forecast, by Application 2019 & 2032
- Table 23: Argentina Composite Adhesives Industry Revenue (Million) Forecast, by Application 2019 & 2032
- Table 24: Rest of South America Composite Adhesives Industry Revenue (Million) Forecast, by Application 2019 & 2032
- Table 25: Global Composite Adhesives Industry Revenue Million Forecast, by Country 2019 & 2032
- Table 26: Saudi Arabia Composite Adhesives Industry Revenue (Million) Forecast, by Application 2019 & 2032
- Table 27: South Africa Composite Adhesives Industry Revenue (Million) Forecast, by Application 2019 & 2032
- Table 28: Rest of Middle East and Africa Composite Adhesives Industry Revenue (Million) Forecast, by Application 2019 & 2032
- Table 29: Global Composite Adhesives Industry Revenue Million Forecast, by Resin Type 2019 & 2032
- Table 30: Global Composite Adhesives Industry Revenue Million Forecast, by End-user Industry 2019 & 2032
- Table 31: Global Composite Adhesives Industry Revenue Million Forecast, by Country 2019 & 2032
- Table 32: China Composite Adhesives Industry Revenue (Million) Forecast, by Application 2019 & 2032
- Table 33: India Composite Adhesives Industry Revenue (Million) Forecast, by Application 2019 & 2032
- Table 34: Japan Composite Adhesives Industry Revenue (Million) Forecast, by Application 2019 & 2032
- Table 35: South Korea Composite Adhesives Industry Revenue (Million) Forecast, by Application 2019 & 2032
- Table 36: Malaysia Composite Adhesives Industry Revenue (Million) Forecast, by Application 2019 & 2032
- Table 37: Thailand Composite Adhesives Industry Revenue (Million) Forecast, by Application 2019 & 2032
- Table 38: Indonesia Composite Adhesives Industry Revenue (Million) Forecast, by Application 2019 & 2032
- Table 39: Vietnam Composite Adhesives Industry Revenue (Million) Forecast, by Application 2019 & 2032
- Table 40: Rest of Asia Pacific Composite Adhesives Industry Revenue (Million) Forecast, by Application 2019 & 2032
- Table 41: Global Composite Adhesives Industry Revenue Million Forecast, by Resin Type 2019 & 2032
- Table 42: Global Composite Adhesives Industry Revenue Million Forecast, by End-user Industry 2019 & 2032
- Table 43: Global Composite Adhesives Industry Revenue Million Forecast, by Country 2019 & 2032
- Table 44: United States Composite Adhesives Industry Revenue (Million) Forecast, by Application 2019 & 2032
- Table 45: Canada Composite Adhesives Industry Revenue (Million) Forecast, by Application 2019 & 2032
- Table 46: Mexico Composite Adhesives Industry Revenue (Million) Forecast, by Application 2019 & 2032
- Table 47: Global Composite Adhesives Industry Revenue Million Forecast, by Resin Type 2019 & 2032
- Table 48: Global Composite Adhesives Industry Revenue Million Forecast, by End-user Industry 2019 & 2032
- Table 49: Global Composite Adhesives Industry Revenue Million Forecast, by Country 2019 & 2032
- Table 50: Germany Composite Adhesives Industry Revenue (Million) Forecast, by Application 2019 & 2032
- Table 51: United Kingdom Composite Adhesives Industry Revenue (Million) Forecast, by Application 2019 & 2032
- Table 52: Italy Composite Adhesives Industry Revenue (Million) Forecast, by Application 2019 & 2032
- Table 53: France Composite Adhesives Industry Revenue (Million) Forecast, by Application 2019 & 2032
- Table 54: Spain Composite Adhesives Industry Revenue (Million) Forecast, by Application 2019 & 2032
- Table 55: NORDIC Countries Composite Adhesives Industry Revenue (Million) Forecast, by Application 2019 & 2032
- Table 56: Turkey Composite Adhesives Industry Revenue (Million) Forecast, by Application 2019 & 2032
- Table 57: Russia Composite Adhesives Industry Revenue (Million) Forecast, by Application 2019 & 2032
- Table 58: Rest of Europe Composite Adhesives Industry Revenue (Million) Forecast, by Application 2019 & 2032
- Table 59: Global Composite Adhesives Industry Revenue Million Forecast, by Resin Type 2019 & 2032
- Table 60: Global Composite Adhesives Industry Revenue Million Forecast, by End-user Industry 2019 & 2032
- Table 61: Global Composite Adhesives Industry Revenue Million Forecast, by Country 2019 & 2032
- Table 62: Brazil Composite Adhesives Industry Revenue (Million) Forecast, by Application 2019 & 2032
- Table 63: Argentina Composite Adhesives Industry Revenue (Million) Forecast, by Application 2019 & 2032
- Table 64: Colombia Composite Adhesives Industry Revenue (Million) Forecast, by Application 2019 & 2032
- Table 65: Rest of South America Composite Adhesives Industry Revenue (Million) Forecast, by Application 2019 & 2032
- Table 66: Global Composite Adhesives Industry Revenue Million Forecast, by Resin Type 2019 & 2032
- Table 67: Global Composite Adhesives Industry Revenue Million Forecast, by End-user Industry 2019 & 2032
- Table 68: Global Composite Adhesives Industry Revenue Million Forecast, by Country 2019 & 2032
- Table 69: Saudi Arabia Composite Adhesives Industry Revenue (Million) Forecast, by Application 2019 & 2032
- Table 70: South Africa Composite Adhesives Industry Revenue (Million) Forecast, by Application 2019 & 2032
- Table 71: Nigeria Composite Adhesives Industry Revenue (Million) Forecast, by Application 2019 & 2032
- Table 72: Qatar Composite Adhesives Industry Revenue (Million) Forecast, by Application 2019 & 2032
- Table 73: Egypt Composite Adhesives Industry Revenue (Million) Forecast, by Application 2019 & 2032
- Table 74: United Arab Emirates Composite Adhesives Industry Revenue (Million) Forecast, by Application 2019 & 2032
- Table 75: Rest of Middle East and Africa Composite Adhesives Industry Revenue (Million) Forecast, by Application 2019 & 2032
Frequently Asked Questions
1. What is the projected Compound Annual Growth Rate (CAGR) of the Composite Adhesives Industry?
The projected CAGR is approximately 5.00%.
2. Which companies are prominent players in the Composite Adhesives Industry?
Key companies in the market include Arkema Group, Parsons Corporation, Master Bond Inc, Henkel AG & Co KGaA, Parker Hannifin Corp (Lord Corporation), Pidilite Industries Ltd, Sika AG*List Not Exhaustive, Permabond LLC, H B Fuller Company, 3M.
3. What are the main segments of the Composite Adhesives Industry?
The market segments include Resin Type, End-user Industry.
4. Can you provide details about the market size?
The market size is estimated to be USD XX Million as of 2022.
5. What are some drivers contributing to market growth?
; Increasing Demand for Adhesives over Conventional Binding Techniques; Other Driver.
6. What are the notable trends driving market growth?
Increasing Demand for Epoxy Resin Type.
7. Are there any restraints impacting market growth?
; Slowdown in Global Automotive Production; Other Restraint.
8. Can you provide examples of recent developments in the market?
N/A
9. What pricing options are available for accessing the report?
Pricing options include single-user, multi-user, and enterprise licenses priced at USD 4750, USD 5250, and USD 8750 respectively.
10. Is the market size provided in terms of value or volume?
The market size is provided in terms of value, measured in Million.
11. Are there any specific market keywords associated with the report?
Yes, the market keyword associated with the report is "Composite Adhesives Industry," which aids in identifying and referencing the specific market segment covered.
12. How do I determine which pricing option suits my needs best?
The pricing options vary based on user requirements and access needs. Individual users may opt for single-user licenses, while businesses requiring broader access may choose multi-user or enterprise licenses for cost-effective access to the report.
13. Are there any additional resources or data provided in the Composite Adhesives Industry report?
While the report offers comprehensive insights, it's advisable to review the specific contents or supplementary materials provided to ascertain if additional resources or data are available.
14. How can I stay updated on further developments or reports in the Composite Adhesives Industry?
To stay informed about further developments, trends, and reports in the Composite Adhesives Industry, consider subscribing to industry newsletters, following relevant companies and organizations, or regularly checking reputable industry news sources and publications.
Methodology
Step 1 - Identification of Relevant Samples Size from Population Database


Step 2 - Approaches for Defining Global Market Size (Value, Volume* & Price*)

Note*: In applicable scenarios
Step 3 - Data Sources
Primary Research
- Web Analytics
- Survey Reports
- Research Institute
- Latest Research Reports
- Opinion Leaders
Secondary Research
- Annual Reports
- White Paper
- Latest Press Release
- Industry Association
- Paid Database
- Investor Presentations

Step 4 - Data Triangulation
Involves using different sources of information in order to increase the validity of a study
These sources are likely to be stakeholders in a program - participants, other researchers, program staff, other community members, and so on.
Then we put all data in single framework & apply various statistical tools to find out the dynamic on the market.
During the analysis stage, feedback from the stakeholder groups would be compared to determine areas of agreement as well as areas of divergence
