

Key Insights
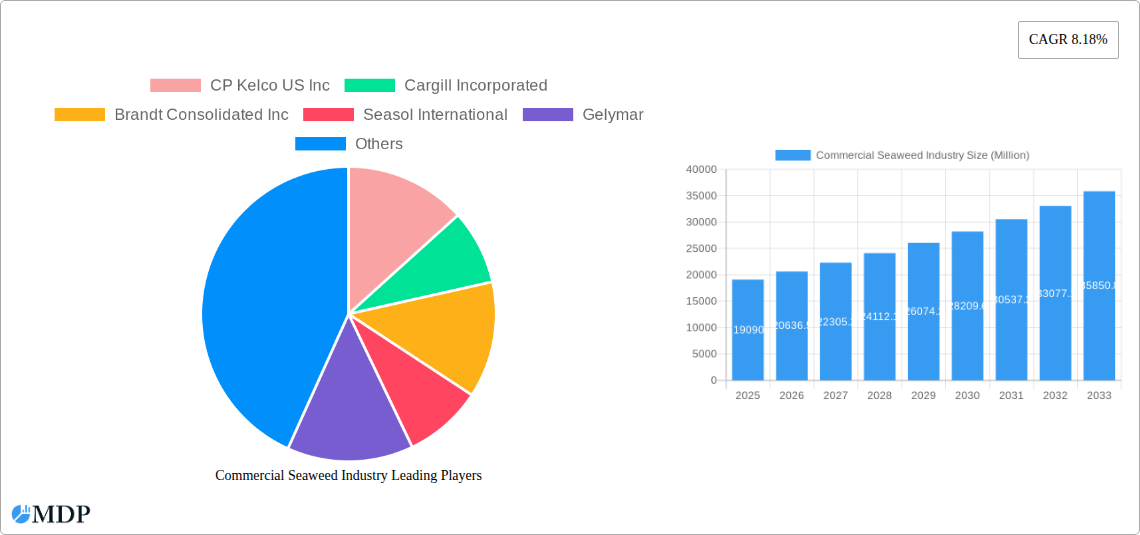
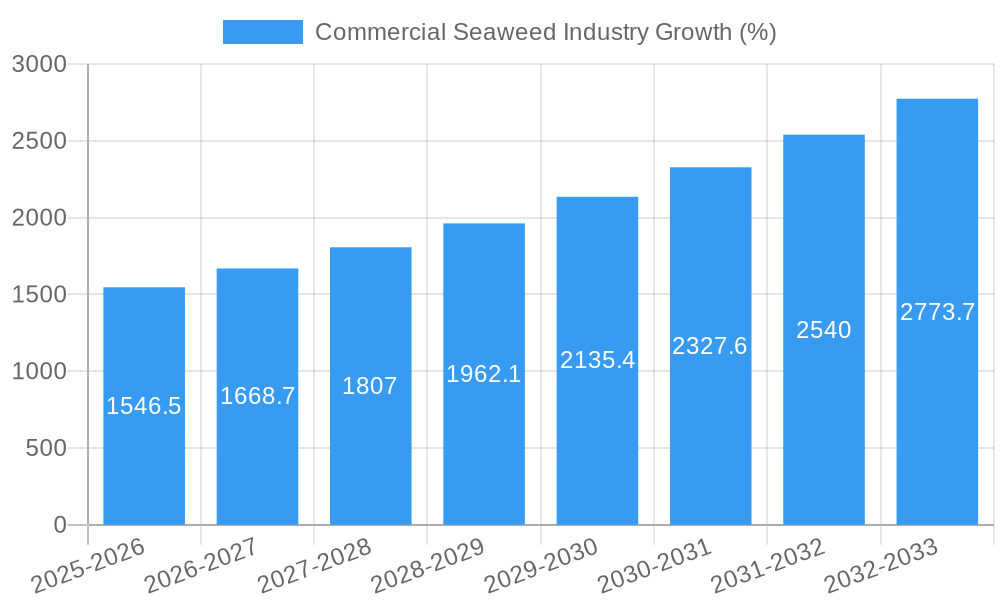
The commercial seaweed industry, valued at $19.09 billion in 2025, is experiencing robust growth, projected to expand at a compound annual growth rate (CAGR) of 8.18% from 2025 to 2033. This growth is fueled by increasing demand across diverse applications, primarily in food and beverages, dietary supplements, and pharmaceuticals. The rising awareness of seaweed's nutritional benefits and its sustainable nature are significant drivers. Brown seaweed currently holds the largest market share within the product type segment, owing to its versatility and wide-ranging applications. The food and beverage sector represents a major application area, driven by the incorporation of seaweed in various food products for texture enhancement, nutritional value, and as a sustainable ingredient. The pharmaceutical industry's increasing interest in seaweed's bioactive compounds for developing novel drugs and treatments further boosts market expansion. Geographical expansion is also a key factor; the Asia-Pacific region, particularly China and Japan, are significant seaweed producers and consumers, contributing substantially to the overall market size. However, challenges such as seasonality of harvests, inconsistent quality, and the need for further research and development in seaweed cultivation and processing techniques act as potential restraints to market growth.
Companies like CP Kelco US Inc, Cargill Incorporated, and Acadian Seaplants are key players, driving innovation and expanding market reach through strategic partnerships and investments in sustainable harvesting and processing methods. Future growth will likely see increased focus on sustainable aquaculture practices and the development of value-added products derived from seaweed, catering to growing consumer demand for health-conscious and environmentally friendly options. The industry's future is promising, particularly as technological advancements lead to more efficient cultivation and processing methods, potentially unlocking new applications and markets. The focus on reducing reliance on traditional agricultural practices, enhancing food security, and developing innovative solutions within the pharmaceutical and cosmetic sectors will continue to propel the industry forward.
Commercial Seaweed Industry: A Comprehensive Market Report (2019-2033)
This in-depth report provides a comprehensive analysis of the Commercial Seaweed Industry, offering invaluable insights for stakeholders across the value chain. With a study period spanning 2019-2033, a base year of 2025, and a forecast period of 2025-2033, this report unveils the market dynamics, trends, and future potential of this rapidly expanding sector. The report's meticulous analysis covers market size (projected at xx Million by 2033), key segments, leading players, and crucial developments, enabling informed decision-making and strategic planning.
Commercial Seaweed Industry Market Dynamics & Concentration
The global commercial seaweed industry is experiencing robust growth, driven by increasing demand across diverse applications. Market concentration is moderate, with several key players holding significant market share, but also a substantial number of smaller, specialized companies. Innovation, particularly in seaweed cultivation techniques and extraction methods, plays a vital role. Regulatory frameworks concerning sustainable harvesting and processing are constantly evolving, impacting market dynamics. Product substitutes, such as synthetic gelling agents, exert competitive pressure, while end-user trends favor natural, sustainable ingredients. M&A activity is moderate, with a projected xx number of deals in the forecast period, reflecting industry consolidation and expansion strategies.
- Market Share: CP Kelco US Inc. and Cargill Incorporated hold a combined xx% market share, with other players such as Acadian Seaplants, Algaia SA, and Gelymar holding significant but smaller shares.
- M&A Activity: The historical period (2019-2024) witnessed approximately xx M&A deals, primarily driven by vertical integration and expansion into new geographic markets.
Commercial Seaweed Industry Industry Trends & Analysis
The commercial seaweed industry is witnessing a Compound Annual Growth Rate (CAGR) of xx% during the forecast period (2025-2033). This growth is primarily fueled by the rising consumer preference for natural and sustainable ingredients across food and beverage, dietary supplements, and pharmaceutical sectors. Technological advancements in seaweed cultivation, extraction, and processing are improving efficiency and reducing costs. Market penetration in developing economies is increasing as awareness of seaweed’s health benefits grows. Intense competition exists among established players and emerging startups, driving innovation and price optimization. Further driving growth is the increasing adoption of seaweed-based products in niche sectors like cosmetics and bioplastics. Market penetration for seaweed in the food and beverage sector is currently estimated at xx%, projected to reach xx% by 2033.
Leading Markets & Segments in Commercial Seaweed Industry
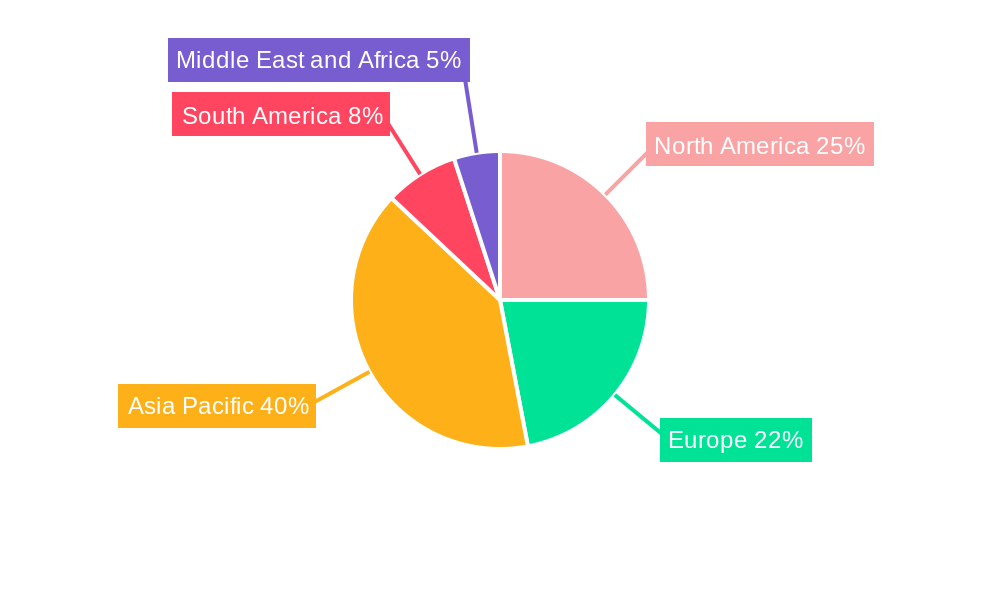
Asia-Pacific, specifically countries like China, Indonesia, and the Philippines, dominates the global commercial seaweed industry due to favorable climatic conditions and established cultivation practices. Brown seaweed holds the largest share of the product type segment, followed by red and green seaweed, reflecting its versatile applications and established market presence. Food and beverage remain the leading application segment, driven by increasing demand for natural food additives and thickening agents.
- Key Drivers for Asia-Pacific Dominance:
- Favorable climatic conditions ideal for seaweed cultivation.
- Extensive history and established seaweed farming practices.
- Growing consumer demand for seaweed-based products.
- Government support for sustainable seaweed cultivation initiatives.
Commercial Seaweed Industry Product Developments
Recent years have witnessed significant product innovations, including the development of novel seaweed extracts with enhanced functional properties and improved processing techniques enabling the creation of higher value products. Cargill’s WavePure® ADG range, for example, highlights the development of innovative seaweed-based ingredients for the food industry. The growing market for sustainable and eco-friendly products further fuels the development of novel seaweed-derived materials for various applications. Companies are actively investing in R&D to enhance the functional properties, improve the cost-effectiveness, and expand the application range of seaweed-derived products.
Key Drivers of Commercial Seaweed Industry Growth
Several factors contribute to the industry’s growth: the rising consumer demand for natural and sustainable food and ingredients; technological advancements improving efficiency and yield in seaweed cultivation and processing; and supportive government policies promoting sustainable aquaculture. The increasing awareness of seaweed's health benefits also fuels its adoption in dietary supplements and pharmaceuticals. Moreover, the expanding use of seaweed in other applications, such as bioplastics and cosmetics, represents a significant growth opportunity.
Challenges in the Commercial Seaweed Industry Market
The industry faces challenges including seasonal variations in seaweed harvests impacting supply chain stability. Regulatory hurdles related to seaweed cultivation and processing in different countries also pose complexities. Competition from synthetic substitutes and the need for maintaining sustainable harvesting practices further complicate the operational environment. These factors contribute to fluctuating pricing and production challenges.
Emerging Opportunities in Commercial Seaweed Industry
Emerging opportunities include exploring novel applications of seaweed in various sectors, including biofuels and bioremediation. Strategic partnerships between seaweed producers and other industries can unlock innovative product developments. Expanding into new geographical markets with favorable conditions for seaweed cultivation and a growing consumer demand for sustainable products holds significant potential. Investment in research and development for innovative products and processing techniques will be crucial in sustaining future growth.
Leading Players in the Commercial Seaweed Industry Sector
- CP Kelco US Inc
- Cargill Incorporated
- Brandt Consolidated Inc
- Seasol International
- Gelymar
- E I du Pont de Nemours & Company
- Rhodomaxx
- Algaia SA
- Dycolor Seaweed Industries
- Acadian Seaplants
Key Milestones in Commercial Seaweed Industry Industry
- September 2022: Launch of Cadalmin™ LivCure extract, a seaweed-based nutraceutical for liver health by ICAR-CMFRI. This signifies the expansion of seaweed applications into the pharmaceutical sector.
- March 2021: Proliferation of seaweed farming start-ups in Australia, indicating growing investor interest and government support for the industry.
- February 2021: Cargill's launch of WavePure® ADG, a seaweed-based ingredient for the food industry, illustrates innovation in food applications.
Strategic Outlook for Commercial Seaweed Industry Market
The future of the commercial seaweed industry is promising, driven by strong growth potential across multiple applications. Strategic investments in sustainable cultivation practices, research and development for new products and technologies, and expansion into new markets will be crucial for success. Companies that successfully navigate regulatory landscapes and adopt innovative strategies will capture significant market share in this rapidly evolving industry. The market is poised for substantial expansion, with opportunities for both established players and new entrants.
Commercial Seaweed Industry Segmentation
-
1. Product Type
- 1.1. Brown Seaweed
- 1.2. Green Seaweed
- 1.3. Red Seaweed
-
2. Application
- 2.1. Food and Beverages
- 2.2. Dietary Supplements
- 2.3. Pharmaceuticals
- 2.4. Other Applications
Commercial Seaweed Industry Segmentation By Geography
-
1. North America
- 1.1. United States
- 1.2. Canada
- 1.3. Mexico
- 1.4. Rest of North America
-
2. Europe
- 2.1. Germany
- 2.2. United Kingdom
- 2.3. France
- 2.4. Spain
- 2.5. Russia
- 2.6. Italy
- 2.7. Rest of Europe
-
3. Asia Pacific
- 3.1. China
- 3.2. India
- 3.3. Japan
- 3.4. Australia
- 3.5. Rest of Asia Pacific
-
4. South America
- 4.1. Brazil
- 4.2. Argentina
- 4.3. Rest of South America
-
5. Middle East and Africa
- 5.1. United Arab Emirates
- 5.2. South Africa
- 5.3. Rest Middle East and Africa
Commercial Seaweed Industry REPORT HIGHLIGHTS
| Aspects | Details |
|---|---|
| Study Period | 2019-2033 |
| Base Year | 2024 |
| Estimated Year | 2025 |
| Forecast Period | 2025-2033 |
| Historical Period | 2019-2024 |
| Growth Rate | CAGR of 8.18% from 2019-2033 |
| Segmentation |
|
Table of Contents
- 1. Introduction
- 1.1. Research Scope
- 1.2. Market Segmentation
- 1.3. Research Methodology
- 1.4. Definitions and Assumptions
- 2. Executive Summary
- 2.1. Introduction
- 3. Market Dynamics
- 3.1. Introduction
- 3.2. Market Drivers
- 3.2.1. Increasing Demand for Low-Fat and Low-Calorie Food; Increasing Product Innovation
- 3.3. Market Restrains
- 3.3.1. ; Threat of New Entrants; Bargaining Power of Buyers/Consumers; Bargaining Power of Suppliers; Threat of Substitute Products; Degree Of Competition
- 3.4. Market Trends
- 3.4.1. Increased Usage of Seaweed in Food Sector due to it Functional Properties and Nutritional Benefits
- 4. Market Factor Analysis
- 4.1. Porters Five Forces
- 4.2. Supply/Value Chain
- 4.3. PESTEL analysis
- 4.4. Market Entropy
- 4.5. Patent/Trademark Analysis
- 5. Global Commercial Seaweed Industry Analysis, Insights and Forecast, 2019-2031
- 5.1. Market Analysis, Insights and Forecast - by Product Type
- 5.1.1. Brown Seaweed
- 5.1.2. Green Seaweed
- 5.1.3. Red Seaweed
- 5.2. Market Analysis, Insights and Forecast - by Application
- 5.2.1. Food and Beverages
- 5.2.2. Dietary Supplements
- 5.2.3. Pharmaceuticals
- 5.2.4. Other Applications
- 5.3. Market Analysis, Insights and Forecast - by Region
- 5.3.1. North America
- 5.3.2. Europe
- 5.3.3. Asia Pacific
- 5.3.4. South America
- 5.3.5. Middle East and Africa
- 5.1. Market Analysis, Insights and Forecast - by Product Type
- 6. North America Commercial Seaweed Industry Analysis, Insights and Forecast, 2019-2031
- 6.1. Market Analysis, Insights and Forecast - by Product Type
- 6.1.1. Brown Seaweed
- 6.1.2. Green Seaweed
- 6.1.3. Red Seaweed
- 6.2. Market Analysis, Insights and Forecast - by Application
- 6.2.1. Food and Beverages
- 6.2.2. Dietary Supplements
- 6.2.3. Pharmaceuticals
- 6.2.4. Other Applications
- 6.1. Market Analysis, Insights and Forecast - by Product Type
- 7. Europe Commercial Seaweed Industry Analysis, Insights and Forecast, 2019-2031
- 7.1. Market Analysis, Insights and Forecast - by Product Type
- 7.1.1. Brown Seaweed
- 7.1.2. Green Seaweed
- 7.1.3. Red Seaweed
- 7.2. Market Analysis, Insights and Forecast - by Application
- 7.2.1. Food and Beverages
- 7.2.2. Dietary Supplements
- 7.2.3. Pharmaceuticals
- 7.2.4. Other Applications
- 7.1. Market Analysis, Insights and Forecast - by Product Type
- 8. Asia Pacific Commercial Seaweed Industry Analysis, Insights and Forecast, 2019-2031
- 8.1. Market Analysis, Insights and Forecast - by Product Type
- 8.1.1. Brown Seaweed
- 8.1.2. Green Seaweed
- 8.1.3. Red Seaweed
- 8.2. Market Analysis, Insights and Forecast - by Application
- 8.2.1. Food and Beverages
- 8.2.2. Dietary Supplements
- 8.2.3. Pharmaceuticals
- 8.2.4. Other Applications
- 8.1. Market Analysis, Insights and Forecast - by Product Type
- 9. South America Commercial Seaweed Industry Analysis, Insights and Forecast, 2019-2031
- 9.1. Market Analysis, Insights and Forecast - by Product Type
- 9.1.1. Brown Seaweed
- 9.1.2. Green Seaweed
- 9.1.3. Red Seaweed
- 9.2. Market Analysis, Insights and Forecast - by Application
- 9.2.1. Food and Beverages
- 9.2.2. Dietary Supplements
- 9.2.3. Pharmaceuticals
- 9.2.4. Other Applications
- 9.1. Market Analysis, Insights and Forecast - by Product Type
- 10. Middle East and Africa Commercial Seaweed Industry Analysis, Insights and Forecast, 2019-2031
- 10.1. Market Analysis, Insights and Forecast - by Product Type
- 10.1.1. Brown Seaweed
- 10.1.2. Green Seaweed
- 10.1.3. Red Seaweed
- 10.2. Market Analysis, Insights and Forecast - by Application
- 10.2.1. Food and Beverages
- 10.2.2. Dietary Supplements
- 10.2.3. Pharmaceuticals
- 10.2.4. Other Applications
- 10.1. Market Analysis, Insights and Forecast - by Product Type
- 11. North America Commercial Seaweed Industry Analysis, Insights and Forecast, 2019-2031
- 11.1. Market Analysis, Insights and Forecast - By Country/Sub-region
- 11.1.1 United States
- 11.1.2 Canada
- 11.1.3 Mexico
- 11.1.4 Rest of North America
- 12. Europe Commercial Seaweed Industry Analysis, Insights and Forecast, 2019-2031
- 12.1. Market Analysis, Insights and Forecast - By Country/Sub-region
- 12.1.1 Germany
- 12.1.2 United Kingdom
- 12.1.3 France
- 12.1.4 Spain
- 12.1.5 Russia
- 12.1.6 Italy
- 12.1.7 Rest of Europe
- 13. Asia Pacific Commercial Seaweed Industry Analysis, Insights and Forecast, 2019-2031
- 13.1. Market Analysis, Insights and Forecast - By Country/Sub-region
- 13.1.1 China
- 13.1.2 India
- 13.1.3 Japan
- 13.1.4 Australia
- 13.1.5 Rest of Asia Pacific
- 14. South America Commercial Seaweed Industry Analysis, Insights and Forecast, 2019-2031
- 14.1. Market Analysis, Insights and Forecast - By Country/Sub-region
- 14.1.1 Brazil
- 14.1.2 Argentina
- 14.1.3 Rest of South America
- 15. Middle East and Africa Commercial Seaweed Industry Analysis, Insights and Forecast, 2019-2031
- 15.1. Market Analysis, Insights and Forecast - By Country/Sub-region
- 15.1.1 United Arab Emirates
- 15.1.2 South Africa
- 15.1.3 Rest Middle East and Africa
- 16. Competitive Analysis
- 16.1. Global Market Share Analysis 2024
- 16.2. Company Profiles
- 16.2.1 CP Kelco US Inc
- 16.2.1.1. Overview
- 16.2.1.2. Products
- 16.2.1.3. SWOT Analysis
- 16.2.1.4. Recent Developments
- 16.2.1.5. Financials (Based on Availability)
- 16.2.2 Cargill Incorporated
- 16.2.2.1. Overview
- 16.2.2.2. Products
- 16.2.2.3. SWOT Analysis
- 16.2.2.4. Recent Developments
- 16.2.2.5. Financials (Based on Availability)
- 16.2.3 Brandt Consolidated Inc
- 16.2.3.1. Overview
- 16.2.3.2. Products
- 16.2.3.3. SWOT Analysis
- 16.2.3.4. Recent Developments
- 16.2.3.5. Financials (Based on Availability)
- 16.2.4 Seasol International
- 16.2.4.1. Overview
- 16.2.4.2. Products
- 16.2.4.3. SWOT Analysis
- 16.2.4.4. Recent Developments
- 16.2.4.5. Financials (Based on Availability)
- 16.2.5 Gelymar
- 16.2.5.1. Overview
- 16.2.5.2. Products
- 16.2.5.3. SWOT Analysis
- 16.2.5.4. Recent Developments
- 16.2.5.5. Financials (Based on Availability)
- 16.2.6 E I du Pont de Nemours & Company
- 16.2.6.1. Overview
- 16.2.6.2. Products
- 16.2.6.3. SWOT Analysis
- 16.2.6.4. Recent Developments
- 16.2.6.5. Financials (Based on Availability)
- 16.2.7 Rhodomaxx
- 16.2.7.1. Overview
- 16.2.7.2. Products
- 16.2.7.3. SWOT Analysis
- 16.2.7.4. Recent Developments
- 16.2.7.5. Financials (Based on Availability)
- 16.2.8 Algaia SA*List Not Exhaustive
- 16.2.8.1. Overview
- 16.2.8.2. Products
- 16.2.8.3. SWOT Analysis
- 16.2.8.4. Recent Developments
- 16.2.8.5. Financials (Based on Availability)
- 16.2.9 Dycolor Seaweed Industries
- 16.2.9.1. Overview
- 16.2.9.2. Products
- 16.2.9.3. SWOT Analysis
- 16.2.9.4. Recent Developments
- 16.2.9.5. Financials (Based on Availability)
- 16.2.10 Acadian Seaplants
- 16.2.10.1. Overview
- 16.2.10.2. Products
- 16.2.10.3. SWOT Analysis
- 16.2.10.4. Recent Developments
- 16.2.10.5. Financials (Based on Availability)
- 16.2.1 CP Kelco US Inc
List of Figures
- Figure 1: Global Commercial Seaweed Industry Revenue Breakdown (Million, %) by Region 2024 & 2032
- Figure 2: North America Commercial Seaweed Industry Revenue (Million), by Country 2024 & 2032
- Figure 3: North America Commercial Seaweed Industry Revenue Share (%), by Country 2024 & 2032
- Figure 4: Europe Commercial Seaweed Industry Revenue (Million), by Country 2024 & 2032
- Figure 5: Europe Commercial Seaweed Industry Revenue Share (%), by Country 2024 & 2032
- Figure 6: Asia Pacific Commercial Seaweed Industry Revenue (Million), by Country 2024 & 2032
- Figure 7: Asia Pacific Commercial Seaweed Industry Revenue Share (%), by Country 2024 & 2032
- Figure 8: South America Commercial Seaweed Industry Revenue (Million), by Country 2024 & 2032
- Figure 9: South America Commercial Seaweed Industry Revenue Share (%), by Country 2024 & 2032
- Figure 10: Middle East and Africa Commercial Seaweed Industry Revenue (Million), by Country 2024 & 2032
- Figure 11: Middle East and Africa Commercial Seaweed Industry Revenue Share (%), by Country 2024 & 2032
- Figure 12: North America Commercial Seaweed Industry Revenue (Million), by Product Type 2024 & 2032
- Figure 13: North America Commercial Seaweed Industry Revenue Share (%), by Product Type 2024 & 2032
- Figure 14: North America Commercial Seaweed Industry Revenue (Million), by Application 2024 & 2032
- Figure 15: North America Commercial Seaweed Industry Revenue Share (%), by Application 2024 & 2032
- Figure 16: North America Commercial Seaweed Industry Revenue (Million), by Country 2024 & 2032
- Figure 17: North America Commercial Seaweed Industry Revenue Share (%), by Country 2024 & 2032
- Figure 18: Europe Commercial Seaweed Industry Revenue (Million), by Product Type 2024 & 2032
- Figure 19: Europe Commercial Seaweed Industry Revenue Share (%), by Product Type 2024 & 2032
- Figure 20: Europe Commercial Seaweed Industry Revenue (Million), by Application 2024 & 2032
- Figure 21: Europe Commercial Seaweed Industry Revenue Share (%), by Application 2024 & 2032
- Figure 22: Europe Commercial Seaweed Industry Revenue (Million), by Country 2024 & 2032
- Figure 23: Europe Commercial Seaweed Industry Revenue Share (%), by Country 2024 & 2032
- Figure 24: Asia Pacific Commercial Seaweed Industry Revenue (Million), by Product Type 2024 & 2032
- Figure 25: Asia Pacific Commercial Seaweed Industry Revenue Share (%), by Product Type 2024 & 2032
- Figure 26: Asia Pacific Commercial Seaweed Industry Revenue (Million), by Application 2024 & 2032
- Figure 27: Asia Pacific Commercial Seaweed Industry Revenue Share (%), by Application 2024 & 2032
- Figure 28: Asia Pacific Commercial Seaweed Industry Revenue (Million), by Country 2024 & 2032
- Figure 29: Asia Pacific Commercial Seaweed Industry Revenue Share (%), by Country 2024 & 2032
- Figure 30: South America Commercial Seaweed Industry Revenue (Million), by Product Type 2024 & 2032
- Figure 31: South America Commercial Seaweed Industry Revenue Share (%), by Product Type 2024 & 2032
- Figure 32: South America Commercial Seaweed Industry Revenue (Million), by Application 2024 & 2032
- Figure 33: South America Commercial Seaweed Industry Revenue Share (%), by Application 2024 & 2032
- Figure 34: South America Commercial Seaweed Industry Revenue (Million), by Country 2024 & 2032
- Figure 35: South America Commercial Seaweed Industry Revenue Share (%), by Country 2024 & 2032
- Figure 36: Middle East and Africa Commercial Seaweed Industry Revenue (Million), by Product Type 2024 & 2032
- Figure 37: Middle East and Africa Commercial Seaweed Industry Revenue Share (%), by Product Type 2024 & 2032
- Figure 38: Middle East and Africa Commercial Seaweed Industry Revenue (Million), by Application 2024 & 2032
- Figure 39: Middle East and Africa Commercial Seaweed Industry Revenue Share (%), by Application 2024 & 2032
- Figure 40: Middle East and Africa Commercial Seaweed Industry Revenue (Million), by Country 2024 & 2032
- Figure 41: Middle East and Africa Commercial Seaweed Industry Revenue Share (%), by Country 2024 & 2032
List of Tables
- Table 1: Global Commercial Seaweed Industry Revenue Million Forecast, by Region 2019 & 2032
- Table 2: Global Commercial Seaweed Industry Revenue Million Forecast, by Product Type 2019 & 2032
- Table 3: Global Commercial Seaweed Industry Revenue Million Forecast, by Application 2019 & 2032
- Table 4: Global Commercial Seaweed Industry Revenue Million Forecast, by Region 2019 & 2032
- Table 5: Global Commercial Seaweed Industry Revenue Million Forecast, by Country 2019 & 2032
- Table 6: United States Commercial Seaweed Industry Revenue (Million) Forecast, by Application 2019 & 2032
- Table 7: Canada Commercial Seaweed Industry Revenue (Million) Forecast, by Application 2019 & 2032
- Table 8: Mexico Commercial Seaweed Industry Revenue (Million) Forecast, by Application 2019 & 2032
- Table 9: Rest of North America Commercial Seaweed Industry Revenue (Million) Forecast, by Application 2019 & 2032
- Table 10: Global Commercial Seaweed Industry Revenue Million Forecast, by Country 2019 & 2032
- Table 11: Germany Commercial Seaweed Industry Revenue (Million) Forecast, by Application 2019 & 2032
- Table 12: United Kingdom Commercial Seaweed Industry Revenue (Million) Forecast, by Application 2019 & 2032
- Table 13: France Commercial Seaweed Industry Revenue (Million) Forecast, by Application 2019 & 2032
- Table 14: Spain Commercial Seaweed Industry Revenue (Million) Forecast, by Application 2019 & 2032
- Table 15: Russia Commercial Seaweed Industry Revenue (Million) Forecast, by Application 2019 & 2032
- Table 16: Italy Commercial Seaweed Industry Revenue (Million) Forecast, by Application 2019 & 2032
- Table 17: Rest of Europe Commercial Seaweed Industry Revenue (Million) Forecast, by Application 2019 & 2032
- Table 18: Global Commercial Seaweed Industry Revenue Million Forecast, by Country 2019 & 2032
- Table 19: China Commercial Seaweed Industry Revenue (Million) Forecast, by Application 2019 & 2032
- Table 20: India Commercial Seaweed Industry Revenue (Million) Forecast, by Application 2019 & 2032
- Table 21: Japan Commercial Seaweed Industry Revenue (Million) Forecast, by Application 2019 & 2032
- Table 22: Australia Commercial Seaweed Industry Revenue (Million) Forecast, by Application 2019 & 2032
- Table 23: Rest of Asia Pacific Commercial Seaweed Industry Revenue (Million) Forecast, by Application 2019 & 2032
- Table 24: Global Commercial Seaweed Industry Revenue Million Forecast, by Country 2019 & 2032
- Table 25: Brazil Commercial Seaweed Industry Revenue (Million) Forecast, by Application 2019 & 2032
- Table 26: Argentina Commercial Seaweed Industry Revenue (Million) Forecast, by Application 2019 & 2032
- Table 27: Rest of South America Commercial Seaweed Industry Revenue (Million) Forecast, by Application 2019 & 2032
- Table 28: Global Commercial Seaweed Industry Revenue Million Forecast, by Country 2019 & 2032
- Table 29: United Arab Emirates Commercial Seaweed Industry Revenue (Million) Forecast, by Application 2019 & 2032
- Table 30: South Africa Commercial Seaweed Industry Revenue (Million) Forecast, by Application 2019 & 2032
- Table 31: Rest Middle East and Africa Commercial Seaweed Industry Revenue (Million) Forecast, by Application 2019 & 2032
- Table 32: Global Commercial Seaweed Industry Revenue Million Forecast, by Product Type 2019 & 2032
- Table 33: Global Commercial Seaweed Industry Revenue Million Forecast, by Application 2019 & 2032
- Table 34: Global Commercial Seaweed Industry Revenue Million Forecast, by Country 2019 & 2032
- Table 35: United States Commercial Seaweed Industry Revenue (Million) Forecast, by Application 2019 & 2032
- Table 36: Canada Commercial Seaweed Industry Revenue (Million) Forecast, by Application 2019 & 2032
- Table 37: Mexico Commercial Seaweed Industry Revenue (Million) Forecast, by Application 2019 & 2032
- Table 38: Rest of North America Commercial Seaweed Industry Revenue (Million) Forecast, by Application 2019 & 2032
- Table 39: Global Commercial Seaweed Industry Revenue Million Forecast, by Product Type 2019 & 2032
- Table 40: Global Commercial Seaweed Industry Revenue Million Forecast, by Application 2019 & 2032
- Table 41: Global Commercial Seaweed Industry Revenue Million Forecast, by Country 2019 & 2032
- Table 42: Germany Commercial Seaweed Industry Revenue (Million) Forecast, by Application 2019 & 2032
- Table 43: United Kingdom Commercial Seaweed Industry Revenue (Million) Forecast, by Application 2019 & 2032
- Table 44: France Commercial Seaweed Industry Revenue (Million) Forecast, by Application 2019 & 2032
- Table 45: Spain Commercial Seaweed Industry Revenue (Million) Forecast, by Application 2019 & 2032
- Table 46: Russia Commercial Seaweed Industry Revenue (Million) Forecast, by Application 2019 & 2032
- Table 47: Italy Commercial Seaweed Industry Revenue (Million) Forecast, by Application 2019 & 2032
- Table 48: Rest of Europe Commercial Seaweed Industry Revenue (Million) Forecast, by Application 2019 & 2032
- Table 49: Global Commercial Seaweed Industry Revenue Million Forecast, by Product Type 2019 & 2032
- Table 50: Global Commercial Seaweed Industry Revenue Million Forecast, by Application 2019 & 2032
- Table 51: Global Commercial Seaweed Industry Revenue Million Forecast, by Country 2019 & 2032
- Table 52: China Commercial Seaweed Industry Revenue (Million) Forecast, by Application 2019 & 2032
- Table 53: India Commercial Seaweed Industry Revenue (Million) Forecast, by Application 2019 & 2032
- Table 54: Japan Commercial Seaweed Industry Revenue (Million) Forecast, by Application 2019 & 2032
- Table 55: Australia Commercial Seaweed Industry Revenue (Million) Forecast, by Application 2019 & 2032
- Table 56: Rest of Asia Pacific Commercial Seaweed Industry Revenue (Million) Forecast, by Application 2019 & 2032
- Table 57: Global Commercial Seaweed Industry Revenue Million Forecast, by Product Type 2019 & 2032
- Table 58: Global Commercial Seaweed Industry Revenue Million Forecast, by Application 2019 & 2032
- Table 59: Global Commercial Seaweed Industry Revenue Million Forecast, by Country 2019 & 2032
- Table 60: Brazil Commercial Seaweed Industry Revenue (Million) Forecast, by Application 2019 & 2032
- Table 61: Argentina Commercial Seaweed Industry Revenue (Million) Forecast, by Application 2019 & 2032
- Table 62: Rest of South America Commercial Seaweed Industry Revenue (Million) Forecast, by Application 2019 & 2032
- Table 63: Global Commercial Seaweed Industry Revenue Million Forecast, by Product Type 2019 & 2032
- Table 64: Global Commercial Seaweed Industry Revenue Million Forecast, by Application 2019 & 2032
- Table 65: Global Commercial Seaweed Industry Revenue Million Forecast, by Country 2019 & 2032
- Table 66: United Arab Emirates Commercial Seaweed Industry Revenue (Million) Forecast, by Application 2019 & 2032
- Table 67: South Africa Commercial Seaweed Industry Revenue (Million) Forecast, by Application 2019 & 2032
- Table 68: Rest Middle East and Africa Commercial Seaweed Industry Revenue (Million) Forecast, by Application 2019 & 2032
Frequently Asked Questions
1. What is the projected Compound Annual Growth Rate (CAGR) of the Commercial Seaweed Industry?
The projected CAGR is approximately 8.18%.
2. Which companies are prominent players in the Commercial Seaweed Industry?
Key companies in the market include CP Kelco US Inc, Cargill Incorporated, Brandt Consolidated Inc, Seasol International, Gelymar, E I du Pont de Nemours & Company, Rhodomaxx, Algaia SA*List Not Exhaustive, Dycolor Seaweed Industries, Acadian Seaplants.
3. What are the main segments of the Commercial Seaweed Industry?
The market segments include Product Type, Application.
4. Can you provide details about the market size?
The market size is estimated to be USD 19.09 Million as of 2022.
5. What are some drivers contributing to market growth?
Increasing Demand for Low-Fat and Low-Calorie Food; Increasing Product Innovation.
6. What are the notable trends driving market growth?
Increased Usage of Seaweed in Food Sector due to it Functional Properties and Nutritional Benefits.
7. Are there any restraints impacting market growth?
; Threat of New Entrants; Bargaining Power of Buyers/Consumers; Bargaining Power of Suppliers; Threat of Substitute Products; Degree Of Competition.
8. Can you provide examples of recent developments in the market?
September 2022: CadalminTM LivCure extract, a patent-protected nutraceutical product developed by the ICAR-Central Marine Fisheries Research Institute (CMFRI) from seaweeds to combat non-alcoholic fatty liver disease, will be available in the market soon. The product contains 100% natural bioactive ingredients extracted from select seaweeds. The product is made using eco-friendly green technology to improve liver health and is the 9th nutraceutical developed by CMFRI
9. What pricing options are available for accessing the report?
Pricing options include single-user, multi-user, and enterprise licenses priced at USD 4750, USD 5250, and USD 8750 respectively.
10. Is the market size provided in terms of value or volume?
The market size is provided in terms of value, measured in Million.
11. Are there any specific market keywords associated with the report?
Yes, the market keyword associated with the report is "Commercial Seaweed Industry," which aids in identifying and referencing the specific market segment covered.
12. How do I determine which pricing option suits my needs best?
The pricing options vary based on user requirements and access needs. Individual users may opt for single-user licenses, while businesses requiring broader access may choose multi-user or enterprise licenses for cost-effective access to the report.
13. Are there any additional resources or data provided in the Commercial Seaweed Industry report?
While the report offers comprehensive insights, it's advisable to review the specific contents or supplementary materials provided to ascertain if additional resources or data are available.
14. How can I stay updated on further developments or reports in the Commercial Seaweed Industry?
To stay informed about further developments, trends, and reports in the Commercial Seaweed Industry, consider subscribing to industry newsletters, following relevant companies and organizations, or regularly checking reputable industry news sources and publications.
Methodology
Step 1 - Identification of Relevant Samples Size from Population Database


Step 2 - Approaches for Defining Global Market Size (Value, Volume* & Price*)

Note*: In applicable scenarios
Step 3 - Data Sources
Primary Research
- Web Analytics
- Survey Reports
- Research Institute
- Latest Research Reports
- Opinion Leaders
Secondary Research
- Annual Reports
- White Paper
- Latest Press Release
- Industry Association
- Paid Database
- Investor Presentations

Step 4 - Data Triangulation
Involves using different sources of information in order to increase the validity of a study
These sources are likely to be stakeholders in a program - participants, other researchers, program staff, other community members, and so on.
Then we put all data in single framework & apply various statistical tools to find out the dynamic on the market.
During the analysis stage, feedback from the stakeholder groups would be compared to determine areas of agreement as well as areas of divergence
