

Key Insights
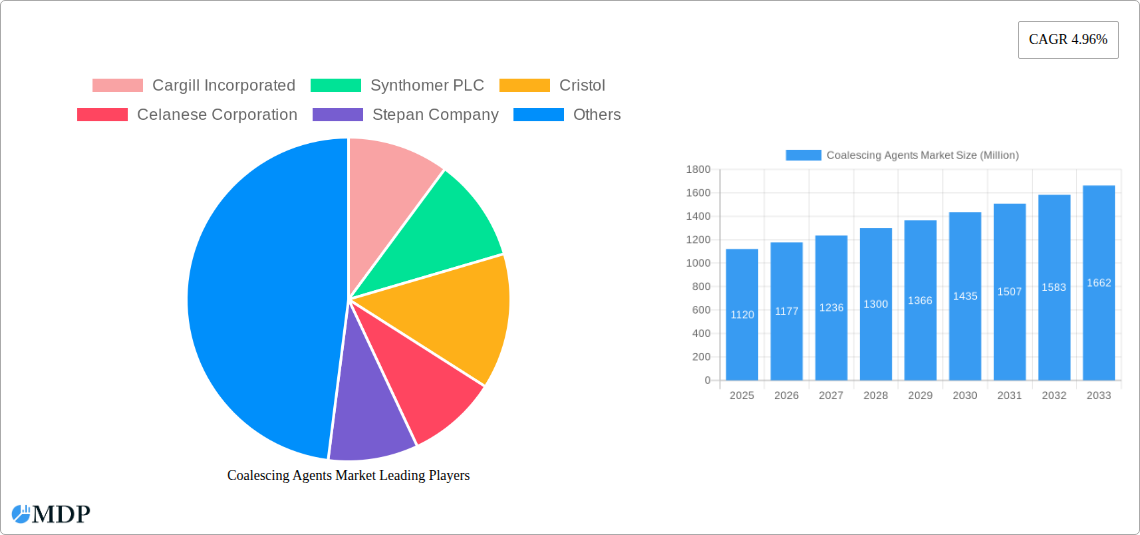
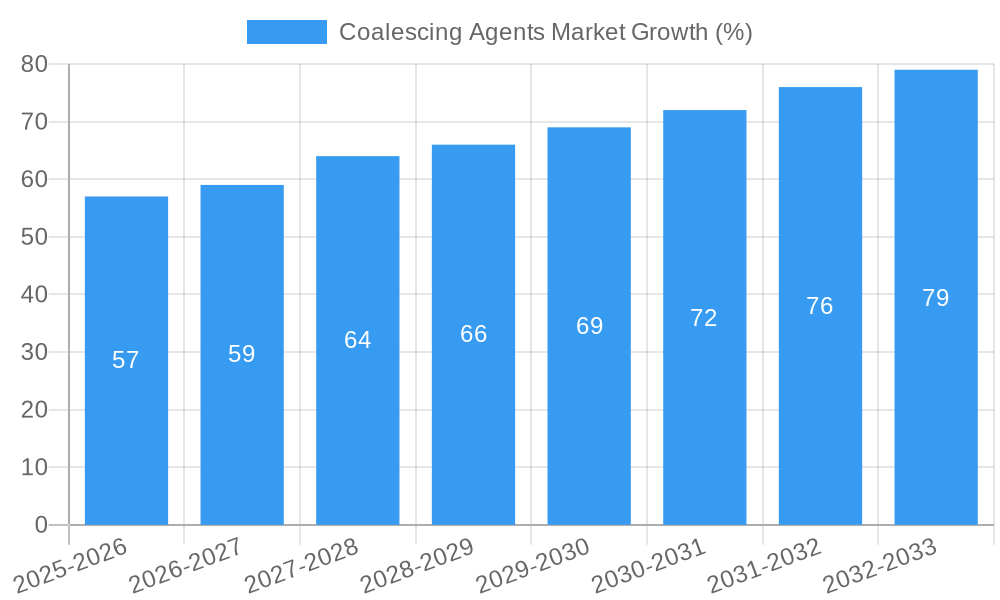
The coalescing agents market, valued at $1.12 billion in 2025, is projected to experience robust growth, driven by a compound annual growth rate (CAGR) of 4.96% from 2025 to 2033. This expansion is fueled by several key factors. The increasing demand for high-performance coatings and adhesives across diverse industries, including automotive, construction, and electronics, is a significant driver. Advances in polymer chemistry are leading to the development of more efficient and sustainable coalescing agents, further stimulating market growth. The rising adoption of water-based coatings, owing to stricter environmental regulations and growing health concerns, is creating significant opportunities for hydrophilic coalescing agents. Furthermore, the expanding personal care industry, with its focus on innovative formulations and enhanced product performance, is also contributing to market expansion. The market is segmented by type (hydrophilic and hydrophobic) and application (adhesives & sealants, paints & coatings, inks, personal care, and other applications like decoloring and polymer modification). While competition is intense among established players like Cargill, Synthomer, BASF, and Dow, opportunities exist for smaller players specializing in niche applications or sustainable formulations. Geographic growth is expected to be particularly strong in the Asia-Pacific region, driven by rapid industrialization and infrastructure development in countries like China and India. However, fluctuations in raw material prices and potential regulatory changes related to certain chemical components pose challenges to consistent market growth.
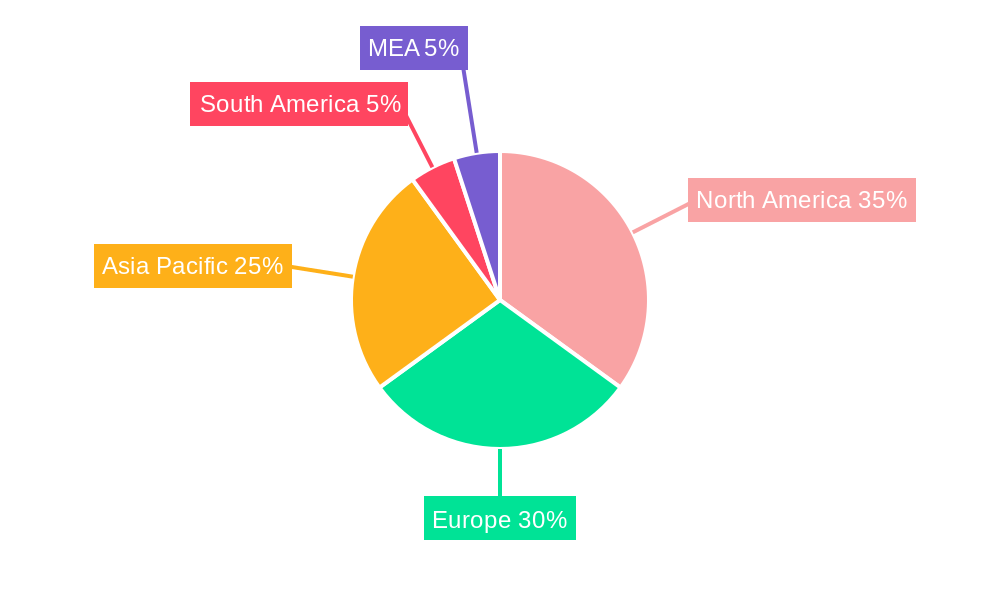
The forecast period (2025-2033) anticipates a steady increase in market size, primarily driven by the aforementioned factors. The hydrophilic segment is likely to dominate due to the increasing preference for environmentally friendly water-based formulations. Within applications, the paints and coatings segment will likely maintain its leading position, reflecting the substantial use of coalescing agents in architectural, industrial, and automotive applications. Growth will be geographically diverse, with North America and Europe maintaining a substantial market share due to established industrial infrastructure. However, rapid growth in Asia-Pacific will contribute significantly to the overall market expansion over the forecast period. Companies are expected to focus on product innovation, strategic partnerships, and expansion into emerging markets to capitalize on the growing demand. Sustainability initiatives and compliance with stringent environmental regulations will also play a crucial role in shaping the competitive landscape.
Coalescing Agents Market: A Comprehensive Report (2019-2033)
This comprehensive report offers an in-depth analysis of the global Coalescing Agents market, providing invaluable insights for stakeholders seeking to navigate this dynamic landscape. Covering the period from 2019 to 2033, with a focus on 2025, this report unveils market dynamics, trends, leading players, and future opportunities. The study utilizes a robust methodology incorporating both primary and secondary research, ensuring data accuracy and reliability. The global market size is projected to reach xx Million by 2033, showcasing significant growth potential.
Coalescing Agents Market Market Dynamics & Concentration
The Coalescing Agents market exhibits a moderately concentrated landscape, with key players such as Cargill Incorporated, Synthomer PLC, and BASF SE holding significant market share. The market share of the top five players is estimated at xx%, indicating the presence of both established players and emerging competitors. Innovation plays a crucial role, with companies investing heavily in R&D to develop advanced coalescing agents with improved performance characteristics and reduced environmental impact. Stringent regulatory frameworks, particularly concerning VOC emissions and environmental safety, significantly influence market dynamics. The market also witnesses continuous development of substitutes, pushing companies to innovate and maintain their competitive edge. End-user trends, particularly in the paints and coatings sector, drive demand for specific coalescing agent types, while M&A activities are contributing to market consolidation and expansion. Over the period 2019-2024, approximately xx M&A deals were recorded in the Coalescing Agents market, mostly involving smaller companies being acquired by larger players seeking to diversify and increase production capacity.
Coalescing Agents Market Industry Trends & Analysis
The Coalescing Agents market is experiencing robust growth, driven by a steady increase in the demand across various end-use industries. The projected Compound Annual Growth Rate (CAGR) for the forecast period (2025-2033) is estimated at xx%. This growth is fueled by several key factors: The increasing demand for high-performance coatings in various sectors like construction, automotive, and consumer goods is a major catalyst. Advancements in coalescing agent technology, leading to improved efficiency and reduced environmental impact, also contribute to market expansion. The rising adoption of water-based coatings to meet environmental regulations boosts the demand for hydrophilic coalescing agents. Growing awareness of sustainable practices is driving innovation towards biodegradable and environmentally friendly products, increasing the market share of such coalescing agents. Market penetration of advanced coalescing agents is gradually increasing, especially in niche segments, as improved performance and cost-effectiveness drive adoption. Competitive dynamics within the market involve price wars, strategic partnerships, and continuous product innovation.
Leading Markets & Segments in Coalescing Agents Market
The Paints & Coatings application segment dominates the Coalescing Agents market, holding an estimated xx% market share in 2025. The strong growth in this segment is driven by the increasing demand for high-quality paints and coatings in various end-use industries. Within the type segment, hydrophilic coalescing agents are more preferred, representing approximately xx% of the market in 2025, primarily due to their compatibility with water-based systems, which are widely used to meet environmental regulations.
Key Drivers for Paints & Coatings Dominance:
- Growing construction and infrastructure development globally.
- Rising demand for aesthetically pleasing and durable coatings in various sectors.
- Stringent environmental regulations favoring water-based coatings.
Regional Dominance:
North America holds a leading position in the Coalescing Agents market, driven by strong industrial growth, technological advancement, and a high per capita consumption of paints and coatings. The region is expected to maintain its market leadership during the forecast period.
Coalescing Agents Market Product Developments
Recent years have witnessed significant advancements in coalescing agent technology, focusing on improving performance, reducing environmental impact, and expanding applications. Manufacturers are focusing on developing high-performance coalescing agents with improved compatibility, enhanced film formation, and reduced VOC emissions. The increasing adoption of water-based systems is driving innovation towards water-soluble and biodegradable coalescing agents. These developments cater to the growing demand for environmentally friendly and sustainable solutions, offering substantial competitive advantages to manufacturers.
Key Drivers of Coalescing Agents Market Growth
Several factors are driving the growth of the Coalescing Agents market. Technological advancements leading to the development of more efficient and sustainable coalescing agents are paramount. The rising demand from various end-use industries, primarily paints and coatings, fuels market expansion. Favorable economic conditions in several regions stimulate growth. Government regulations promoting the use of environmentally friendly coatings are also impacting market dynamics.
Challenges in the Coalescing Agents Market Market
The Coalescing Agents market faces challenges such as fluctuating raw material prices, impacting production costs and profitability. Stringent environmental regulations necessitate significant investments in R&D for compliant products. Intense competition among established and emerging players creates pricing pressures. Supply chain disruptions, particularly during economic uncertainties, can significantly impact market availability and production cycles.
Emerging Opportunities in Coalescing Agents Market
The Coalescing Agents market presents several promising opportunities. Technological breakthroughs are leading to the development of advanced coalescing agents with improved properties and wider applications. Strategic partnerships between manufacturers and end-users can facilitate product development and market penetration. Expanding into new and emerging markets, particularly in developing economies, can unlock significant growth potential.
Leading Players in the Coalescing Agents Market Sector
- Cargill Incorporated
- Synthomer PLC
- Cristol
- Celanese Corporation
- Stepan Company
- Runtai Chemical Co Ltd
- BASF SE
- Arkema Group
- Rudolf GmbH
- Dow
- Eastman Chemical Company
Key Milestones in Coalescing Agents Market Industry
- 2020: BASF SE launches a new range of eco-friendly coalescing agents.
- 2022: Synthomer PLC acquires a smaller coalescing agent manufacturer, expanding its market presence.
- 2023: Several major players announce investments in R&D to develop next-generation coalescing agents.
Strategic Outlook for Coalescing Agents Market Market
The Coalescing Agents market is poised for continued growth, driven by technological advancements, increasing demand, and favorable regulatory environment. Strategic partnerships, focused R&D, and expansion into new markets will be key factors in achieving long-term success for industry players. The market is expected to witness further consolidation, with larger players acquiring smaller companies to strengthen their market position. The focus on sustainability and environmental compliance will continue to shape product development and market dynamics.
Coalescing Agents Market Segmentation
-
1. Type
- 1.1. Hydrophilic
- 1.2. Hydrophobic
-
2. Application
- 2.1. Adhesives & Sealants
- 2.2. Paints & Coatings
- 2.3. Inks
- 2.4. Personal Care
- 2.5. Other Applications (Decoloring, Polymer, etc.)
Coalescing Agents Market Segmentation By Geography
-
1. Asia Pacific
- 1.1. China
- 1.2. India
- 1.3. Japan
- 1.4. South Korea
- 1.5. Malaysia
- 1.6. Thailand
- 1.7. Indonesia
- 1.8. Vietnam
- 1.9. Rest of Asia Pacific
-
2. North America
- 2.1. United States
- 2.2. Canada
- 2.3. Mexico
-
3. Europe
- 3.1. Germany
- 3.2. United Kingdom
- 3.3. Italy
- 3.4. France
- 3.5. Spain
- 3.6. NORDIC Countries
- 3.7. Turkey
- 3.8. Russia
- 3.9. Rest of Europe
-
4. South America
- 4.1. Brazil
- 4.2. Argentina
- 4.3. Colombia
- 4.4. Rest of South America
-
5. Middle East and Africa
- 5.1. Saudi Arabia
- 5.2. South Africa
- 5.3. Nigeria
- 5.4. Qatar
- 5.5. Egypt
- 5.6. United Arab Emirates
- 5.7. Rest of Middle East and Africa
Coalescing Agents Market REPORT HIGHLIGHTS
| Aspects | Details |
|---|---|
| Study Period | 2019-2033 |
| Base Year | 2024 |
| Estimated Year | 2025 |
| Forecast Period | 2025-2033 |
| Historical Period | 2019-2024 |
| Growth Rate | CAGR of 4.96% from 2019-2033 |
| Segmentation |
|
Table of Contents
- 1. Introduction
- 1.1. Research Scope
- 1.2. Market Segmentation
- 1.3. Research Methodology
- 1.4. Definitions and Assumptions
- 2. Executive Summary
- 2.1. Introduction
- 3. Market Dynamics
- 3.1. Introduction
- 3.2. Market Drivers
- 3.2.1. Increasing Usage in Personal Care Items; Rising Demand for Architectural and Industrial Coatings in Asia; Other Drivers
- 3.3. Market Restrains
- 3.3.1. Stringent Environmemtal Regulations; Other Restraints
- 3.4. Market Trends
- 3.4.1. Increasing Demand from Paints and Coatings Segment
- 4. Market Factor Analysis
- 4.1. Porters Five Forces
- 4.2. Supply/Value Chain
- 4.3. PESTEL analysis
- 4.4. Market Entropy
- 4.5. Patent/Trademark Analysis
- 5. Global Coalescing Agents Market Analysis, Insights and Forecast, 2019-2031
- 5.1. Market Analysis, Insights and Forecast - by Type
- 5.1.1. Hydrophilic
- 5.1.2. Hydrophobic
- 5.2. Market Analysis, Insights and Forecast - by Application
- 5.2.1. Adhesives & Sealants
- 5.2.2. Paints & Coatings
- 5.2.3. Inks
- 5.2.4. Personal Care
- 5.2.5. Other Applications (Decoloring, Polymer, etc.)
- 5.3. Market Analysis, Insights and Forecast - by Region
- 5.3.1. Asia Pacific
- 5.3.2. North America
- 5.3.3. Europe
- 5.3.4. South America
- 5.3.5. Middle East and Africa
- 5.1. Market Analysis, Insights and Forecast - by Type
- 6. Asia Pacific Coalescing Agents Market Analysis, Insights and Forecast, 2019-2031
- 6.1. Market Analysis, Insights and Forecast - by Type
- 6.1.1. Hydrophilic
- 6.1.2. Hydrophobic
- 6.2. Market Analysis, Insights and Forecast - by Application
- 6.2.1. Adhesives & Sealants
- 6.2.2. Paints & Coatings
- 6.2.3. Inks
- 6.2.4. Personal Care
- 6.2.5. Other Applications (Decoloring, Polymer, etc.)
- 6.1. Market Analysis, Insights and Forecast - by Type
- 7. North America Coalescing Agents Market Analysis, Insights and Forecast, 2019-2031
- 7.1. Market Analysis, Insights and Forecast - by Type
- 7.1.1. Hydrophilic
- 7.1.2. Hydrophobic
- 7.2. Market Analysis, Insights and Forecast - by Application
- 7.2.1. Adhesives & Sealants
- 7.2.2. Paints & Coatings
- 7.2.3. Inks
- 7.2.4. Personal Care
- 7.2.5. Other Applications (Decoloring, Polymer, etc.)
- 7.1. Market Analysis, Insights and Forecast - by Type
- 8. Europe Coalescing Agents Market Analysis, Insights and Forecast, 2019-2031
- 8.1. Market Analysis, Insights and Forecast - by Type
- 8.1.1. Hydrophilic
- 8.1.2. Hydrophobic
- 8.2. Market Analysis, Insights and Forecast - by Application
- 8.2.1. Adhesives & Sealants
- 8.2.2. Paints & Coatings
- 8.2.3. Inks
- 8.2.4. Personal Care
- 8.2.5. Other Applications (Decoloring, Polymer, etc.)
- 8.1. Market Analysis, Insights and Forecast - by Type
- 9. South America Coalescing Agents Market Analysis, Insights and Forecast, 2019-2031
- 9.1. Market Analysis, Insights and Forecast - by Type
- 9.1.1. Hydrophilic
- 9.1.2. Hydrophobic
- 9.2. Market Analysis, Insights and Forecast - by Application
- 9.2.1. Adhesives & Sealants
- 9.2.2. Paints & Coatings
- 9.2.3. Inks
- 9.2.4. Personal Care
- 9.2.5. Other Applications (Decoloring, Polymer, etc.)
- 9.1. Market Analysis, Insights and Forecast - by Type
- 10. Middle East and Africa Coalescing Agents Market Analysis, Insights and Forecast, 2019-2031
- 10.1. Market Analysis, Insights and Forecast - by Type
- 10.1.1. Hydrophilic
- 10.1.2. Hydrophobic
- 10.2. Market Analysis, Insights and Forecast - by Application
- 10.2.1. Adhesives & Sealants
- 10.2.2. Paints & Coatings
- 10.2.3. Inks
- 10.2.4. Personal Care
- 10.2.5. Other Applications (Decoloring, Polymer, etc.)
- 10.1. Market Analysis, Insights and Forecast - by Type
- 11. North America Coalescing Agents Market Analysis, Insights and Forecast, 2019-2031
- 11.1. Market Analysis, Insights and Forecast - By Country/Sub-region
- 11.1.1 United States
- 11.1.2 Canada
- 11.1.3 Mexico
- 12. Europe Coalescing Agents Market Analysis, Insights and Forecast, 2019-2031
- 12.1. Market Analysis, Insights and Forecast - By Country/Sub-region
- 12.1.1 Germany
- 12.1.2 France
- 12.1.3 Italy
- 12.1.4 United Kingdom
- 12.1.5 Netherlands
- 12.1.6 Rest of Europe
- 13. Asia Pacific Coalescing Agents Market Analysis, Insights and Forecast, 2019-2031
- 13.1. Market Analysis, Insights and Forecast - By Country/Sub-region
- 13.1.1 China
- 13.1.2 Japan
- 13.1.3 India
- 13.1.4 South Korea
- 13.1.5 Taiwan
- 13.1.6 Australia
- 13.1.7 Rest of Asia-Pacific
- 14. South America Coalescing Agents Market Analysis, Insights and Forecast, 2019-2031
- 14.1. Market Analysis, Insights and Forecast - By Country/Sub-region
- 14.1.1 Brazil
- 14.1.2 Argentina
- 14.1.3 Rest of South America
- 15. MEA Coalescing Agents Market Analysis, Insights and Forecast, 2019-2031
- 15.1. Market Analysis, Insights and Forecast - By Country/Sub-region
- 15.1.1 Middle East
- 15.1.2 Africa
- 16. Competitive Analysis
- 16.1. Global Market Share Analysis 2024
- 16.2. Company Profiles
- 16.2.1 Cargill Incorporated
- 16.2.1.1. Overview
- 16.2.1.2. Products
- 16.2.1.3. SWOT Analysis
- 16.2.1.4. Recent Developments
- 16.2.1.5. Financials (Based on Availability)
- 16.2.2 Synthomer PLC
- 16.2.2.1. Overview
- 16.2.2.2. Products
- 16.2.2.3. SWOT Analysis
- 16.2.2.4. Recent Developments
- 16.2.2.5. Financials (Based on Availability)
- 16.2.3 Cristol
- 16.2.3.1. Overview
- 16.2.3.2. Products
- 16.2.3.3. SWOT Analysis
- 16.2.3.4. Recent Developments
- 16.2.3.5. Financials (Based on Availability)
- 16.2.4 Celanese Corporation
- 16.2.4.1. Overview
- 16.2.4.2. Products
- 16.2.4.3. SWOT Analysis
- 16.2.4.4. Recent Developments
- 16.2.4.5. Financials (Based on Availability)
- 16.2.5 Stepan Company
- 16.2.5.1. Overview
- 16.2.5.2. Products
- 16.2.5.3. SWOT Analysis
- 16.2.5.4. Recent Developments
- 16.2.5.5. Financials (Based on Availability)
- 16.2.6 Runtai Chemical Co Ltd
- 16.2.6.1. Overview
- 16.2.6.2. Products
- 16.2.6.3. SWOT Analysis
- 16.2.6.4. Recent Developments
- 16.2.6.5. Financials (Based on Availability)
- 16.2.7 BASF SE
- 16.2.7.1. Overview
- 16.2.7.2. Products
- 16.2.7.3. SWOT Analysis
- 16.2.7.4. Recent Developments
- 16.2.7.5. Financials (Based on Availability)
- 16.2.8 Arkema Group
- 16.2.8.1. Overview
- 16.2.8.2. Products
- 16.2.8.3. SWOT Analysis
- 16.2.8.4. Recent Developments
- 16.2.8.5. Financials (Based on Availability)
- 16.2.9 Rudolf GmbH
- 16.2.9.1. Overview
- 16.2.9.2. Products
- 16.2.9.3. SWOT Analysis
- 16.2.9.4. Recent Developments
- 16.2.9.5. Financials (Based on Availability)
- 16.2.10 Dow
- 16.2.10.1. Overview
- 16.2.10.2. Products
- 16.2.10.3. SWOT Analysis
- 16.2.10.4. Recent Developments
- 16.2.10.5. Financials (Based on Availability)
- 16.2.11 Eastman Chemical Company
- 16.2.11.1. Overview
- 16.2.11.2. Products
- 16.2.11.3. SWOT Analysis
- 16.2.11.4. Recent Developments
- 16.2.11.5. Financials (Based on Availability)
- 16.2.1 Cargill Incorporated
List of Figures
- Figure 1: Global Coalescing Agents Market Revenue Breakdown (Million, %) by Region 2024 & 2032
- Figure 2: Global Coalescing Agents Market Volume Breakdown (K Tons, %) by Region 2024 & 2032
- Figure 3: North America Coalescing Agents Market Revenue (Million), by Country 2024 & 2032
- Figure 4: North America Coalescing Agents Market Volume (K Tons), by Country 2024 & 2032
- Figure 5: North America Coalescing Agents Market Revenue Share (%), by Country 2024 & 2032
- Figure 6: North America Coalescing Agents Market Volume Share (%), by Country 2024 & 2032
- Figure 7: Europe Coalescing Agents Market Revenue (Million), by Country 2024 & 2032
- Figure 8: Europe Coalescing Agents Market Volume (K Tons), by Country 2024 & 2032
- Figure 9: Europe Coalescing Agents Market Revenue Share (%), by Country 2024 & 2032
- Figure 10: Europe Coalescing Agents Market Volume Share (%), by Country 2024 & 2032
- Figure 11: Asia Pacific Coalescing Agents Market Revenue (Million), by Country 2024 & 2032
- Figure 12: Asia Pacific Coalescing Agents Market Volume (K Tons), by Country 2024 & 2032
- Figure 13: Asia Pacific Coalescing Agents Market Revenue Share (%), by Country 2024 & 2032
- Figure 14: Asia Pacific Coalescing Agents Market Volume Share (%), by Country 2024 & 2032
- Figure 15: South America Coalescing Agents Market Revenue (Million), by Country 2024 & 2032
- Figure 16: South America Coalescing Agents Market Volume (K Tons), by Country 2024 & 2032
- Figure 17: South America Coalescing Agents Market Revenue Share (%), by Country 2024 & 2032
- Figure 18: South America Coalescing Agents Market Volume Share (%), by Country 2024 & 2032
- Figure 19: MEA Coalescing Agents Market Revenue (Million), by Country 2024 & 2032
- Figure 20: MEA Coalescing Agents Market Volume (K Tons), by Country 2024 & 2032
- Figure 21: MEA Coalescing Agents Market Revenue Share (%), by Country 2024 & 2032
- Figure 22: MEA Coalescing Agents Market Volume Share (%), by Country 2024 & 2032
- Figure 23: Asia Pacific Coalescing Agents Market Revenue (Million), by Type 2024 & 2032
- Figure 24: Asia Pacific Coalescing Agents Market Volume (K Tons), by Type 2024 & 2032
- Figure 25: Asia Pacific Coalescing Agents Market Revenue Share (%), by Type 2024 & 2032
- Figure 26: Asia Pacific Coalescing Agents Market Volume Share (%), by Type 2024 & 2032
- Figure 27: Asia Pacific Coalescing Agents Market Revenue (Million), by Application 2024 & 2032
- Figure 28: Asia Pacific Coalescing Agents Market Volume (K Tons), by Application 2024 & 2032
- Figure 29: Asia Pacific Coalescing Agents Market Revenue Share (%), by Application 2024 & 2032
- Figure 30: Asia Pacific Coalescing Agents Market Volume Share (%), by Application 2024 & 2032
- Figure 31: Asia Pacific Coalescing Agents Market Revenue (Million), by Country 2024 & 2032
- Figure 32: Asia Pacific Coalescing Agents Market Volume (K Tons), by Country 2024 & 2032
- Figure 33: Asia Pacific Coalescing Agents Market Revenue Share (%), by Country 2024 & 2032
- Figure 34: Asia Pacific Coalescing Agents Market Volume Share (%), by Country 2024 & 2032
- Figure 35: North America Coalescing Agents Market Revenue (Million), by Type 2024 & 2032
- Figure 36: North America Coalescing Agents Market Volume (K Tons), by Type 2024 & 2032
- Figure 37: North America Coalescing Agents Market Revenue Share (%), by Type 2024 & 2032
- Figure 38: North America Coalescing Agents Market Volume Share (%), by Type 2024 & 2032
- Figure 39: North America Coalescing Agents Market Revenue (Million), by Application 2024 & 2032
- Figure 40: North America Coalescing Agents Market Volume (K Tons), by Application 2024 & 2032
- Figure 41: North America Coalescing Agents Market Revenue Share (%), by Application 2024 & 2032
- Figure 42: North America Coalescing Agents Market Volume Share (%), by Application 2024 & 2032
- Figure 43: North America Coalescing Agents Market Revenue (Million), by Country 2024 & 2032
- Figure 44: North America Coalescing Agents Market Volume (K Tons), by Country 2024 & 2032
- Figure 45: North America Coalescing Agents Market Revenue Share (%), by Country 2024 & 2032
- Figure 46: North America Coalescing Agents Market Volume Share (%), by Country 2024 & 2032
- Figure 47: Europe Coalescing Agents Market Revenue (Million), by Type 2024 & 2032
- Figure 48: Europe Coalescing Agents Market Volume (K Tons), by Type 2024 & 2032
- Figure 49: Europe Coalescing Agents Market Revenue Share (%), by Type 2024 & 2032
- Figure 50: Europe Coalescing Agents Market Volume Share (%), by Type 2024 & 2032
- Figure 51: Europe Coalescing Agents Market Revenue (Million), by Application 2024 & 2032
- Figure 52: Europe Coalescing Agents Market Volume (K Tons), by Application 2024 & 2032
- Figure 53: Europe Coalescing Agents Market Revenue Share (%), by Application 2024 & 2032
- Figure 54: Europe Coalescing Agents Market Volume Share (%), by Application 2024 & 2032
- Figure 55: Europe Coalescing Agents Market Revenue (Million), by Country 2024 & 2032
- Figure 56: Europe Coalescing Agents Market Volume (K Tons), by Country 2024 & 2032
- Figure 57: Europe Coalescing Agents Market Revenue Share (%), by Country 2024 & 2032
- Figure 58: Europe Coalescing Agents Market Volume Share (%), by Country 2024 & 2032
- Figure 59: South America Coalescing Agents Market Revenue (Million), by Type 2024 & 2032
- Figure 60: South America Coalescing Agents Market Volume (K Tons), by Type 2024 & 2032
- Figure 61: South America Coalescing Agents Market Revenue Share (%), by Type 2024 & 2032
- Figure 62: South America Coalescing Agents Market Volume Share (%), by Type 2024 & 2032
- Figure 63: South America Coalescing Agents Market Revenue (Million), by Application 2024 & 2032
- Figure 64: South America Coalescing Agents Market Volume (K Tons), by Application 2024 & 2032
- Figure 65: South America Coalescing Agents Market Revenue Share (%), by Application 2024 & 2032
- Figure 66: South America Coalescing Agents Market Volume Share (%), by Application 2024 & 2032
- Figure 67: South America Coalescing Agents Market Revenue (Million), by Country 2024 & 2032
- Figure 68: South America Coalescing Agents Market Volume (K Tons), by Country 2024 & 2032
- Figure 69: South America Coalescing Agents Market Revenue Share (%), by Country 2024 & 2032
- Figure 70: South America Coalescing Agents Market Volume Share (%), by Country 2024 & 2032
- Figure 71: Middle East and Africa Coalescing Agents Market Revenue (Million), by Type 2024 & 2032
- Figure 72: Middle East and Africa Coalescing Agents Market Volume (K Tons), by Type 2024 & 2032
- Figure 73: Middle East and Africa Coalescing Agents Market Revenue Share (%), by Type 2024 & 2032
- Figure 74: Middle East and Africa Coalescing Agents Market Volume Share (%), by Type 2024 & 2032
- Figure 75: Middle East and Africa Coalescing Agents Market Revenue (Million), by Application 2024 & 2032
- Figure 76: Middle East and Africa Coalescing Agents Market Volume (K Tons), by Application 2024 & 2032
- Figure 77: Middle East and Africa Coalescing Agents Market Revenue Share (%), by Application 2024 & 2032
- Figure 78: Middle East and Africa Coalescing Agents Market Volume Share (%), by Application 2024 & 2032
- Figure 79: Middle East and Africa Coalescing Agents Market Revenue (Million), by Country 2024 & 2032
- Figure 80: Middle East and Africa Coalescing Agents Market Volume (K Tons), by Country 2024 & 2032
- Figure 81: Middle East and Africa Coalescing Agents Market Revenue Share (%), by Country 2024 & 2032
- Figure 82: Middle East and Africa Coalescing Agents Market Volume Share (%), by Country 2024 & 2032
List of Tables
- Table 1: Global Coalescing Agents Market Revenue Million Forecast, by Region 2019 & 2032
- Table 2: Global Coalescing Agents Market Volume K Tons Forecast, by Region 2019 & 2032
- Table 3: Global Coalescing Agents Market Revenue Million Forecast, by Type 2019 & 2032
- Table 4: Global Coalescing Agents Market Volume K Tons Forecast, by Type 2019 & 2032
- Table 5: Global Coalescing Agents Market Revenue Million Forecast, by Application 2019 & 2032
- Table 6: Global Coalescing Agents Market Volume K Tons Forecast, by Application 2019 & 2032
- Table 7: Global Coalescing Agents Market Revenue Million Forecast, by Region 2019 & 2032
- Table 8: Global Coalescing Agents Market Volume K Tons Forecast, by Region 2019 & 2032
- Table 9: Global Coalescing Agents Market Revenue Million Forecast, by Country 2019 & 2032
- Table 10: Global Coalescing Agents Market Volume K Tons Forecast, by Country 2019 & 2032
- Table 11: United States Coalescing Agents Market Revenue (Million) Forecast, by Application 2019 & 2032
- Table 12: United States Coalescing Agents Market Volume (K Tons) Forecast, by Application 2019 & 2032
- Table 13: Canada Coalescing Agents Market Revenue (Million) Forecast, by Application 2019 & 2032
- Table 14: Canada Coalescing Agents Market Volume (K Tons) Forecast, by Application 2019 & 2032
- Table 15: Mexico Coalescing Agents Market Revenue (Million) Forecast, by Application 2019 & 2032
- Table 16: Mexico Coalescing Agents Market Volume (K Tons) Forecast, by Application 2019 & 2032
- Table 17: Global Coalescing Agents Market Revenue Million Forecast, by Country 2019 & 2032
- Table 18: Global Coalescing Agents Market Volume K Tons Forecast, by Country 2019 & 2032
- Table 19: Germany Coalescing Agents Market Revenue (Million) Forecast, by Application 2019 & 2032
- Table 20: Germany Coalescing Agents Market Volume (K Tons) Forecast, by Application 2019 & 2032
- Table 21: France Coalescing Agents Market Revenue (Million) Forecast, by Application 2019 & 2032
- Table 22: France Coalescing Agents Market Volume (K Tons) Forecast, by Application 2019 & 2032
- Table 23: Italy Coalescing Agents Market Revenue (Million) Forecast, by Application 2019 & 2032
- Table 24: Italy Coalescing Agents Market Volume (K Tons) Forecast, by Application 2019 & 2032
- Table 25: United Kingdom Coalescing Agents Market Revenue (Million) Forecast, by Application 2019 & 2032
- Table 26: United Kingdom Coalescing Agents Market Volume (K Tons) Forecast, by Application 2019 & 2032
- Table 27: Netherlands Coalescing Agents Market Revenue (Million) Forecast, by Application 2019 & 2032
- Table 28: Netherlands Coalescing Agents Market Volume (K Tons) Forecast, by Application 2019 & 2032
- Table 29: Rest of Europe Coalescing Agents Market Revenue (Million) Forecast, by Application 2019 & 2032
- Table 30: Rest of Europe Coalescing Agents Market Volume (K Tons) Forecast, by Application 2019 & 2032
- Table 31: Global Coalescing Agents Market Revenue Million Forecast, by Country 2019 & 2032
- Table 32: Global Coalescing Agents Market Volume K Tons Forecast, by Country 2019 & 2032
- Table 33: China Coalescing Agents Market Revenue (Million) Forecast, by Application 2019 & 2032
- Table 34: China Coalescing Agents Market Volume (K Tons) Forecast, by Application 2019 & 2032
- Table 35: Japan Coalescing Agents Market Revenue (Million) Forecast, by Application 2019 & 2032
- Table 36: Japan Coalescing Agents Market Volume (K Tons) Forecast, by Application 2019 & 2032
- Table 37: India Coalescing Agents Market Revenue (Million) Forecast, by Application 2019 & 2032
- Table 38: India Coalescing Agents Market Volume (K Tons) Forecast, by Application 2019 & 2032
- Table 39: South Korea Coalescing Agents Market Revenue (Million) Forecast, by Application 2019 & 2032
- Table 40: South Korea Coalescing Agents Market Volume (K Tons) Forecast, by Application 2019 & 2032
- Table 41: Taiwan Coalescing Agents Market Revenue (Million) Forecast, by Application 2019 & 2032
- Table 42: Taiwan Coalescing Agents Market Volume (K Tons) Forecast, by Application 2019 & 2032
- Table 43: Australia Coalescing Agents Market Revenue (Million) Forecast, by Application 2019 & 2032
- Table 44: Australia Coalescing Agents Market Volume (K Tons) Forecast, by Application 2019 & 2032
- Table 45: Rest of Asia-Pacific Coalescing Agents Market Revenue (Million) Forecast, by Application 2019 & 2032
- Table 46: Rest of Asia-Pacific Coalescing Agents Market Volume (K Tons) Forecast, by Application 2019 & 2032
- Table 47: Global Coalescing Agents Market Revenue Million Forecast, by Country 2019 & 2032
- Table 48: Global Coalescing Agents Market Volume K Tons Forecast, by Country 2019 & 2032
- Table 49: Brazil Coalescing Agents Market Revenue (Million) Forecast, by Application 2019 & 2032
- Table 50: Brazil Coalescing Agents Market Volume (K Tons) Forecast, by Application 2019 & 2032
- Table 51: Argentina Coalescing Agents Market Revenue (Million) Forecast, by Application 2019 & 2032
- Table 52: Argentina Coalescing Agents Market Volume (K Tons) Forecast, by Application 2019 & 2032
- Table 53: Rest of South America Coalescing Agents Market Revenue (Million) Forecast, by Application 2019 & 2032
- Table 54: Rest of South America Coalescing Agents Market Volume (K Tons) Forecast, by Application 2019 & 2032
- Table 55: Global Coalescing Agents Market Revenue Million Forecast, by Country 2019 & 2032
- Table 56: Global Coalescing Agents Market Volume K Tons Forecast, by Country 2019 & 2032
- Table 57: Middle East Coalescing Agents Market Revenue (Million) Forecast, by Application 2019 & 2032
- Table 58: Middle East Coalescing Agents Market Volume (K Tons) Forecast, by Application 2019 & 2032
- Table 59: Africa Coalescing Agents Market Revenue (Million) Forecast, by Application 2019 & 2032
- Table 60: Africa Coalescing Agents Market Volume (K Tons) Forecast, by Application 2019 & 2032
- Table 61: Global Coalescing Agents Market Revenue Million Forecast, by Type 2019 & 2032
- Table 62: Global Coalescing Agents Market Volume K Tons Forecast, by Type 2019 & 2032
- Table 63: Global Coalescing Agents Market Revenue Million Forecast, by Application 2019 & 2032
- Table 64: Global Coalescing Agents Market Volume K Tons Forecast, by Application 2019 & 2032
- Table 65: Global Coalescing Agents Market Revenue Million Forecast, by Country 2019 & 2032
- Table 66: Global Coalescing Agents Market Volume K Tons Forecast, by Country 2019 & 2032
- Table 67: China Coalescing Agents Market Revenue (Million) Forecast, by Application 2019 & 2032
- Table 68: China Coalescing Agents Market Volume (K Tons) Forecast, by Application 2019 & 2032
- Table 69: India Coalescing Agents Market Revenue (Million) Forecast, by Application 2019 & 2032
- Table 70: India Coalescing Agents Market Volume (K Tons) Forecast, by Application 2019 & 2032
- Table 71: Japan Coalescing Agents Market Revenue (Million) Forecast, by Application 2019 & 2032
- Table 72: Japan Coalescing Agents Market Volume (K Tons) Forecast, by Application 2019 & 2032
- Table 73: South Korea Coalescing Agents Market Revenue (Million) Forecast, by Application 2019 & 2032
- Table 74: South Korea Coalescing Agents Market Volume (K Tons) Forecast, by Application 2019 & 2032
- Table 75: Malaysia Coalescing Agents Market Revenue (Million) Forecast, by Application 2019 & 2032
- Table 76: Malaysia Coalescing Agents Market Volume (K Tons) Forecast, by Application 2019 & 2032
- Table 77: Thailand Coalescing Agents Market Revenue (Million) Forecast, by Application 2019 & 2032
- Table 78: Thailand Coalescing Agents Market Volume (K Tons) Forecast, by Application 2019 & 2032
- Table 79: Indonesia Coalescing Agents Market Revenue (Million) Forecast, by Application 2019 & 2032
- Table 80: Indonesia Coalescing Agents Market Volume (K Tons) Forecast, by Application 2019 & 2032
- Table 81: Vietnam Coalescing Agents Market Revenue (Million) Forecast, by Application 2019 & 2032
- Table 82: Vietnam Coalescing Agents Market Volume (K Tons) Forecast, by Application 2019 & 2032
- Table 83: Rest of Asia Pacific Coalescing Agents Market Revenue (Million) Forecast, by Application 2019 & 2032
- Table 84: Rest of Asia Pacific Coalescing Agents Market Volume (K Tons) Forecast, by Application 2019 & 2032
- Table 85: Global Coalescing Agents Market Revenue Million Forecast, by Type 2019 & 2032
- Table 86: Global Coalescing Agents Market Volume K Tons Forecast, by Type 2019 & 2032
- Table 87: Global Coalescing Agents Market Revenue Million Forecast, by Application 2019 & 2032
- Table 88: Global Coalescing Agents Market Volume K Tons Forecast, by Application 2019 & 2032
- Table 89: Global Coalescing Agents Market Revenue Million Forecast, by Country 2019 & 2032
- Table 90: Global Coalescing Agents Market Volume K Tons Forecast, by Country 2019 & 2032
- Table 91: United States Coalescing Agents Market Revenue (Million) Forecast, by Application 2019 & 2032
- Table 92: United States Coalescing Agents Market Volume (K Tons) Forecast, by Application 2019 & 2032
- Table 93: Canada Coalescing Agents Market Revenue (Million) Forecast, by Application 2019 & 2032
- Table 94: Canada Coalescing Agents Market Volume (K Tons) Forecast, by Application 2019 & 2032
- Table 95: Mexico Coalescing Agents Market Revenue (Million) Forecast, by Application 2019 & 2032
- Table 96: Mexico Coalescing Agents Market Volume (K Tons) Forecast, by Application 2019 & 2032
- Table 97: Global Coalescing Agents Market Revenue Million Forecast, by Type 2019 & 2032
- Table 98: Global Coalescing Agents Market Volume K Tons Forecast, by Type 2019 & 2032
- Table 99: Global Coalescing Agents Market Revenue Million Forecast, by Application 2019 & 2032
- Table 100: Global Coalescing Agents Market Volume K Tons Forecast, by Application 2019 & 2032
- Table 101: Global Coalescing Agents Market Revenue Million Forecast, by Country 2019 & 2032
- Table 102: Global Coalescing Agents Market Volume K Tons Forecast, by Country 2019 & 2032
- Table 103: Germany Coalescing Agents Market Revenue (Million) Forecast, by Application 2019 & 2032
- Table 104: Germany Coalescing Agents Market Volume (K Tons) Forecast, by Application 2019 & 2032
- Table 105: United Kingdom Coalescing Agents Market Revenue (Million) Forecast, by Application 2019 & 2032
- Table 106: United Kingdom Coalescing Agents Market Volume (K Tons) Forecast, by Application 2019 & 2032
- Table 107: Italy Coalescing Agents Market Revenue (Million) Forecast, by Application 2019 & 2032
- Table 108: Italy Coalescing Agents Market Volume (K Tons) Forecast, by Application 2019 & 2032
- Table 109: France Coalescing Agents Market Revenue (Million) Forecast, by Application 2019 & 2032
- Table 110: France Coalescing Agents Market Volume (K Tons) Forecast, by Application 2019 & 2032
- Table 111: Spain Coalescing Agents Market Revenue (Million) Forecast, by Application 2019 & 2032
- Table 112: Spain Coalescing Agents Market Volume (K Tons) Forecast, by Application 2019 & 2032
- Table 113: NORDIC Countries Coalescing Agents Market Revenue (Million) Forecast, by Application 2019 & 2032
- Table 114: NORDIC Countries Coalescing Agents Market Volume (K Tons) Forecast, by Application 2019 & 2032
- Table 115: Turkey Coalescing Agents Market Revenue (Million) Forecast, by Application 2019 & 2032
- Table 116: Turkey Coalescing Agents Market Volume (K Tons) Forecast, by Application 2019 & 2032
- Table 117: Russia Coalescing Agents Market Revenue (Million) Forecast, by Application 2019 & 2032
- Table 118: Russia Coalescing Agents Market Volume (K Tons) Forecast, by Application 2019 & 2032
- Table 119: Rest of Europe Coalescing Agents Market Revenue (Million) Forecast, by Application 2019 & 2032
- Table 120: Rest of Europe Coalescing Agents Market Volume (K Tons) Forecast, by Application 2019 & 2032
- Table 121: Global Coalescing Agents Market Revenue Million Forecast, by Type 2019 & 2032
- Table 122: Global Coalescing Agents Market Volume K Tons Forecast, by Type 2019 & 2032
- Table 123: Global Coalescing Agents Market Revenue Million Forecast, by Application 2019 & 2032
- Table 124: Global Coalescing Agents Market Volume K Tons Forecast, by Application 2019 & 2032
- Table 125: Global Coalescing Agents Market Revenue Million Forecast, by Country 2019 & 2032
- Table 126: Global Coalescing Agents Market Volume K Tons Forecast, by Country 2019 & 2032
- Table 127: Brazil Coalescing Agents Market Revenue (Million) Forecast, by Application 2019 & 2032
- Table 128: Brazil Coalescing Agents Market Volume (K Tons) Forecast, by Application 2019 & 2032
- Table 129: Argentina Coalescing Agents Market Revenue (Million) Forecast, by Application 2019 & 2032
- Table 130: Argentina Coalescing Agents Market Volume (K Tons) Forecast, by Application 2019 & 2032
- Table 131: Colombia Coalescing Agents Market Revenue (Million) Forecast, by Application 2019 & 2032
- Table 132: Colombia Coalescing Agents Market Volume (K Tons) Forecast, by Application 2019 & 2032
- Table 133: Rest of South America Coalescing Agents Market Revenue (Million) Forecast, by Application 2019 & 2032
- Table 134: Rest of South America Coalescing Agents Market Volume (K Tons) Forecast, by Application 2019 & 2032
- Table 135: Global Coalescing Agents Market Revenue Million Forecast, by Type 2019 & 2032
- Table 136: Global Coalescing Agents Market Volume K Tons Forecast, by Type 2019 & 2032
- Table 137: Global Coalescing Agents Market Revenue Million Forecast, by Application 2019 & 2032
- Table 138: Global Coalescing Agents Market Volume K Tons Forecast, by Application 2019 & 2032
- Table 139: Global Coalescing Agents Market Revenue Million Forecast, by Country 2019 & 2032
- Table 140: Global Coalescing Agents Market Volume K Tons Forecast, by Country 2019 & 2032
- Table 141: Saudi Arabia Coalescing Agents Market Revenue (Million) Forecast, by Application 2019 & 2032
- Table 142: Saudi Arabia Coalescing Agents Market Volume (K Tons) Forecast, by Application 2019 & 2032
- Table 143: South Africa Coalescing Agents Market Revenue (Million) Forecast, by Application 2019 & 2032
- Table 144: South Africa Coalescing Agents Market Volume (K Tons) Forecast, by Application 2019 & 2032
- Table 145: Nigeria Coalescing Agents Market Revenue (Million) Forecast, by Application 2019 & 2032
- Table 146: Nigeria Coalescing Agents Market Volume (K Tons) Forecast, by Application 2019 & 2032
- Table 147: Qatar Coalescing Agents Market Revenue (Million) Forecast, by Application 2019 & 2032
- Table 148: Qatar Coalescing Agents Market Volume (K Tons) Forecast, by Application 2019 & 2032
- Table 149: Egypt Coalescing Agents Market Revenue (Million) Forecast, by Application 2019 & 2032
- Table 150: Egypt Coalescing Agents Market Volume (K Tons) Forecast, by Application 2019 & 2032
- Table 151: United Arab Emirates Coalescing Agents Market Revenue (Million) Forecast, by Application 2019 & 2032
- Table 152: United Arab Emirates Coalescing Agents Market Volume (K Tons) Forecast, by Application 2019 & 2032
- Table 153: Rest of Middle East and Africa Coalescing Agents Market Revenue (Million) Forecast, by Application 2019 & 2032
- Table 154: Rest of Middle East and Africa Coalescing Agents Market Volume (K Tons) Forecast, by Application 2019 & 2032
Frequently Asked Questions
1. What is the projected Compound Annual Growth Rate (CAGR) of the Coalescing Agents Market?
The projected CAGR is approximately 4.96%.
2. Which companies are prominent players in the Coalescing Agents Market?
Key companies in the market include Cargill Incorporated, Synthomer PLC, Cristol, Celanese Corporation, Stepan Company, Runtai Chemical Co Ltd, BASF SE, Arkema Group, Rudolf GmbH, Dow, Eastman Chemical Company.
3. What are the main segments of the Coalescing Agents Market?
The market segments include Type, Application.
4. Can you provide details about the market size?
The market size is estimated to be USD 1.12 Million as of 2022.
5. What are some drivers contributing to market growth?
Increasing Usage in Personal Care Items; Rising Demand for Architectural and Industrial Coatings in Asia; Other Drivers.
6. What are the notable trends driving market growth?
Increasing Demand from Paints and Coatings Segment.
7. Are there any restraints impacting market growth?
Stringent Environmemtal Regulations; Other Restraints.
8. Can you provide examples of recent developments in the market?
N/A
9. What pricing options are available for accessing the report?
Pricing options include single-user, multi-user, and enterprise licenses priced at USD 4750, USD 5250, and USD 8750 respectively.
10. Is the market size provided in terms of value or volume?
The market size is provided in terms of value, measured in Million and volume, measured in K Tons.
11. Are there any specific market keywords associated with the report?
Yes, the market keyword associated with the report is "Coalescing Agents Market," which aids in identifying and referencing the specific market segment covered.
12. How do I determine which pricing option suits my needs best?
The pricing options vary based on user requirements and access needs. Individual users may opt for single-user licenses, while businesses requiring broader access may choose multi-user or enterprise licenses for cost-effective access to the report.
13. Are there any additional resources or data provided in the Coalescing Agents Market report?
While the report offers comprehensive insights, it's advisable to review the specific contents or supplementary materials provided to ascertain if additional resources or data are available.
14. How can I stay updated on further developments or reports in the Coalescing Agents Market?
To stay informed about further developments, trends, and reports in the Coalescing Agents Market, consider subscribing to industry newsletters, following relevant companies and organizations, or regularly checking reputable industry news sources and publications.
Methodology
Step 1 - Identification of Relevant Samples Size from Population Database


Step 2 - Approaches for Defining Global Market Size (Value, Volume* & Price*)

Note*: In applicable scenarios
Step 3 - Data Sources
Primary Research
- Web Analytics
- Survey Reports
- Research Institute
- Latest Research Reports
- Opinion Leaders
Secondary Research
- Annual Reports
- White Paper
- Latest Press Release
- Industry Association
- Paid Database
- Investor Presentations

Step 4 - Data Triangulation
Involves using different sources of information in order to increase the validity of a study
These sources are likely to be stakeholders in a program - participants, other researchers, program staff, other community members, and so on.
Then we put all data in single framework & apply various statistical tools to find out the dynamic on the market.
During the analysis stage, feedback from the stakeholder groups would be compared to determine areas of agreement as well as areas of divergence
