

Key Insights
The Asia-Pacific clean label ingredients market is experiencing robust growth, driven by increasing consumer awareness of food additives and a rising preference for natural and minimally processed foods. This burgeoning demand is particularly pronounced in countries like China, Japan, India, and Australia, where a growing middle class with greater disposable income fuels the adoption of premium, health-conscious food products. The market's expansion is further propelled by stringent government regulations regarding food labeling and the increasing prevalence of allergies and intolerances, pushing manufacturers to adopt cleaner ingredient profiles. Key segments like food sweeteners (driven by demand for natural alternatives like stevia and monk fruit), preservatives (with a focus on plant-based options), and colorants (utilizing natural pigments) are experiencing above-average growth. The beverage, bakery and confectionery, and dairy and frozen dessert applications are major consumers of clean label ingredients, reflecting the sector’s overall focus on improving product quality and attracting health-conscious consumers. While challenges exist, such as the higher cost of sourcing and producing clean label ingredients compared to conventional alternatives, the long-term growth trajectory remains positive, supported by consistent consumer preference and regulatory developments favoring transparency and natural ingredients.
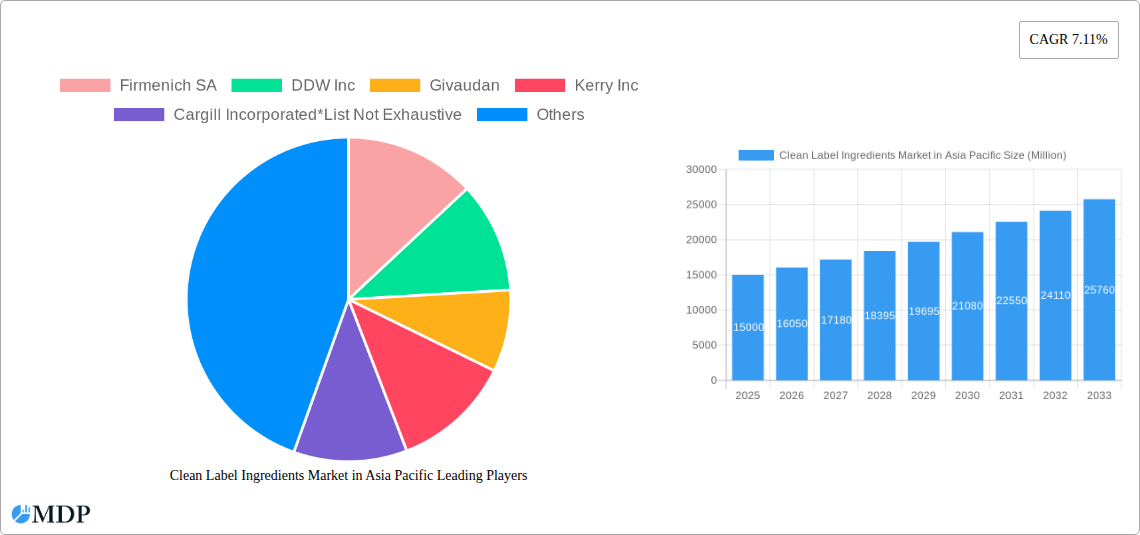
The competitive landscape is dynamic, with both established global players like Firmenich SA, Givaudan, and Kerry Inc., and regional companies vying for market share. These companies are responding to market trends through strategic acquisitions, innovative product development (emphasizing sustainable sourcing and organic certifications), and expansion into new geographical markets within Asia-Pacific. The forecast for the next decade points to a continuation of this upward trend, with specific growth rates likely to vary across segments and countries based on factors such as consumer preferences, regulatory changes, and economic conditions. Continued investment in research and development focused on innovative, sustainable, and cost-effective clean label ingredients will be critical for maintaining competitiveness and capturing market share in this rapidly expanding sector.
This comprehensive report provides an in-depth analysis of the Clean Label Ingredients Market in the Asia Pacific region, covering the period 2019-2033. It offers actionable insights into market dynamics, trends, leading players, and future growth opportunities for stakeholders in the food and beverage industry. With a focus on key segments like colorants, flavors, sweeteners, and preservatives, this report is essential for strategic decision-making. The market size is projected to reach xx Million by 2033, showcasing significant growth potential.
Clean Label Ingredients Market in Asia Pacific Market Dynamics & Concentration
The Asia Pacific Clean Label Ingredients market exhibits a moderately concentrated landscape, with key players such as Firmenich SA, DDW Inc, Givaudan, Kerry Inc, Cargill Incorporated, Chr Hansen Holding A/S, Sensient Technologies Corporation, and Dohler Group holding significant market share. However, the market is witnessing increased competition from smaller, specialized companies focusing on niche clean label ingredients. Market concentration is influenced by factors such as M&A activity, innovation capabilities, and regulatory compliance. The study period (2019-2024) saw approximately xx M&A deals, contributing to market consolidation. The increasing demand for clean label products, driven by rising consumer awareness of health and wellness, is a major innovation driver. Stringent regulatory frameworks regarding food additives and labeling are shaping product development and market entry strategies. Product substitution is observed with the increasing adoption of natural and organic alternatives. Consumer preference shifts towards minimally processed foods with transparent labeling are fueling market growth.
- Market Share: Leading players hold approximately xx% of the market share collectively.
- M&A Activity: An average of xx M&A deals per year were observed during 2019-2024.
- Regulatory Landscape: Stringent regulations regarding labeling and food additives are in place across major APAC countries.
Clean Label Ingredients Market in Asia Pacific Industry Trends & Analysis
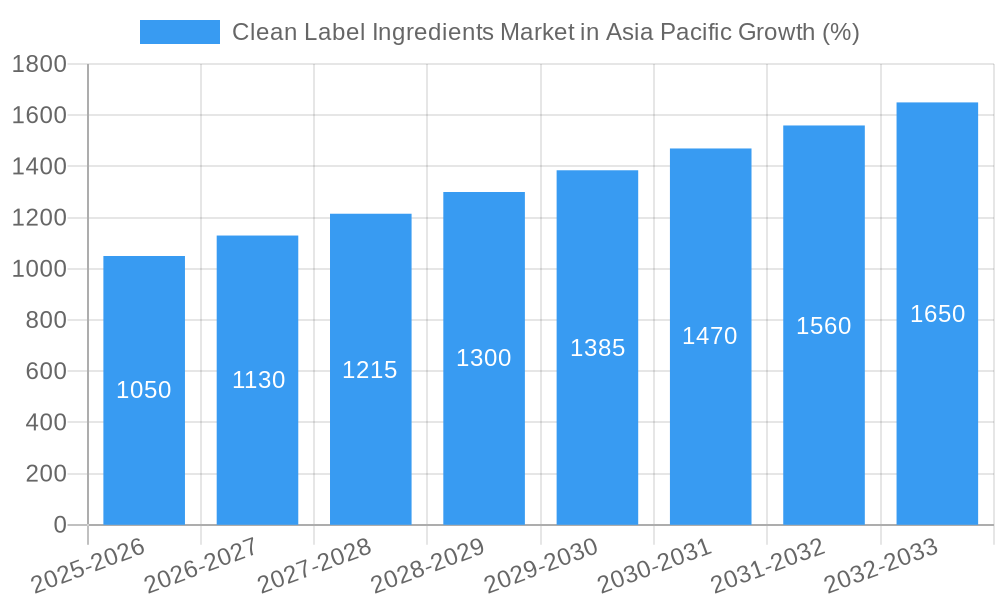
The Asia Pacific Clean Label Ingredients market is experiencing robust growth, driven by several factors. The market registered a CAGR of xx% during the historical period (2019-2024) and is projected to maintain a CAGR of xx% during the forecast period (2025-2033). Technological advancements in ingredient extraction and processing are facilitating the development of novel clean label alternatives. Consumer preferences are shifting towards natural, organic, and non-GMO ingredients, driving market expansion. The rising prevalence of health-conscious consumers and increasing disposable incomes are further fueling demand. Competitive dynamics are characterized by intense competition, with companies focusing on product innovation, brand building, and strategic partnerships to gain a competitive edge. Market penetration of clean label ingredients in the food and beverage sector is steadily increasing, reaching approximately xx% in 2024.
Leading Markets & Segments in Clean Label Ingredients Market in Asia Pacific
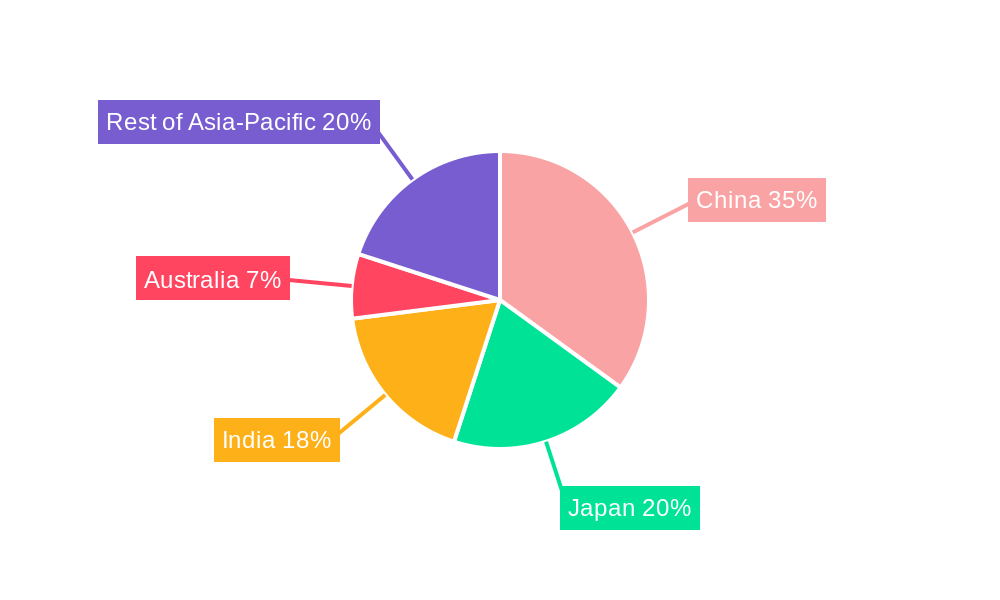
China dominates the Asia Pacific Clean Label Ingredients market, followed by Japan and India. The high population, growing middle class, and increasing demand for processed foods contribute to China's dominance. Within segments, Flavors and Flavor Enhancers hold the largest market share, followed by Food Sweeteners and Colorants. The Beverage application segment shows the highest growth potential due to the rising consumption of functional beverages.
By Country:
- China: Strong economic growth, expanding middle class, and increasing demand for processed foods.
- Japan: High consumer awareness of health and wellness, preference for natural ingredients.
- India: Growing population, rising disposable incomes, and increasing consumption of packaged foods.
- Australia: High adoption of clean label products, stringent regulations.
By Ingredient Type:
- Flavors & Flavor Enhancers: Driven by consumer demand for better tasting, natural products.
- Food Sweeteners: Growing interest in natural and low-calorie sweeteners.
- Colorants: Demand for natural and plant-based colorants is increasing.
By Application:
- Beverage: Significant growth driven by demand for healthier drinks.
- Bakery & Confectionery: Demand for natural colors and flavors.
Clean Label Ingredients Market in Asia Pacific Product Developments
Significant product innovations are reshaping the clean label ingredients market. Companies are investing heavily in research and development to develop novel ingredients extracted from natural sources, with improved functionality and extended shelf life. These innovations address consumer demand for healthier, more transparent food products. Technological trends such as precision fermentation and enzyme technology are crucial in developing clean label alternatives to traditional ingredients. The successful market fit of these innovations is determined by factors such as cost-effectiveness, consumer acceptance, and regulatory compliance.
Key Drivers of Clean Label Ingredients Market in Asia Pacific Growth
The Asia Pacific clean label ingredients market is propelled by several key factors. Rising consumer awareness of health and wellness is a primary driver, leading to increased demand for natural and organic ingredients. Stringent government regulations promoting transparency in food labeling are also contributing to market growth. Technological advancements in extraction and processing techniques enable the development of cost-effective and high-quality clean label ingredients. Furthermore, the expansion of the food processing industry and increasing disposable incomes in many APAC countries are contributing to market expansion.
Challenges in the Clean Label Ingredients Market in Asia Pacific Market
The market faces several challenges. The high cost of production of clean label ingredients compared to conventional alternatives can hinder market penetration. Supply chain complexities and inconsistent quality of raw materials can create production challenges. Moreover, the regulatory landscape varies across different countries in the region, leading to compliance complexities. Intense competition among existing players also poses a significant challenge. These factors can impact the overall growth trajectory. For example, the cost difference between conventional and clean-label sweeteners may reduce market penetration by xx% in certain segments.
Emerging Opportunities in Clean Label Ingredients Market in Asia Pacific
Significant opportunities exist for market expansion. The growing demand for clean label products in emerging economies presents a substantial opportunity. Technological breakthroughs in ingredient production and processing can lead to cost reduction and improve efficiency. Strategic partnerships between ingredient suppliers and food manufacturers can facilitate product innovation and market penetration. Further expansion into niche segments such as vegan and allergen-free products offers lucrative growth potential.
Leading Players in the Clean Label Ingredients Market in Asia Pacific Sector
- Firmenich SA
- DDW Inc
- Givaudan
- Kerry Inc
- Cargill Incorporated
- Chr Hansen Holding A/S
- Sensient Technologies Corporation
- Dohler Group
Key Milestones in Clean Label Ingredients Market in Asia Pacific Industry
- 2020: Increased regulatory scrutiny on food labeling in several APAC countries.
- 2021: Launch of several innovative clean label products by major players.
- 2022: Significant investments in R&D by key players focusing on natural and sustainable ingredients.
- 2023: Several mergers and acquisitions reshaping market dynamics.
- 2024: Growing consumer preference for plant-based and vegan clean-label ingredients.
Strategic Outlook for Clean Label Ingredients Market in Asia Pacific Market
The Asia Pacific Clean Label Ingredients market holds significant potential for long-term growth. Continued investment in R&D, strategic partnerships, and expansion into new markets are key growth accelerators. Focus on sustainable and ethical sourcing of raw materials will further enhance market attractiveness. The increasing consumer demand for transparency and health will drive long-term growth. Companies strategically positioned to meet these evolving demands are poised to capture significant market share.
Clean Label Ingredients Market in Asia Pacific Segmentation
-
1. Ingredient Type
- 1.1. Colorants
- 1.2. Flavors and Flavor Enchancers
- 1.3. Food Sweeteners
- 1.4. Preservatives
- 1.5. Other Ingredient Types
-
2. Application
- 2.1. Beverage
- 2.2. Bakery and Confectionary
- 2.3. Sauce and Condiment
- 2.4. Dairy and Frozen Dessert
- 2.5. Other Applications
Clean Label Ingredients Market in Asia Pacific Segmentation By Geography
-
1. North America
- 1.1. United States
- 1.2. Canada
- 1.3. Mexico
-
2. South America
- 2.1. Brazil
- 2.2. Argentina
- 2.3. Rest of South America
-
3. Europe
- 3.1. United Kingdom
- 3.2. Germany
- 3.3. France
- 3.4. Italy
- 3.5. Spain
- 3.6. Russia
- 3.7. Benelux
- 3.8. Nordics
- 3.9. Rest of Europe
-
4. Middle East & Africa
- 4.1. Turkey
- 4.2. Israel
- 4.3. GCC
- 4.4. North Africa
- 4.5. South Africa
- 4.6. Rest of Middle East & Africa
-
5. Asia Pacific
- 5.1. China
- 5.2. India
- 5.3. Japan
- 5.4. South Korea
- 5.5. ASEAN
- 5.6. Oceania
- 5.7. Rest of Asia Pacific
Clean Label Ingredients Market in Asia Pacific REPORT HIGHLIGHTS
| Aspects | Details |
|---|---|
| Study Period | 2019-2033 |
| Base Year | 2024 |
| Estimated Year | 2025 |
| Forecast Period | 2025-2033 |
| Historical Period | 2019-2024 |
| Growth Rate | CAGR of 7.11% from 2019-2033 |
| Segmentation |
|
Table of Contents
- 1. Introduction
- 1.1. Research Scope
- 1.2. Market Segmentation
- 1.3. Research Methodology
- 1.4. Definitions and Assumptions
- 2. Executive Summary
- 2.1. Introduction
- 3. Market Dynamics
- 3.1. Introduction
- 3.2. Market Drivers
- 3.2.1. Rising Health Consciousness among consumer
- 3.3. Market Restrains
- 3.3.1. High Cost of natural Ingredients
- 3.4. Market Trends
- 3.4.1. Consumer Preference Toward Natural Food Ingredients
- 4. Market Factor Analysis
- 4.1. Porters Five Forces
- 4.2. Supply/Value Chain
- 4.3. PESTEL analysis
- 4.4. Market Entropy
- 4.5. Patent/Trademark Analysis
- 5. Global Clean Label Ingredients Market in Asia Pacific Analysis, Insights and Forecast, 2019-2031
- 5.1. Market Analysis, Insights and Forecast - by Ingredient Type
- 5.1.1. Colorants
- 5.1.2. Flavors and Flavor Enchancers
- 5.1.3. Food Sweeteners
- 5.1.4. Preservatives
- 5.1.5. Other Ingredient Types
- 5.2. Market Analysis, Insights and Forecast - by Application
- 5.2.1. Beverage
- 5.2.2. Bakery and Confectionary
- 5.2.3. Sauce and Condiment
- 5.2.4. Dairy and Frozen Dessert
- 5.2.5. Other Applications
- 5.3. Market Analysis, Insights and Forecast - by Region
- 5.3.1. North America
- 5.3.2. South America
- 5.3.3. Europe
- 5.3.4. Middle East & Africa
- 5.3.5. Asia Pacific
- 5.1. Market Analysis, Insights and Forecast - by Ingredient Type
- 6. North America Clean Label Ingredients Market in Asia Pacific Analysis, Insights and Forecast, 2019-2031
- 6.1. Market Analysis, Insights and Forecast - by Ingredient Type
- 6.1.1. Colorants
- 6.1.2. Flavors and Flavor Enchancers
- 6.1.3. Food Sweeteners
- 6.1.4. Preservatives
- 6.1.5. Other Ingredient Types
- 6.2. Market Analysis, Insights and Forecast - by Application
- 6.2.1. Beverage
- 6.2.2. Bakery and Confectionary
- 6.2.3. Sauce and Condiment
- 6.2.4. Dairy and Frozen Dessert
- 6.2.5. Other Applications
- 6.1. Market Analysis, Insights and Forecast - by Ingredient Type
- 7. South America Clean Label Ingredients Market in Asia Pacific Analysis, Insights and Forecast, 2019-2031
- 7.1. Market Analysis, Insights and Forecast - by Ingredient Type
- 7.1.1. Colorants
- 7.1.2. Flavors and Flavor Enchancers
- 7.1.3. Food Sweeteners
- 7.1.4. Preservatives
- 7.1.5. Other Ingredient Types
- 7.2. Market Analysis, Insights and Forecast - by Application
- 7.2.1. Beverage
- 7.2.2. Bakery and Confectionary
- 7.2.3. Sauce and Condiment
- 7.2.4. Dairy and Frozen Dessert
- 7.2.5. Other Applications
- 7.1. Market Analysis, Insights and Forecast - by Ingredient Type
- 8. Europe Clean Label Ingredients Market in Asia Pacific Analysis, Insights and Forecast, 2019-2031
- 8.1. Market Analysis, Insights and Forecast - by Ingredient Type
- 8.1.1. Colorants
- 8.1.2. Flavors and Flavor Enchancers
- 8.1.3. Food Sweeteners
- 8.1.4. Preservatives
- 8.1.5. Other Ingredient Types
- 8.2. Market Analysis, Insights and Forecast - by Application
- 8.2.1. Beverage
- 8.2.2. Bakery and Confectionary
- 8.2.3. Sauce and Condiment
- 8.2.4. Dairy and Frozen Dessert
- 8.2.5. Other Applications
- 8.1. Market Analysis, Insights and Forecast - by Ingredient Type
- 9. Middle East & Africa Clean Label Ingredients Market in Asia Pacific Analysis, Insights and Forecast, 2019-2031
- 9.1. Market Analysis, Insights and Forecast - by Ingredient Type
- 9.1.1. Colorants
- 9.1.2. Flavors and Flavor Enchancers
- 9.1.3. Food Sweeteners
- 9.1.4. Preservatives
- 9.1.5. Other Ingredient Types
- 9.2. Market Analysis, Insights and Forecast - by Application
- 9.2.1. Beverage
- 9.2.2. Bakery and Confectionary
- 9.2.3. Sauce and Condiment
- 9.2.4. Dairy and Frozen Dessert
- 9.2.5. Other Applications
- 9.1. Market Analysis, Insights and Forecast - by Ingredient Type
- 10. Asia Pacific Clean Label Ingredients Market in Asia Pacific Analysis, Insights and Forecast, 2019-2031
- 10.1. Market Analysis, Insights and Forecast - by Ingredient Type
- 10.1.1. Colorants
- 10.1.2. Flavors and Flavor Enchancers
- 10.1.3. Food Sweeteners
- 10.1.4. Preservatives
- 10.1.5. Other Ingredient Types
- 10.2. Market Analysis, Insights and Forecast - by Application
- 10.2.1. Beverage
- 10.2.2. Bakery and Confectionary
- 10.2.3. Sauce and Condiment
- 10.2.4. Dairy and Frozen Dessert
- 10.2.5. Other Applications
- 10.1. Market Analysis, Insights and Forecast - by Ingredient Type
- 11. China Clean Label Ingredients Market in Asia Pacific Analysis, Insights and Forecast, 2019-2031
- 12. Japan Clean Label Ingredients Market in Asia Pacific Analysis, Insights and Forecast, 2019-2031
- 13. India Clean Label Ingredients Market in Asia Pacific Analysis, Insights and Forecast, 2019-2031
- 14. South Korea Clean Label Ingredients Market in Asia Pacific Analysis, Insights and Forecast, 2019-2031
- 15. Taiwan Clean Label Ingredients Market in Asia Pacific Analysis, Insights and Forecast, 2019-2031
- 16. Australia Clean Label Ingredients Market in Asia Pacific Analysis, Insights and Forecast, 2019-2031
- 17. Rest of Asia-Pacific Clean Label Ingredients Market in Asia Pacific Analysis, Insights and Forecast, 2019-2031
- 18. Competitive Analysis
- 18.1. Global Market Share Analysis 2024
- 18.2. Company Profiles
- 18.2.1 Firmenich SA
- 18.2.1.1. Overview
- 18.2.1.2. Products
- 18.2.1.3. SWOT Analysis
- 18.2.1.4. Recent Developments
- 18.2.1.5. Financials (Based on Availability)
- 18.2.2 DDW Inc
- 18.2.2.1. Overview
- 18.2.2.2. Products
- 18.2.2.3. SWOT Analysis
- 18.2.2.4. Recent Developments
- 18.2.2.5. Financials (Based on Availability)
- 18.2.3 Givaudan
- 18.2.3.1. Overview
- 18.2.3.2. Products
- 18.2.3.3. SWOT Analysis
- 18.2.3.4. Recent Developments
- 18.2.3.5. Financials (Based on Availability)
- 18.2.4 Kerry Inc
- 18.2.4.1. Overview
- 18.2.4.2. Products
- 18.2.4.3. SWOT Analysis
- 18.2.4.4. Recent Developments
- 18.2.4.5. Financials (Based on Availability)
- 18.2.5 Cargill Incorporated*List Not Exhaustive
- 18.2.5.1. Overview
- 18.2.5.2. Products
- 18.2.5.3. SWOT Analysis
- 18.2.5.4. Recent Developments
- 18.2.5.5. Financials (Based on Availability)
- 18.2.6 Chr Hansen Holding A/S
- 18.2.6.1. Overview
- 18.2.6.2. Products
- 18.2.6.3. SWOT Analysis
- 18.2.6.4. Recent Developments
- 18.2.6.5. Financials (Based on Availability)
- 18.2.7 Sensient Technologies Corporation
- 18.2.7.1. Overview
- 18.2.7.2. Products
- 18.2.7.3. SWOT Analysis
- 18.2.7.4. Recent Developments
- 18.2.7.5. Financials (Based on Availability)
- 18.2.8 DohlerGroup
- 18.2.8.1. Overview
- 18.2.8.2. Products
- 18.2.8.3. SWOT Analysis
- 18.2.8.4. Recent Developments
- 18.2.8.5. Financials (Based on Availability)
- 18.2.1 Firmenich SA
List of Figures
- Figure 1: Global Clean Label Ingredients Market in Asia Pacific Revenue Breakdown (Million, %) by Region 2024 & 2032
- Figure 2: Asia Pacific Clean Label Ingredients Market in Asia Pacific Revenue (Million), by Country 2024 & 2032
- Figure 3: Asia Pacific Clean Label Ingredients Market in Asia Pacific Revenue Share (%), by Country 2024 & 2032
- Figure 4: North America Clean Label Ingredients Market in Asia Pacific Revenue (Million), by Ingredient Type 2024 & 2032
- Figure 5: North America Clean Label Ingredients Market in Asia Pacific Revenue Share (%), by Ingredient Type 2024 & 2032
- Figure 6: North America Clean Label Ingredients Market in Asia Pacific Revenue (Million), by Application 2024 & 2032
- Figure 7: North America Clean Label Ingredients Market in Asia Pacific Revenue Share (%), by Application 2024 & 2032
- Figure 8: North America Clean Label Ingredients Market in Asia Pacific Revenue (Million), by Country 2024 & 2032
- Figure 9: North America Clean Label Ingredients Market in Asia Pacific Revenue Share (%), by Country 2024 & 2032
- Figure 10: South America Clean Label Ingredients Market in Asia Pacific Revenue (Million), by Ingredient Type 2024 & 2032
- Figure 11: South America Clean Label Ingredients Market in Asia Pacific Revenue Share (%), by Ingredient Type 2024 & 2032
- Figure 12: South America Clean Label Ingredients Market in Asia Pacific Revenue (Million), by Application 2024 & 2032
- Figure 13: South America Clean Label Ingredients Market in Asia Pacific Revenue Share (%), by Application 2024 & 2032
- Figure 14: South America Clean Label Ingredients Market in Asia Pacific Revenue (Million), by Country 2024 & 2032
- Figure 15: South America Clean Label Ingredients Market in Asia Pacific Revenue Share (%), by Country 2024 & 2032
- Figure 16: Europe Clean Label Ingredients Market in Asia Pacific Revenue (Million), by Ingredient Type 2024 & 2032
- Figure 17: Europe Clean Label Ingredients Market in Asia Pacific Revenue Share (%), by Ingredient Type 2024 & 2032
- Figure 18: Europe Clean Label Ingredients Market in Asia Pacific Revenue (Million), by Application 2024 & 2032
- Figure 19: Europe Clean Label Ingredients Market in Asia Pacific Revenue Share (%), by Application 2024 & 2032
- Figure 20: Europe Clean Label Ingredients Market in Asia Pacific Revenue (Million), by Country 2024 & 2032
- Figure 21: Europe Clean Label Ingredients Market in Asia Pacific Revenue Share (%), by Country 2024 & 2032
- Figure 22: Middle East & Africa Clean Label Ingredients Market in Asia Pacific Revenue (Million), by Ingredient Type 2024 & 2032
- Figure 23: Middle East & Africa Clean Label Ingredients Market in Asia Pacific Revenue Share (%), by Ingredient Type 2024 & 2032
- Figure 24: Middle East & Africa Clean Label Ingredients Market in Asia Pacific Revenue (Million), by Application 2024 & 2032
- Figure 25: Middle East & Africa Clean Label Ingredients Market in Asia Pacific Revenue Share (%), by Application 2024 & 2032
- Figure 26: Middle East & Africa Clean Label Ingredients Market in Asia Pacific Revenue (Million), by Country 2024 & 2032
- Figure 27: Middle East & Africa Clean Label Ingredients Market in Asia Pacific Revenue Share (%), by Country 2024 & 2032
- Figure 28: Asia Pacific Clean Label Ingredients Market in Asia Pacific Revenue (Million), by Ingredient Type 2024 & 2032
- Figure 29: Asia Pacific Clean Label Ingredients Market in Asia Pacific Revenue Share (%), by Ingredient Type 2024 & 2032
- Figure 30: Asia Pacific Clean Label Ingredients Market in Asia Pacific Revenue (Million), by Application 2024 & 2032
- Figure 31: Asia Pacific Clean Label Ingredients Market in Asia Pacific Revenue Share (%), by Application 2024 & 2032
- Figure 32: Asia Pacific Clean Label Ingredients Market in Asia Pacific Revenue (Million), by Country 2024 & 2032
- Figure 33: Asia Pacific Clean Label Ingredients Market in Asia Pacific Revenue Share (%), by Country 2024 & 2032
List of Tables
- Table 1: Global Clean Label Ingredients Market in Asia Pacific Revenue Million Forecast, by Region 2019 & 2032
- Table 2: Global Clean Label Ingredients Market in Asia Pacific Revenue Million Forecast, by Ingredient Type 2019 & 2032
- Table 3: Global Clean Label Ingredients Market in Asia Pacific Revenue Million Forecast, by Application 2019 & 2032
- Table 4: Global Clean Label Ingredients Market in Asia Pacific Revenue Million Forecast, by Region 2019 & 2032
- Table 5: Global Clean Label Ingredients Market in Asia Pacific Revenue Million Forecast, by Country 2019 & 2032
- Table 6: China Clean Label Ingredients Market in Asia Pacific Revenue (Million) Forecast, by Application 2019 & 2032
- Table 7: Japan Clean Label Ingredients Market in Asia Pacific Revenue (Million) Forecast, by Application 2019 & 2032
- Table 8: India Clean Label Ingredients Market in Asia Pacific Revenue (Million) Forecast, by Application 2019 & 2032
- Table 9: South Korea Clean Label Ingredients Market in Asia Pacific Revenue (Million) Forecast, by Application 2019 & 2032
- Table 10: Taiwan Clean Label Ingredients Market in Asia Pacific Revenue (Million) Forecast, by Application 2019 & 2032
- Table 11: Australia Clean Label Ingredients Market in Asia Pacific Revenue (Million) Forecast, by Application 2019 & 2032
- Table 12: Rest of Asia-Pacific Clean Label Ingredients Market in Asia Pacific Revenue (Million) Forecast, by Application 2019 & 2032
- Table 13: Global Clean Label Ingredients Market in Asia Pacific Revenue Million Forecast, by Ingredient Type 2019 & 2032
- Table 14: Global Clean Label Ingredients Market in Asia Pacific Revenue Million Forecast, by Application 2019 & 2032
- Table 15: Global Clean Label Ingredients Market in Asia Pacific Revenue Million Forecast, by Country 2019 & 2032
- Table 16: United States Clean Label Ingredients Market in Asia Pacific Revenue (Million) Forecast, by Application 2019 & 2032
- Table 17: Canada Clean Label Ingredients Market in Asia Pacific Revenue (Million) Forecast, by Application 2019 & 2032
- Table 18: Mexico Clean Label Ingredients Market in Asia Pacific Revenue (Million) Forecast, by Application 2019 & 2032
- Table 19: Global Clean Label Ingredients Market in Asia Pacific Revenue Million Forecast, by Ingredient Type 2019 & 2032
- Table 20: Global Clean Label Ingredients Market in Asia Pacific Revenue Million Forecast, by Application 2019 & 2032
- Table 21: Global Clean Label Ingredients Market in Asia Pacific Revenue Million Forecast, by Country 2019 & 2032
- Table 22: Brazil Clean Label Ingredients Market in Asia Pacific Revenue (Million) Forecast, by Application 2019 & 2032
- Table 23: Argentina Clean Label Ingredients Market in Asia Pacific Revenue (Million) Forecast, by Application 2019 & 2032
- Table 24: Rest of South America Clean Label Ingredients Market in Asia Pacific Revenue (Million) Forecast, by Application 2019 & 2032
- Table 25: Global Clean Label Ingredients Market in Asia Pacific Revenue Million Forecast, by Ingredient Type 2019 & 2032
- Table 26: Global Clean Label Ingredients Market in Asia Pacific Revenue Million Forecast, by Application 2019 & 2032
- Table 27: Global Clean Label Ingredients Market in Asia Pacific Revenue Million Forecast, by Country 2019 & 2032
- Table 28: United Kingdom Clean Label Ingredients Market in Asia Pacific Revenue (Million) Forecast, by Application 2019 & 2032
- Table 29: Germany Clean Label Ingredients Market in Asia Pacific Revenue (Million) Forecast, by Application 2019 & 2032
- Table 30: France Clean Label Ingredients Market in Asia Pacific Revenue (Million) Forecast, by Application 2019 & 2032
- Table 31: Italy Clean Label Ingredients Market in Asia Pacific Revenue (Million) Forecast, by Application 2019 & 2032
- Table 32: Spain Clean Label Ingredients Market in Asia Pacific Revenue (Million) Forecast, by Application 2019 & 2032
- Table 33: Russia Clean Label Ingredients Market in Asia Pacific Revenue (Million) Forecast, by Application 2019 & 2032
- Table 34: Benelux Clean Label Ingredients Market in Asia Pacific Revenue (Million) Forecast, by Application 2019 & 2032
- Table 35: Nordics Clean Label Ingredients Market in Asia Pacific Revenue (Million) Forecast, by Application 2019 & 2032
- Table 36: Rest of Europe Clean Label Ingredients Market in Asia Pacific Revenue (Million) Forecast, by Application 2019 & 2032
- Table 37: Global Clean Label Ingredients Market in Asia Pacific Revenue Million Forecast, by Ingredient Type 2019 & 2032
- Table 38: Global Clean Label Ingredients Market in Asia Pacific Revenue Million Forecast, by Application 2019 & 2032
- Table 39: Global Clean Label Ingredients Market in Asia Pacific Revenue Million Forecast, by Country 2019 & 2032
- Table 40: Turkey Clean Label Ingredients Market in Asia Pacific Revenue (Million) Forecast, by Application 2019 & 2032
- Table 41: Israel Clean Label Ingredients Market in Asia Pacific Revenue (Million) Forecast, by Application 2019 & 2032
- Table 42: GCC Clean Label Ingredients Market in Asia Pacific Revenue (Million) Forecast, by Application 2019 & 2032
- Table 43: North Africa Clean Label Ingredients Market in Asia Pacific Revenue (Million) Forecast, by Application 2019 & 2032
- Table 44: South Africa Clean Label Ingredients Market in Asia Pacific Revenue (Million) Forecast, by Application 2019 & 2032
- Table 45: Rest of Middle East & Africa Clean Label Ingredients Market in Asia Pacific Revenue (Million) Forecast, by Application 2019 & 2032
- Table 46: Global Clean Label Ingredients Market in Asia Pacific Revenue Million Forecast, by Ingredient Type 2019 & 2032
- Table 47: Global Clean Label Ingredients Market in Asia Pacific Revenue Million Forecast, by Application 2019 & 2032
- Table 48: Global Clean Label Ingredients Market in Asia Pacific Revenue Million Forecast, by Country 2019 & 2032
- Table 49: China Clean Label Ingredients Market in Asia Pacific Revenue (Million) Forecast, by Application 2019 & 2032
- Table 50: India Clean Label Ingredients Market in Asia Pacific Revenue (Million) Forecast, by Application 2019 & 2032
- Table 51: Japan Clean Label Ingredients Market in Asia Pacific Revenue (Million) Forecast, by Application 2019 & 2032
- Table 52: South Korea Clean Label Ingredients Market in Asia Pacific Revenue (Million) Forecast, by Application 2019 & 2032
- Table 53: ASEAN Clean Label Ingredients Market in Asia Pacific Revenue (Million) Forecast, by Application 2019 & 2032
- Table 54: Oceania Clean Label Ingredients Market in Asia Pacific Revenue (Million) Forecast, by Application 2019 & 2032
- Table 55: Rest of Asia Pacific Clean Label Ingredients Market in Asia Pacific Revenue (Million) Forecast, by Application 2019 & 2032
Frequently Asked Questions
1. What is the projected Compound Annual Growth Rate (CAGR) of the Clean Label Ingredients Market in Asia Pacific?
The projected CAGR is approximately 7.11%.
2. Which companies are prominent players in the Clean Label Ingredients Market in Asia Pacific?
Key companies in the market include Firmenich SA, DDW Inc, Givaudan, Kerry Inc, Cargill Incorporated*List Not Exhaustive, Chr Hansen Holding A/S, Sensient Technologies Corporation, DohlerGroup.
3. What are the main segments of the Clean Label Ingredients Market in Asia Pacific?
The market segments include Ingredient Type, Application.
4. Can you provide details about the market size?
The market size is estimated to be USD XX Million as of 2022.
5. What are some drivers contributing to market growth?
Rising Health Consciousness among consumer.
6. What are the notable trends driving market growth?
Consumer Preference Toward Natural Food Ingredients.
7. Are there any restraints impacting market growth?
High Cost of natural Ingredients.
8. Can you provide examples of recent developments in the market?
N/A
9. What pricing options are available for accessing the report?
Pricing options include single-user, multi-user, and enterprise licenses priced at USD 4750, USD 5250, and USD 8750 respectively.
10. Is the market size provided in terms of value or volume?
The market size is provided in terms of value, measured in Million.
11. Are there any specific market keywords associated with the report?
Yes, the market keyword associated with the report is "Clean Label Ingredients Market in Asia Pacific," which aids in identifying and referencing the specific market segment covered.
12. How do I determine which pricing option suits my needs best?
The pricing options vary based on user requirements and access needs. Individual users may opt for single-user licenses, while businesses requiring broader access may choose multi-user or enterprise licenses for cost-effective access to the report.
13. Are there any additional resources or data provided in the Clean Label Ingredients Market in Asia Pacific report?
While the report offers comprehensive insights, it's advisable to review the specific contents or supplementary materials provided to ascertain if additional resources or data are available.
14. How can I stay updated on further developments or reports in the Clean Label Ingredients Market in Asia Pacific?
To stay informed about further developments, trends, and reports in the Clean Label Ingredients Market in Asia Pacific, consider subscribing to industry newsletters, following relevant companies and organizations, or regularly checking reputable industry news sources and publications.
Methodology
Step 1 - Identification of Relevant Samples Size from Population Database


Step 2 - Approaches for Defining Global Market Size (Value, Volume* & Price*)

Note*: In applicable scenarios
Step 3 - Data Sources
Primary Research
- Web Analytics
- Survey Reports
- Research Institute
- Latest Research Reports
- Opinion Leaders
Secondary Research
- Annual Reports
- White Paper
- Latest Press Release
- Industry Association
- Paid Database
- Investor Presentations

Step 4 - Data Triangulation
Involves using different sources of information in order to increase the validity of a study
These sources are likely to be stakeholders in a program - participants, other researchers, program staff, other community members, and so on.
Then we put all data in single framework & apply various statistical tools to find out the dynamic on the market.
During the analysis stage, feedback from the stakeholder groups would be compared to determine areas of agreement as well as areas of divergence
