

Key Insights
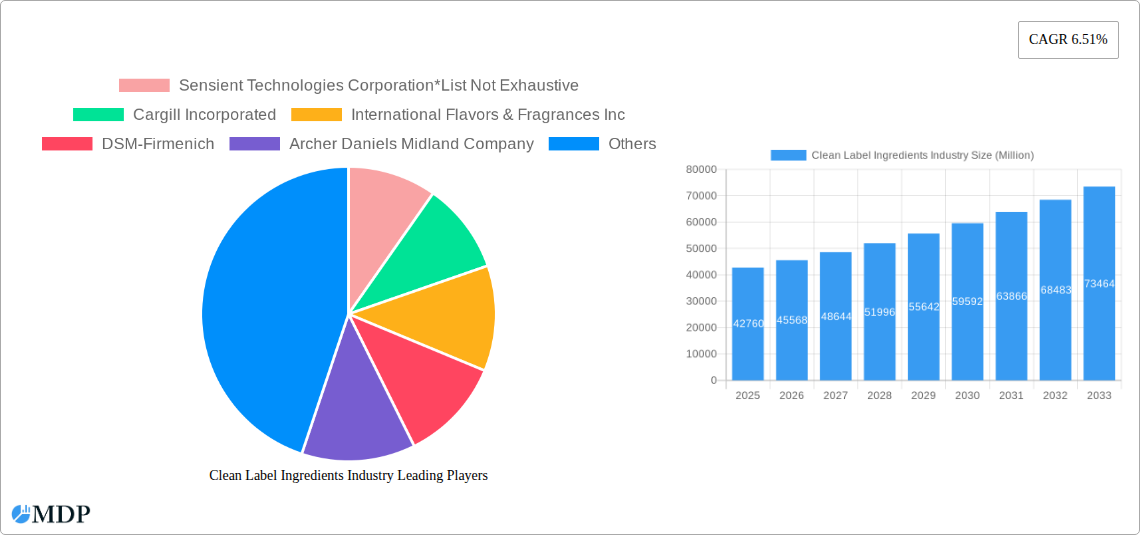
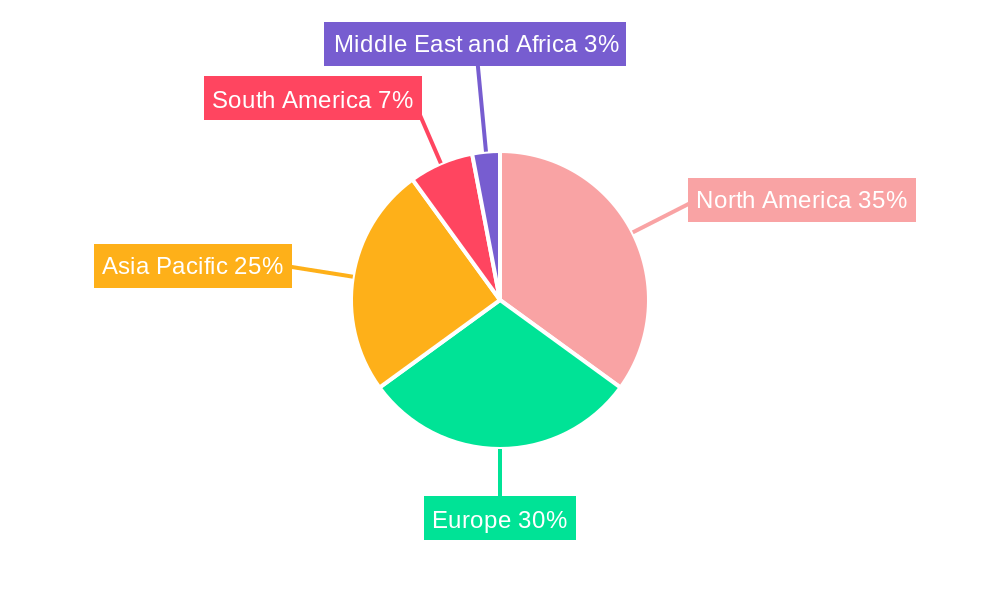
The global clean label ingredients market, valued at $42.76 billion in 2025, is projected to experience robust growth, driven by increasing consumer demand for natural, minimally processed foods. This preference for transparency and healthier options is fueling the adoption of clean label ingredients across various food and beverage categories. Key drivers include heightened awareness of artificial additives and their potential health implications, coupled with a growing preference for products with recognizable and easily understood ingredient lists. The market is segmented by product type (food preservatives, sweeteners, colorants, hydrocolloids, flavors & enhancers, and others) and application (bakery, dairy, beverages, meat, sauces, and others). North America and Europe currently hold significant market share, but the Asia-Pacific region is anticipated to witness substantial growth due to rising disposable incomes and changing dietary habits. While the market faces constraints such as higher production costs associated with clean label ingredients compared to conventional alternatives, the long-term outlook remains positive, driven by sustained consumer interest in clean label products and the ongoing innovation within the food industry to meet this demand. Companies like Sensient Technologies, Cargill, and International Flavors & Fragrances are leading players, continuously investing in research and development to provide innovative and effective clean label solutions. The competitive landscape is characterized by both large multinational corporations and smaller specialized companies, contributing to a diverse range of product offerings.
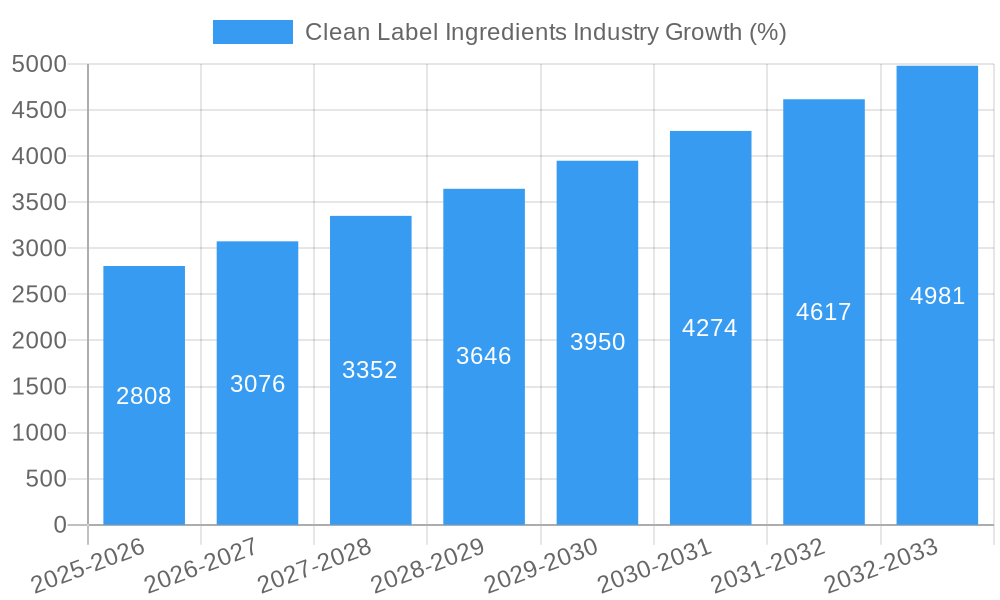
The forecast period of 2025-2033 promises continued expansion, with a Compound Annual Growth Rate (CAGR) of 6.51%. This growth will be fueled by ongoing consumer education regarding the benefits of clean label ingredients, coupled with the proactive efforts of food manufacturers to meet these evolving consumer expectations. This necessitates the development of innovative and cost-effective clean label solutions, driving further advancements within the industry. The segment of food preservatives and sweeteners is likely to demonstrate particularly strong growth given their importance in maintaining product quality and palatability while adhering to clean label standards. Regional variations in growth will reflect the pace of economic development and shifts in consumer preferences across different geographical markets, with developing economies presenting significant growth potential in the coming years.
Clean Label Ingredients Industry Market Report: 2019-2033
This comprehensive report provides an in-depth analysis of the Clean Label Ingredients market, projecting a dynamic period of growth from 2019 to 2033. The report covers market size, segmentation, leading players, key trends, and future outlook, providing actionable insights for industry stakeholders. With a focus on key segments like food preservatives, sweeteners, and colorants, and applications across bakery, dairy, and beverage industries, this report is a crucial resource for strategic decision-making. The study period encompasses 2019-2033, with 2025 serving as both the base and estimated year.
Clean Label Ingredients Industry Market Dynamics & Concentration
The global clean label ingredients market exhibits a moderately concentrated landscape, with several major players holding significant market share. The market's growth is driven by increasing consumer demand for natural, minimally processed foods, stringent regulations on artificial additives, and a surge in health-conscious consumption patterns. Innovation in clean label alternatives is a major driver, while regulatory changes and the emergence of substitute ingredients impact market dynamics. Mergers and acquisitions (M&A) play a significant role in market consolidation, with an estimated xx number of deals recorded between 2019 and 2024. Key players like Cargill and ADM are actively engaged in strategic partnerships and acquisitions to expand their product portfolios and market reach. Market share analysis reveals that the top 5 players collectively control approximately xx% of the global market, indicating a trend towards consolidation.
- Market Concentration: Moderately concentrated, with top 5 players holding xx% market share.
- Innovation Drivers: Consumer demand for natural ingredients, regulatory pressures, and technological advancements.
- Regulatory Frameworks: Varying regulations across geographies impact ingredient usage and market access.
- Product Substitutes: The rise of natural alternatives poses both opportunities and challenges for existing players.
- M&A Activities: xx M&A deals between 2019 and 2024, driving market consolidation.
- End-user Trends: Growing preference for clean label products across various food and beverage applications.
Clean Label Ingredients Industry Industry Trends & Analysis
The clean label ingredients market is experiencing robust growth, with a projected CAGR of xx% during the forecast period (2025-2033). This expansion is fueled by several key factors. Firstly, the escalating consumer awareness of food ingredients and their impact on health is driving demand for products with transparent and recognizable labels. Secondly, stringent government regulations regarding artificial additives are encouraging manufacturers to reformulate their products using clean label alternatives. Technological advancements in ingredient processing and extraction methods also contribute significantly. Competitive dynamics are characterized by ongoing innovation, strategic partnerships, and product diversification. The market penetration of clean label ingredients in various food segments is steadily increasing, with a projected xx% penetration by 2033 in the bakery and confectionery sector, for example.
Leading Markets & Segments in Clean Label Ingredients Industry
The North American region holds a dominant position in the global clean label ingredients market, driven by robust consumer demand, stringent regulatory frameworks, and a well-established food processing industry. Within product types, Food Flavors and Enhancers command a significant market share due to their versatility and widespread application. The Bakery and Confectionery segment represents a leading application area due to consumer preference for natural flavors and colors in these products.
Key Drivers:
- North America: Strong consumer preference for clean label products, stringent regulations, and advanced food processing infrastructure.
- Europe: Growing health consciousness and increasing demand for organic and natural food products.
- Asia Pacific: Rising disposable incomes and changing dietary habits are driving market growth.
Dominant Segments:
- Product Type: Food Flavors and Enhancers hold the largest market share due to their wide applicability.
- Application: Bakery and Confectionery segment shows high demand for clean label ingredients.
Clean Label Ingredients Industry Product Developments
Recent advancements in clean label ingredients focus on enhancing functionality, improving sensory attributes, and expanding applications. Innovations include the development of natural preservatives, high-intensity sweeteners, and plant-based colorants. Companies are focusing on creating ingredients that not only meet clean label standards but also deliver superior performance in food products, improving texture, shelf life, and overall quality. Technological trends involve the use of precision fermentation, enzymatic processes, and advanced extraction techniques to produce sustainable and high-quality clean label ingredients.
Key Drivers of Clean Label Ingredients Industry Growth
The clean label ingredients market's growth is propelled by a confluence of factors: increasing consumer awareness of artificial ingredients and their potential health consequences fuels demand for cleaner alternatives. Stricter regulations globally are pushing manufacturers toward reformulation. Technological innovations constantly create more viable and effective clean label options. Finally, the rising popularity of plant-based and free-from products further accelerates market expansion.
Challenges in the Clean Label Ingredients Industry Market
Significant challenges persist, including fluctuations in raw material prices that impact ingredient costs, the complexity and cost associated with achieving equivalent functionality compared to conventional ingredients which may affect price competitiveness. Ensuring consistent supply chain reliability and meeting fluctuating demand are further obstacles. Moreover, some clean label ingredients might exhibit shorter shelf lives, impacting product stability and distribution.
Emerging Opportunities in Clean Label Ingredients Industry
Significant long-term growth opportunities exist for innovative clean label ingredient developers. This includes capitalizing on the increasing demand for sustainable and ethically sourced ingredients. Strategic partnerships and collaborations are essential for securing supply chains and expanding market reach. Furthermore, continued technological breakthroughs in ingredient processing and extraction will unlock new possibilities.
Leading Players in the Clean Label Ingredients Industry Sector
- Sensient Technologies Corporation
- Cargill Incorporated
- International Flavors & Fragrances Inc
- DSM-Firmenich
- Archer Daniels Midland Company
- Ajinomoto Co Inc
- Tate & Lyle PLC
- Kerry Group PLC
- Ingredion Incorporated
- Corbion NV
Key Milestones in Clean Label Ingredients Industry Industry
- August 2022: Archer-Daniels-Midland Company announced a strategic partnership with New Culture, focusing on sustainable and animal-free dairy products. This collaboration highlights the shift towards sustainable and innovative clean label ingredients.
- October 2023: International Flavor and Fragrances Inc. launched Methanova, a plant-based methylcellulose, expanding the applications of clean label ingredients into the biotechnology sector. This reflects the broadening scope of clean label ingredient applications.
- February 2024: Ajinomoto Co. opened a new office in Silicon Valley, expanding its clean label ingredient offerings in the US market. This demonstrates strategic market expansion by a key player.
Strategic Outlook for Clean Label Ingredients Industry Market
The clean label ingredients market is poised for significant growth, driven by ongoing consumer preference shifts, regulatory changes, and technological advancements. Companies that successfully innovate, build strong supply chains, and invest in research and development will be best positioned to capitalize on this market expansion. Strategic partnerships and acquisitions will remain key strategies for market consolidation and growth. The future lies in creating sustainable, high-performing, and cost-effective clean label ingredients that meet diverse consumer needs.
Clean Label Ingredients Industry Segmentation
-
1. Product Type
- 1.1. Food Preservatives
- 1.2. Food Sweeteners
- 1.3. Food Colorants
- 1.4. Food Hydrocolloids
- 1.5. Food Flavors and Enhancers
- 1.6. Other Product Types
-
2. Application
- 2.1. Bakery and Confectionery
- 2.2. Dairy and Frozen Desserts
- 2.3. Beverages
- 2.4. Meat and Meat Products
- 2.5. Sauces and Condiments
- 2.6. Other Applications
Clean Label Ingredients Industry Segmentation By Geography
-
1. North America
- 1.1. United States
- 1.2. Canada
- 1.3. Mexico
- 1.4. Rest of North America
-
2. Europe
- 2.1. United Kingdom
- 2.2. Germany
- 2.3. Spain
- 2.4. France
- 2.5. Italy
- 2.6. Russia
- 2.7. Rest of Europe
-
3. Asia Pacific
- 3.1. China
- 3.2. Japan
- 3.3. India
- 3.4. Australia
- 3.5. Rest of Asia Pacific
-
4. South America
- 4.1. Brazil
- 4.2. Argentina
- 4.3. Rest of South America
-
5. Middle East and Africa
- 5.1. South Africa
- 5.2. Saudi Arabia
- 5.3. Rest of Middle East and Africa
Clean Label Ingredients Industry REPORT HIGHLIGHTS
| Aspects | Details |
|---|---|
| Study Period | 2019-2033 |
| Base Year | 2024 |
| Estimated Year | 2025 |
| Forecast Period | 2025-2033 |
| Historical Period | 2019-2024 |
| Growth Rate | CAGR of 6.51% from 2019-2033 |
| Segmentation |
|
Table of Contents
- 1. Introduction
- 1.1. Research Scope
- 1.2. Market Segmentation
- 1.3. Research Methodology
- 1.4. Definitions and Assumptions
- 2. Executive Summary
- 2.1. Introduction
- 3. Market Dynamics
- 3.1. Introduction
- 3.2. Market Drivers
- 3.2.1. Increasing Health and Wellness Trends Fueling Market Growth; Rising Demand for Natural Ingredients
- 3.3. Market Restrains
- 3.3.1. High Cost Hampering Market Growth
- 3.4. Market Trends
- 3.4.1. Increasing Health and Wellness Trends Fueling Market Growth
- 4. Market Factor Analysis
- 4.1. Porters Five Forces
- 4.2. Supply/Value Chain
- 4.3. PESTEL analysis
- 4.4. Market Entropy
- 4.5. Patent/Trademark Analysis
- 5. Global Clean Label Ingredients Industry Analysis, Insights and Forecast, 2019-2031
- 5.1. Market Analysis, Insights and Forecast - by Product Type
- 5.1.1. Food Preservatives
- 5.1.2. Food Sweeteners
- 5.1.3. Food Colorants
- 5.1.4. Food Hydrocolloids
- 5.1.5. Food Flavors and Enhancers
- 5.1.6. Other Product Types
- 5.2. Market Analysis, Insights and Forecast - by Application
- 5.2.1. Bakery and Confectionery
- 5.2.2. Dairy and Frozen Desserts
- 5.2.3. Beverages
- 5.2.4. Meat and Meat Products
- 5.2.5. Sauces and Condiments
- 5.2.6. Other Applications
- 5.3. Market Analysis, Insights and Forecast - by Region
- 5.3.1. North America
- 5.3.2. Europe
- 5.3.3. Asia Pacific
- 5.3.4. South America
- 5.3.5. Middle East and Africa
- 5.1. Market Analysis, Insights and Forecast - by Product Type
- 6. North America Clean Label Ingredients Industry Analysis, Insights and Forecast, 2019-2031
- 6.1. Market Analysis, Insights and Forecast - by Product Type
- 6.1.1. Food Preservatives
- 6.1.2. Food Sweeteners
- 6.1.3. Food Colorants
- 6.1.4. Food Hydrocolloids
- 6.1.5. Food Flavors and Enhancers
- 6.1.6. Other Product Types
- 6.2. Market Analysis, Insights and Forecast - by Application
- 6.2.1. Bakery and Confectionery
- 6.2.2. Dairy and Frozen Desserts
- 6.2.3. Beverages
- 6.2.4. Meat and Meat Products
- 6.2.5. Sauces and Condiments
- 6.2.6. Other Applications
- 6.1. Market Analysis, Insights and Forecast - by Product Type
- 7. Europe Clean Label Ingredients Industry Analysis, Insights and Forecast, 2019-2031
- 7.1. Market Analysis, Insights and Forecast - by Product Type
- 7.1.1. Food Preservatives
- 7.1.2. Food Sweeteners
- 7.1.3. Food Colorants
- 7.1.4. Food Hydrocolloids
- 7.1.5. Food Flavors and Enhancers
- 7.1.6. Other Product Types
- 7.2. Market Analysis, Insights and Forecast - by Application
- 7.2.1. Bakery and Confectionery
- 7.2.2. Dairy and Frozen Desserts
- 7.2.3. Beverages
- 7.2.4. Meat and Meat Products
- 7.2.5. Sauces and Condiments
- 7.2.6. Other Applications
- 7.1. Market Analysis, Insights and Forecast - by Product Type
- 8. Asia Pacific Clean Label Ingredients Industry Analysis, Insights and Forecast, 2019-2031
- 8.1. Market Analysis, Insights and Forecast - by Product Type
- 8.1.1. Food Preservatives
- 8.1.2. Food Sweeteners
- 8.1.3. Food Colorants
- 8.1.4. Food Hydrocolloids
- 8.1.5. Food Flavors and Enhancers
- 8.1.6. Other Product Types
- 8.2. Market Analysis, Insights and Forecast - by Application
- 8.2.1. Bakery and Confectionery
- 8.2.2. Dairy and Frozen Desserts
- 8.2.3. Beverages
- 8.2.4. Meat and Meat Products
- 8.2.5. Sauces and Condiments
- 8.2.6. Other Applications
- 8.1. Market Analysis, Insights and Forecast - by Product Type
- 9. South America Clean Label Ingredients Industry Analysis, Insights and Forecast, 2019-2031
- 9.1. Market Analysis, Insights and Forecast - by Product Type
- 9.1.1. Food Preservatives
- 9.1.2. Food Sweeteners
- 9.1.3. Food Colorants
- 9.1.4. Food Hydrocolloids
- 9.1.5. Food Flavors and Enhancers
- 9.1.6. Other Product Types
- 9.2. Market Analysis, Insights and Forecast - by Application
- 9.2.1. Bakery and Confectionery
- 9.2.2. Dairy and Frozen Desserts
- 9.2.3. Beverages
- 9.2.4. Meat and Meat Products
- 9.2.5. Sauces and Condiments
- 9.2.6. Other Applications
- 9.1. Market Analysis, Insights and Forecast - by Product Type
- 10. Middle East and Africa Clean Label Ingredients Industry Analysis, Insights and Forecast, 2019-2031
- 10.1. Market Analysis, Insights and Forecast - by Product Type
- 10.1.1. Food Preservatives
- 10.1.2. Food Sweeteners
- 10.1.3. Food Colorants
- 10.1.4. Food Hydrocolloids
- 10.1.5. Food Flavors and Enhancers
- 10.1.6. Other Product Types
- 10.2. Market Analysis, Insights and Forecast - by Application
- 10.2.1. Bakery and Confectionery
- 10.2.2. Dairy and Frozen Desserts
- 10.2.3. Beverages
- 10.2.4. Meat and Meat Products
- 10.2.5. Sauces and Condiments
- 10.2.6. Other Applications
- 10.1. Market Analysis, Insights and Forecast - by Product Type
- 11. North America Clean Label Ingredients Industry Analysis, Insights and Forecast, 2019-2031
- 11.1. Market Analysis, Insights and Forecast - By Country/Sub-region
- 11.1.1 United States
- 11.1.2 Canada
- 11.1.3 Mexico
- 11.1.4 Rest of North America
- 12. Europe Clean Label Ingredients Industry Analysis, Insights and Forecast, 2019-2031
- 12.1. Market Analysis, Insights and Forecast - By Country/Sub-region
- 12.1.1 United Kingdom
- 12.1.2 Germany
- 12.1.3 Spain
- 12.1.4 France
- 12.1.5 Italy
- 12.1.6 Russia
- 12.1.7 Rest of Europe
- 13. Asia Pacific Clean Label Ingredients Industry Analysis, Insights and Forecast, 2019-2031
- 13.1. Market Analysis, Insights and Forecast - By Country/Sub-region
- 13.1.1 China
- 13.1.2 Japan
- 13.1.3 India
- 13.1.4 Australia
- 13.1.5 Rest of Asia Pacific
- 14. South America Clean Label Ingredients Industry Analysis, Insights and Forecast, 2019-2031
- 14.1. Market Analysis, Insights and Forecast - By Country/Sub-region
- 14.1.1 Brazil
- 14.1.2 Argentina
- 14.1.3 Rest of South America
- 15. Middle East and Africa Clean Label Ingredients Industry Analysis, Insights and Forecast, 2019-2031
- 15.1. Market Analysis, Insights and Forecast - By Country/Sub-region
- 15.1.1 South Africa
- 15.1.2 Saudi Arabia
- 15.1.3 Rest of Middle East and Africa
- 16. Competitive Analysis
- 16.1. Global Market Share Analysis 2024
- 16.2. Company Profiles
- 16.2.1 Sensient Technologies Corporation*List Not Exhaustive
- 16.2.1.1. Overview
- 16.2.1.2. Products
- 16.2.1.3. SWOT Analysis
- 16.2.1.4. Recent Developments
- 16.2.1.5. Financials (Based on Availability)
- 16.2.2 Cargill Incorporated
- 16.2.2.1. Overview
- 16.2.2.2. Products
- 16.2.2.3. SWOT Analysis
- 16.2.2.4. Recent Developments
- 16.2.2.5. Financials (Based on Availability)
- 16.2.3 International Flavors & Fragrances Inc
- 16.2.3.1. Overview
- 16.2.3.2. Products
- 16.2.3.3. SWOT Analysis
- 16.2.3.4. Recent Developments
- 16.2.3.5. Financials (Based on Availability)
- 16.2.4 DSM-Firmenich
- 16.2.4.1. Overview
- 16.2.4.2. Products
- 16.2.4.3. SWOT Analysis
- 16.2.4.4. Recent Developments
- 16.2.4.5. Financials (Based on Availability)
- 16.2.5 Archer Daniels Midland Company
- 16.2.5.1. Overview
- 16.2.5.2. Products
- 16.2.5.3. SWOT Analysis
- 16.2.5.4. Recent Developments
- 16.2.5.5. Financials (Based on Availability)
- 16.2.6 Ajinomoto Co Inc
- 16.2.6.1. Overview
- 16.2.6.2. Products
- 16.2.6.3. SWOT Analysis
- 16.2.6.4. Recent Developments
- 16.2.6.5. Financials (Based on Availability)
- 16.2.7 Tate & Lyle PLC
- 16.2.7.1. Overview
- 16.2.7.2. Products
- 16.2.7.3. SWOT Analysis
- 16.2.7.4. Recent Developments
- 16.2.7.5. Financials (Based on Availability)
- 16.2.8 Kerry Group PLC
- 16.2.8.1. Overview
- 16.2.8.2. Products
- 16.2.8.3. SWOT Analysis
- 16.2.8.4. Recent Developments
- 16.2.8.5. Financials (Based on Availability)
- 16.2.9 Ingredion Incorporated
- 16.2.9.1. Overview
- 16.2.9.2. Products
- 16.2.9.3. SWOT Analysis
- 16.2.9.4. Recent Developments
- 16.2.9.5. Financials (Based on Availability)
- 16.2.10 Corbion NV
- 16.2.10.1. Overview
- 16.2.10.2. Products
- 16.2.10.3. SWOT Analysis
- 16.2.10.4. Recent Developments
- 16.2.10.5. Financials (Based on Availability)
- 16.2.1 Sensient Technologies Corporation*List Not Exhaustive
List of Figures
- Figure 1: Global Clean Label Ingredients Industry Revenue Breakdown (Million, %) by Region 2024 & 2032
- Figure 2: North America Clean Label Ingredients Industry Revenue (Million), by Country 2024 & 2032
- Figure 3: North America Clean Label Ingredients Industry Revenue Share (%), by Country 2024 & 2032
- Figure 4: Europe Clean Label Ingredients Industry Revenue (Million), by Country 2024 & 2032
- Figure 5: Europe Clean Label Ingredients Industry Revenue Share (%), by Country 2024 & 2032
- Figure 6: Asia Pacific Clean Label Ingredients Industry Revenue (Million), by Country 2024 & 2032
- Figure 7: Asia Pacific Clean Label Ingredients Industry Revenue Share (%), by Country 2024 & 2032
- Figure 8: South America Clean Label Ingredients Industry Revenue (Million), by Country 2024 & 2032
- Figure 9: South America Clean Label Ingredients Industry Revenue Share (%), by Country 2024 & 2032
- Figure 10: Middle East and Africa Clean Label Ingredients Industry Revenue (Million), by Country 2024 & 2032
- Figure 11: Middle East and Africa Clean Label Ingredients Industry Revenue Share (%), by Country 2024 & 2032
- Figure 12: North America Clean Label Ingredients Industry Revenue (Million), by Product Type 2024 & 2032
- Figure 13: North America Clean Label Ingredients Industry Revenue Share (%), by Product Type 2024 & 2032
- Figure 14: North America Clean Label Ingredients Industry Revenue (Million), by Application 2024 & 2032
- Figure 15: North America Clean Label Ingredients Industry Revenue Share (%), by Application 2024 & 2032
- Figure 16: North America Clean Label Ingredients Industry Revenue (Million), by Country 2024 & 2032
- Figure 17: North America Clean Label Ingredients Industry Revenue Share (%), by Country 2024 & 2032
- Figure 18: Europe Clean Label Ingredients Industry Revenue (Million), by Product Type 2024 & 2032
- Figure 19: Europe Clean Label Ingredients Industry Revenue Share (%), by Product Type 2024 & 2032
- Figure 20: Europe Clean Label Ingredients Industry Revenue (Million), by Application 2024 & 2032
- Figure 21: Europe Clean Label Ingredients Industry Revenue Share (%), by Application 2024 & 2032
- Figure 22: Europe Clean Label Ingredients Industry Revenue (Million), by Country 2024 & 2032
- Figure 23: Europe Clean Label Ingredients Industry Revenue Share (%), by Country 2024 & 2032
- Figure 24: Asia Pacific Clean Label Ingredients Industry Revenue (Million), by Product Type 2024 & 2032
- Figure 25: Asia Pacific Clean Label Ingredients Industry Revenue Share (%), by Product Type 2024 & 2032
- Figure 26: Asia Pacific Clean Label Ingredients Industry Revenue (Million), by Application 2024 & 2032
- Figure 27: Asia Pacific Clean Label Ingredients Industry Revenue Share (%), by Application 2024 & 2032
- Figure 28: Asia Pacific Clean Label Ingredients Industry Revenue (Million), by Country 2024 & 2032
- Figure 29: Asia Pacific Clean Label Ingredients Industry Revenue Share (%), by Country 2024 & 2032
- Figure 30: South America Clean Label Ingredients Industry Revenue (Million), by Product Type 2024 & 2032
- Figure 31: South America Clean Label Ingredients Industry Revenue Share (%), by Product Type 2024 & 2032
- Figure 32: South America Clean Label Ingredients Industry Revenue (Million), by Application 2024 & 2032
- Figure 33: South America Clean Label Ingredients Industry Revenue Share (%), by Application 2024 & 2032
- Figure 34: South America Clean Label Ingredients Industry Revenue (Million), by Country 2024 & 2032
- Figure 35: South America Clean Label Ingredients Industry Revenue Share (%), by Country 2024 & 2032
- Figure 36: Middle East and Africa Clean Label Ingredients Industry Revenue (Million), by Product Type 2024 & 2032
- Figure 37: Middle East and Africa Clean Label Ingredients Industry Revenue Share (%), by Product Type 2024 & 2032
- Figure 38: Middle East and Africa Clean Label Ingredients Industry Revenue (Million), by Application 2024 & 2032
- Figure 39: Middle East and Africa Clean Label Ingredients Industry Revenue Share (%), by Application 2024 & 2032
- Figure 40: Middle East and Africa Clean Label Ingredients Industry Revenue (Million), by Country 2024 & 2032
- Figure 41: Middle East and Africa Clean Label Ingredients Industry Revenue Share (%), by Country 2024 & 2032
List of Tables
- Table 1: Global Clean Label Ingredients Industry Revenue Million Forecast, by Region 2019 & 2032
- Table 2: Global Clean Label Ingredients Industry Revenue Million Forecast, by Product Type 2019 & 2032
- Table 3: Global Clean Label Ingredients Industry Revenue Million Forecast, by Application 2019 & 2032
- Table 4: Global Clean Label Ingredients Industry Revenue Million Forecast, by Region 2019 & 2032
- Table 5: Global Clean Label Ingredients Industry Revenue Million Forecast, by Country 2019 & 2032
- Table 6: United States Clean Label Ingredients Industry Revenue (Million) Forecast, by Application 2019 & 2032
- Table 7: Canada Clean Label Ingredients Industry Revenue (Million) Forecast, by Application 2019 & 2032
- Table 8: Mexico Clean Label Ingredients Industry Revenue (Million) Forecast, by Application 2019 & 2032
- Table 9: Rest of North America Clean Label Ingredients Industry Revenue (Million) Forecast, by Application 2019 & 2032
- Table 10: Global Clean Label Ingredients Industry Revenue Million Forecast, by Country 2019 & 2032
- Table 11: United Kingdom Clean Label Ingredients Industry Revenue (Million) Forecast, by Application 2019 & 2032
- Table 12: Germany Clean Label Ingredients Industry Revenue (Million) Forecast, by Application 2019 & 2032
- Table 13: Spain Clean Label Ingredients Industry Revenue (Million) Forecast, by Application 2019 & 2032
- Table 14: France Clean Label Ingredients Industry Revenue (Million) Forecast, by Application 2019 & 2032
- Table 15: Italy Clean Label Ingredients Industry Revenue (Million) Forecast, by Application 2019 & 2032
- Table 16: Russia Clean Label Ingredients Industry Revenue (Million) Forecast, by Application 2019 & 2032
- Table 17: Rest of Europe Clean Label Ingredients Industry Revenue (Million) Forecast, by Application 2019 & 2032
- Table 18: Global Clean Label Ingredients Industry Revenue Million Forecast, by Country 2019 & 2032
- Table 19: China Clean Label Ingredients Industry Revenue (Million) Forecast, by Application 2019 & 2032
- Table 20: Japan Clean Label Ingredients Industry Revenue (Million) Forecast, by Application 2019 & 2032
- Table 21: India Clean Label Ingredients Industry Revenue (Million) Forecast, by Application 2019 & 2032
- Table 22: Australia Clean Label Ingredients Industry Revenue (Million) Forecast, by Application 2019 & 2032
- Table 23: Rest of Asia Pacific Clean Label Ingredients Industry Revenue (Million) Forecast, by Application 2019 & 2032
- Table 24: Global Clean Label Ingredients Industry Revenue Million Forecast, by Country 2019 & 2032
- Table 25: Brazil Clean Label Ingredients Industry Revenue (Million) Forecast, by Application 2019 & 2032
- Table 26: Argentina Clean Label Ingredients Industry Revenue (Million) Forecast, by Application 2019 & 2032
- Table 27: Rest of South America Clean Label Ingredients Industry Revenue (Million) Forecast, by Application 2019 & 2032
- Table 28: Global Clean Label Ingredients Industry Revenue Million Forecast, by Country 2019 & 2032
- Table 29: South Africa Clean Label Ingredients Industry Revenue (Million) Forecast, by Application 2019 & 2032
- Table 30: Saudi Arabia Clean Label Ingredients Industry Revenue (Million) Forecast, by Application 2019 & 2032
- Table 31: Rest of Middle East and Africa Clean Label Ingredients Industry Revenue (Million) Forecast, by Application 2019 & 2032
- Table 32: Global Clean Label Ingredients Industry Revenue Million Forecast, by Product Type 2019 & 2032
- Table 33: Global Clean Label Ingredients Industry Revenue Million Forecast, by Application 2019 & 2032
- Table 34: Global Clean Label Ingredients Industry Revenue Million Forecast, by Country 2019 & 2032
- Table 35: United States Clean Label Ingredients Industry Revenue (Million) Forecast, by Application 2019 & 2032
- Table 36: Canada Clean Label Ingredients Industry Revenue (Million) Forecast, by Application 2019 & 2032
- Table 37: Mexico Clean Label Ingredients Industry Revenue (Million) Forecast, by Application 2019 & 2032
- Table 38: Rest of North America Clean Label Ingredients Industry Revenue (Million) Forecast, by Application 2019 & 2032
- Table 39: Global Clean Label Ingredients Industry Revenue Million Forecast, by Product Type 2019 & 2032
- Table 40: Global Clean Label Ingredients Industry Revenue Million Forecast, by Application 2019 & 2032
- Table 41: Global Clean Label Ingredients Industry Revenue Million Forecast, by Country 2019 & 2032
- Table 42: United Kingdom Clean Label Ingredients Industry Revenue (Million) Forecast, by Application 2019 & 2032
- Table 43: Germany Clean Label Ingredients Industry Revenue (Million) Forecast, by Application 2019 & 2032
- Table 44: Spain Clean Label Ingredients Industry Revenue (Million) Forecast, by Application 2019 & 2032
- Table 45: France Clean Label Ingredients Industry Revenue (Million) Forecast, by Application 2019 & 2032
- Table 46: Italy Clean Label Ingredients Industry Revenue (Million) Forecast, by Application 2019 & 2032
- Table 47: Russia Clean Label Ingredients Industry Revenue (Million) Forecast, by Application 2019 & 2032
- Table 48: Rest of Europe Clean Label Ingredients Industry Revenue (Million) Forecast, by Application 2019 & 2032
- Table 49: Global Clean Label Ingredients Industry Revenue Million Forecast, by Product Type 2019 & 2032
- Table 50: Global Clean Label Ingredients Industry Revenue Million Forecast, by Application 2019 & 2032
- Table 51: Global Clean Label Ingredients Industry Revenue Million Forecast, by Country 2019 & 2032
- Table 52: China Clean Label Ingredients Industry Revenue (Million) Forecast, by Application 2019 & 2032
- Table 53: Japan Clean Label Ingredients Industry Revenue (Million) Forecast, by Application 2019 & 2032
- Table 54: India Clean Label Ingredients Industry Revenue (Million) Forecast, by Application 2019 & 2032
- Table 55: Australia Clean Label Ingredients Industry Revenue (Million) Forecast, by Application 2019 & 2032
- Table 56: Rest of Asia Pacific Clean Label Ingredients Industry Revenue (Million) Forecast, by Application 2019 & 2032
- Table 57: Global Clean Label Ingredients Industry Revenue Million Forecast, by Product Type 2019 & 2032
- Table 58: Global Clean Label Ingredients Industry Revenue Million Forecast, by Application 2019 & 2032
- Table 59: Global Clean Label Ingredients Industry Revenue Million Forecast, by Country 2019 & 2032
- Table 60: Brazil Clean Label Ingredients Industry Revenue (Million) Forecast, by Application 2019 & 2032
- Table 61: Argentina Clean Label Ingredients Industry Revenue (Million) Forecast, by Application 2019 & 2032
- Table 62: Rest of South America Clean Label Ingredients Industry Revenue (Million) Forecast, by Application 2019 & 2032
- Table 63: Global Clean Label Ingredients Industry Revenue Million Forecast, by Product Type 2019 & 2032
- Table 64: Global Clean Label Ingredients Industry Revenue Million Forecast, by Application 2019 & 2032
- Table 65: Global Clean Label Ingredients Industry Revenue Million Forecast, by Country 2019 & 2032
- Table 66: South Africa Clean Label Ingredients Industry Revenue (Million) Forecast, by Application 2019 & 2032
- Table 67: Saudi Arabia Clean Label Ingredients Industry Revenue (Million) Forecast, by Application 2019 & 2032
- Table 68: Rest of Middle East and Africa Clean Label Ingredients Industry Revenue (Million) Forecast, by Application 2019 & 2032
Frequently Asked Questions
1. What is the projected Compound Annual Growth Rate (CAGR) of the Clean Label Ingredients Industry?
The projected CAGR is approximately 6.51%.
2. Which companies are prominent players in the Clean Label Ingredients Industry?
Key companies in the market include Sensient Technologies Corporation*List Not Exhaustive, Cargill Incorporated, International Flavors & Fragrances Inc, DSM-Firmenich, Archer Daniels Midland Company, Ajinomoto Co Inc, Tate & Lyle PLC, Kerry Group PLC, Ingredion Incorporated, Corbion NV.
3. What are the main segments of the Clean Label Ingredients Industry?
The market segments include Product Type, Application.
4. Can you provide details about the market size?
The market size is estimated to be USD 42.76 Million as of 2022.
5. What are some drivers contributing to market growth?
Increasing Health and Wellness Trends Fueling Market Growth; Rising Demand for Natural Ingredients.
6. What are the notable trends driving market growth?
Increasing Health and Wellness Trends Fueling Market Growth.
7. Are there any restraints impacting market growth?
High Cost Hampering Market Growth.
8. Can you provide examples of recent developments in the market?
February 2024: Ajinomoto Co. opened a new office in Silicon Valley, United States. The office provides different types of food solutions, including clean label ingredients in the US market. The purpose of this expansion was to expand the company’s business.
9. What pricing options are available for accessing the report?
Pricing options include single-user, multi-user, and enterprise licenses priced at USD 4750, USD 5250, and USD 8750 respectively.
10. Is the market size provided in terms of value or volume?
The market size is provided in terms of value, measured in Million.
11. Are there any specific market keywords associated with the report?
Yes, the market keyword associated with the report is "Clean Label Ingredients Industry," which aids in identifying and referencing the specific market segment covered.
12. How do I determine which pricing option suits my needs best?
The pricing options vary based on user requirements and access needs. Individual users may opt for single-user licenses, while businesses requiring broader access may choose multi-user or enterprise licenses for cost-effective access to the report.
13. Are there any additional resources or data provided in the Clean Label Ingredients Industry report?
While the report offers comprehensive insights, it's advisable to review the specific contents or supplementary materials provided to ascertain if additional resources or data are available.
14. How can I stay updated on further developments or reports in the Clean Label Ingredients Industry?
To stay informed about further developments, trends, and reports in the Clean Label Ingredients Industry, consider subscribing to industry newsletters, following relevant companies and organizations, or regularly checking reputable industry news sources and publications.
Methodology
Step 1 - Identification of Relevant Samples Size from Population Database


Step 2 - Approaches for Defining Global Market Size (Value, Volume* & Price*)

Note*: In applicable scenarios
Step 3 - Data Sources
Primary Research
- Web Analytics
- Survey Reports
- Research Institute
- Latest Research Reports
- Opinion Leaders
Secondary Research
- Annual Reports
- White Paper
- Latest Press Release
- Industry Association
- Paid Database
- Investor Presentations

Step 4 - Data Triangulation
Involves using different sources of information in order to increase the validity of a study
These sources are likely to be stakeholders in a program - participants, other researchers, program staff, other community members, and so on.
Then we put all data in single framework & apply various statistical tools to find out the dynamic on the market.
During the analysis stage, feedback from the stakeholder groups would be compared to determine areas of agreement as well as areas of divergence
