

Key Insights
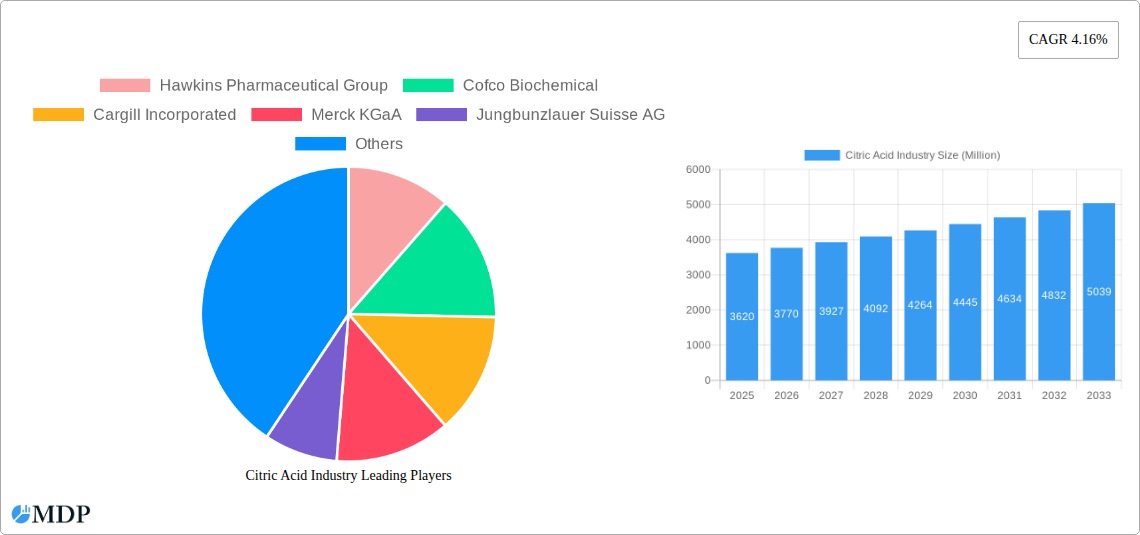
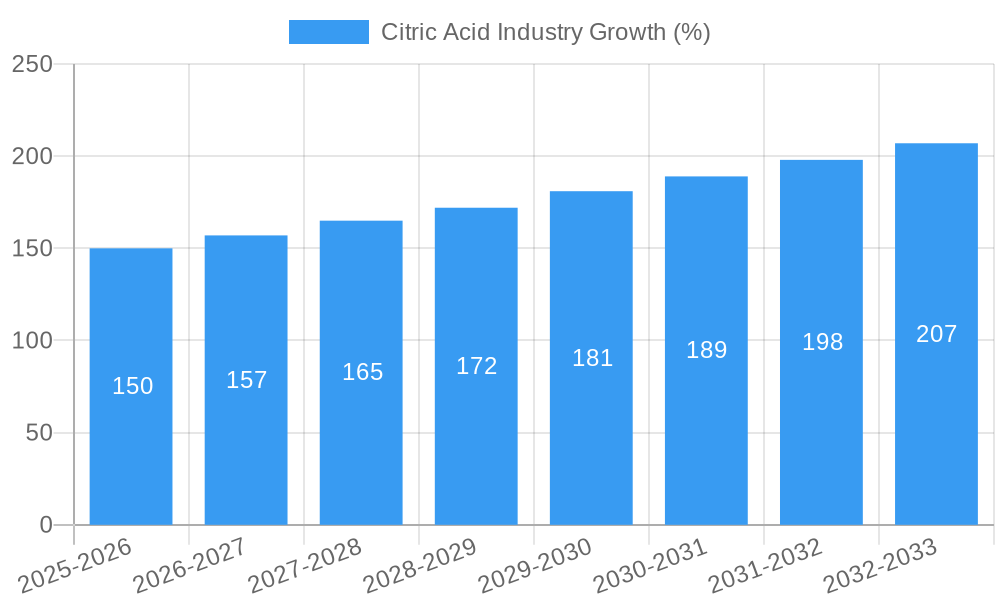
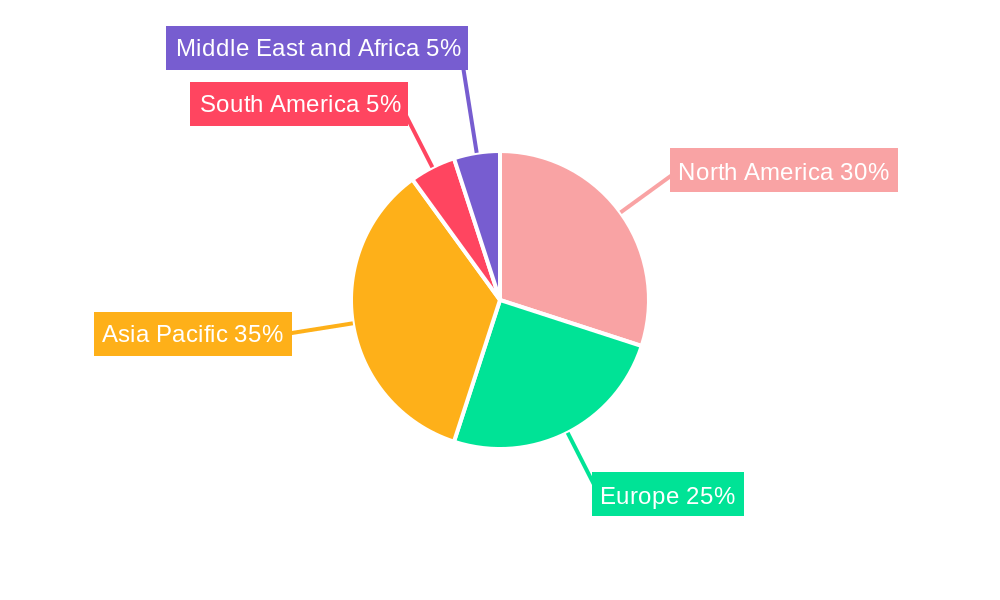
The global citric acid market, valued at $3.62 billion in 2025, is projected to experience robust growth, driven by its widespread applications across diverse sectors. A compound annual growth rate (CAGR) of 4.16% from 2025 to 2033 indicates a significant expansion, primarily fueled by the increasing demand from the food and beverage industry. This sector leverages citric acid extensively as a flavoring agent, preservative, and acidity regulator. The pharmaceutical industry also contributes significantly, utilizing citric acid in drug formulations and as an excipient. Growth in the personal care sector, where it acts as a chelating agent and pH adjuster in cosmetics and skincare products, further bolsters market expansion. While the market faces constraints such as price fluctuations in raw materials (primarily sugarcane and molasses) and potential regulatory changes, the overall outlook remains positive. Technological advancements in fermentation processes and the exploration of sustainable sourcing contribute to the market's long-term growth trajectory. The liquid form of citric acid currently dominates the market due to its ease of handling and versatility in various applications. However, the anhydrous form is expected to witness increased adoption in niche applications requiring higher purity and longer shelf life. Geographically, North America and Europe currently hold substantial market shares, but the Asia-Pacific region is anticipated to exhibit faster growth due to increasing industrialization and rising disposable incomes. Key players, including Hawkins Pharmaceutical Group, Cargill Incorporated, and Merck KGaA, are strategically investing in research and development, capacity expansions, and mergers and acquisitions to consolidate their market positions and capitalize on emerging opportunities.
The competitive landscape is characterized by both large multinational corporations and smaller specialized producers. The market is witnessing a trend towards increased focus on sustainability and eco-friendly production methods, in line with global efforts to reduce environmental impact. This includes utilizing renewable feedstock and implementing efficient energy management systems within manufacturing plants. Furthermore, the industry is experiencing ongoing innovation in delivery formats and specialized formulations to meet the evolving demands of various applications. This includes customized blends designed to optimize specific functionalities within finished products and to meet unique customer needs across various industries. The ongoing expansion of the global food and beverage industry, coupled with growing awareness of the health and functional benefits of citric acid, are key factors anticipated to drive further market growth in the coming years.
Citric Acid Industry: A Comprehensive Market Report (2019-2033)
This comprehensive report provides an in-depth analysis of the global citric acid industry, offering invaluable insights for stakeholders across the value chain. From market dynamics and leading players to emerging trends and future opportunities, this report covers all aspects of this dynamic sector, projecting a market size of xx Million by 2033. The study period spans 2019-2033, with a base year of 2025 and a forecast period of 2025-2033. This report is your essential guide to navigating the complexities and capitalizing on the growth potential within the citric acid market.
Citric Acid Industry Market Dynamics & Concentration
The global citric acid market, valued at xx Million in 2024, exhibits a moderately concentrated landscape with several key players commanding significant market share. Hawkins Pharmaceutical Group, Cofco Biochemical, Cargill Incorporated, Merck KGaA, and Jungbunzlauer Suisse AG are among the leading companies, driving innovation and shaping market trends. Market concentration is influenced by factors including economies of scale in production, R&D capabilities, and established distribution networks.
Key Dynamics:
- Innovation Drivers: The industry is witnessing continuous innovation in production processes, focusing on enhancing efficiency, sustainability, and product quality. The development of novel citrate-based ingredients for functional foods and beverages fuels growth.
- Regulatory Frameworks: Stringent food safety and quality regulations influence market dynamics, especially concerning the purity and safety of citric acid used in various applications.
- Product Substitutes: While citric acid holds a dominant position due to its versatility and cost-effectiveness, alternative acids exist, albeit with limited market penetration.
- End-User Trends: The growing demand for healthier and functional food products, along with the increasing use of citric acid in pharmaceutical and personal care products, are key drivers.
- M&A Activities: The past five years have witnessed xx M&A deals, indicating strategic consolidation and expansion efforts by major players, potentially leading to further market concentration. For example, the predicted market share of Cargill Incorporated is xx% in 2025.
Citric Acid Industry Industry Trends & Analysis
The citric acid market is experiencing robust growth, driven by several factors. The projected Compound Annual Growth Rate (CAGR) for the forecast period (2025-2033) is xx%, fueled by increasing consumer preference for healthier food and beverages, rising demand in the pharmaceutical industry, and the expanding personal care sector. Market penetration of citric acid in novel applications continues to increase, further driving market expansion. Technological advancements in production processes are contributing to enhanced efficiency and reduced production costs. However, competitive dynamics, including pricing pressures and the emergence of new players, continue to influence market growth. The market penetration of anhydrous citric acid reached xx% in 2024.
Leading Markets & Segments in Citric Acid Industry
The Food and Beverage segment remains the dominant application for citric acid, accounting for xx% of the market in 2025. Geographically, [Dominant Region, e.g., North America] holds the largest market share, driven by high consumption levels and established infrastructure. Within forms, anhydrous citric acid holds a larger market share compared to liquid form due to its ease of handling and storage.
Key Drivers:
- Food and Beverage: Increasing demand for processed foods and beverages, coupled with the functional properties of citric acid as a flavor enhancer and preservative, drives this segment.
- Pharmaceutical: Citric acid's use as a pharmaceutical excipient and in the production of various drugs fuels market growth.
- Personal Care: The use of citric acid as a pH adjuster and chelating agent in cosmetics and personal care products contributes significantly.
Dominance Analysis:
[Dominant Region/Country] leads due to strong economic growth, well-established food processing and pharmaceutical industries, and supportive government policies promoting food safety and industrial development. The significant market share of the Food and Beverage segment reflects strong consumer demand for processed foods and beverages across the globe.
Citric Acid Industry Product Developments
Recent product innovations focus on improving the functional properties of citric acid, such as enhanced solubility, improved taste, and customized formulations for specific applications. The launch of new products like Gadot Biochemical Industries' Cal2Mg and Jungbunzlauer's Monomagnesium citrate exemplifies the industry's focus on functional ingredients catering to health-conscious consumers. These developments demonstrate the industry's commitment to providing high-quality, value-added products meeting the evolving demands of various end-use industries.
Key Drivers of Citric Acid Industry Growth
The citric acid market's growth is propelled by several factors: Firstly, the increasing demand for functional foods and beverages containing added nutritional benefits drives the need for citric acid as a flavor enhancer and preservative. Secondly, technological advancements, such as improved production processes and sustainable manufacturing practices, enhance efficiency and reduce production costs. Finally, supportive government regulations promoting food safety and quality in various regions further boost market growth.
Challenges in the Citric Acid Industry Market
The citric acid industry faces challenges like fluctuations in raw material prices, potentially impacting production costs and profitability. Supply chain disruptions can also affect production and distribution, impacting timely delivery of products. Intense competition, particularly from emerging players, necessitates constant innovation and product differentiation to maintain market share. Estimated impact of these challenges on market growth is a predicted reduction in CAGR by xx% in 2027.
Emerging Opportunities in Citric Acid Industry
Future growth in the citric acid market is anticipated through strategic partnerships and collaborations among industry players to develop innovative and sustainable production processes. Expanding into new and emerging markets in developing economies presents significant growth potential. Technological breakthroughs in fermentation technology and bio-based production methods offer opportunities for enhanced efficiency and sustainability.
Leading Players in the Citric Acid Industry Sector
- Hawkins Pharmaceutical Group
- Cofco Biochemical
- Cargill Incorporated
- Merck KGaA
- Jungbunzlauer Suisse AG
- Posy Pharmachem Pvt Ltd
- Archer Daniels Midland Company
- Saudi Bio-Acids Company
- Gadot Biochemical Industries
- Foodchem International Corporation
Key Milestones in Citric Acid Industry Industry
- April 2021: Jungbunzlauer announced the expansion of its citric acid plant in Port Colborne, Canada, to meet growing global demand.
- June 2022: Jungbunzlauer launched Monomagnesium citrate, a new magnesium salt for functional foods and beverages.
- November 2022: Gadot Biochemical Industries launched Cal2Mg, a calcium and magnesium citrate composition with enhanced texture.
Strategic Outlook for Citric Acid Industry Market
The citric acid market presents significant growth potential driven by increasing demand in key applications. Strategic investments in R&D, expansion into new markets, and sustainable production methods will be crucial for success. Collaborations and partnerships will play a key role in fostering innovation and driving long-term growth within this competitive yet dynamic industry.
Citric Acid Industry Segmentation
-
1. Form
- 1.1. Liquid
- 1.2. Anhydrous
-
2. Application
-
2.1. Food and Beverage
- 2.1.1. Bakery
- 2.1.2. Confectionery
- 2.1.3. Dairy
- 2.1.4. Beverages
- 2.1.5. Other Foods and Beverages
- 2.2. Pharmaceutical
- 2.3. Personal Care
- 2.4. Other Applications
-
2.1. Food and Beverage
Citric Acid Industry Segmentation By Geography
-
1. North America
- 1.1. United States
- 1.2. Canada
- 1.3. Mexico
- 1.4. Rest of North America
-
2. Europe
- 2.1. Germany
- 2.2. United Kingdom
- 2.3. France
- 2.4. Russia
- 2.5. Spain
- 2.6. Italy
- 2.7. Rest of Europe
-
3. Asia Pacific
- 3.1. India
- 3.2. China
- 3.3. Japan
- 3.4. Australia
- 3.5. Rest of Asia Pacific
-
4. South America
- 4.1. Brazil
- 4.2. Argentina
- 4.3. Rest of South America
-
5. Middle East and Africa
- 5.1. South Africa
- 5.2. United Arab Emirates
- 5.3. Rest of Middle East and Africa
Citric Acid Industry REPORT HIGHLIGHTS
| Aspects | Details |
|---|---|
| Study Period | 2019-2033 |
| Base Year | 2024 |
| Estimated Year | 2025 |
| Forecast Period | 2025-2033 |
| Historical Period | 2019-2024 |
| Growth Rate | CAGR of 4.16% from 2019-2033 |
| Segmentation |
|
Table of Contents
- 1. Introduction
- 1.1. Research Scope
- 1.2. Market Segmentation
- 1.3. Research Methodology
- 1.4. Definitions and Assumptions
- 2. Executive Summary
- 2.1. Introduction
- 3. Market Dynamics
- 3.1. Introduction
- 3.2. Market Drivers
- 3.2.1. Increasing Incidences of Food Allergies; Favorable Government Initiatives and Regulations for Food Safety
- 3.3. Market Restrains
- 3.3.1. Inconsistencies Involved in Food Allergen Declarations
- 3.4. Market Trends
- 3.4.1. Increasing Demand for Clean-Label and Natural/Organic Ingredients
- 4. Market Factor Analysis
- 4.1. Porters Five Forces
- 4.2. Supply/Value Chain
- 4.3. PESTEL analysis
- 4.4. Market Entropy
- 4.5. Patent/Trademark Analysis
- 5. Global Citric Acid Industry Analysis, Insights and Forecast, 2019-2031
- 5.1. Market Analysis, Insights and Forecast - by Form
- 5.1.1. Liquid
- 5.1.2. Anhydrous
- 5.2. Market Analysis, Insights and Forecast - by Application
- 5.2.1. Food and Beverage
- 5.2.1.1. Bakery
- 5.2.1.2. Confectionery
- 5.2.1.3. Dairy
- 5.2.1.4. Beverages
- 5.2.1.5. Other Foods and Beverages
- 5.2.2. Pharmaceutical
- 5.2.3. Personal Care
- 5.2.4. Other Applications
- 5.2.1. Food and Beverage
- 5.3. Market Analysis, Insights and Forecast - by Region
- 5.3.1. North America
- 5.3.2. Europe
- 5.3.3. Asia Pacific
- 5.3.4. South America
- 5.3.5. Middle East and Africa
- 5.1. Market Analysis, Insights and Forecast - by Form
- 6. North America Citric Acid Industry Analysis, Insights and Forecast, 2019-2031
- 6.1. Market Analysis, Insights and Forecast - by Form
- 6.1.1. Liquid
- 6.1.2. Anhydrous
- 6.2. Market Analysis, Insights and Forecast - by Application
- 6.2.1. Food and Beverage
- 6.2.1.1. Bakery
- 6.2.1.2. Confectionery
- 6.2.1.3. Dairy
- 6.2.1.4. Beverages
- 6.2.1.5. Other Foods and Beverages
- 6.2.2. Pharmaceutical
- 6.2.3. Personal Care
- 6.2.4. Other Applications
- 6.2.1. Food and Beverage
- 6.1. Market Analysis, Insights and Forecast - by Form
- 7. Europe Citric Acid Industry Analysis, Insights and Forecast, 2019-2031
- 7.1. Market Analysis, Insights and Forecast - by Form
- 7.1.1. Liquid
- 7.1.2. Anhydrous
- 7.2. Market Analysis, Insights and Forecast - by Application
- 7.2.1. Food and Beverage
- 7.2.1.1. Bakery
- 7.2.1.2. Confectionery
- 7.2.1.3. Dairy
- 7.2.1.4. Beverages
- 7.2.1.5. Other Foods and Beverages
- 7.2.2. Pharmaceutical
- 7.2.3. Personal Care
- 7.2.4. Other Applications
- 7.2.1. Food and Beverage
- 7.1. Market Analysis, Insights and Forecast - by Form
- 8. Asia Pacific Citric Acid Industry Analysis, Insights and Forecast, 2019-2031
- 8.1. Market Analysis, Insights and Forecast - by Form
- 8.1.1. Liquid
- 8.1.2. Anhydrous
- 8.2. Market Analysis, Insights and Forecast - by Application
- 8.2.1. Food and Beverage
- 8.2.1.1. Bakery
- 8.2.1.2. Confectionery
- 8.2.1.3. Dairy
- 8.2.1.4. Beverages
- 8.2.1.5. Other Foods and Beverages
- 8.2.2. Pharmaceutical
- 8.2.3. Personal Care
- 8.2.4. Other Applications
- 8.2.1. Food and Beverage
- 8.1. Market Analysis, Insights and Forecast - by Form
- 9. South America Citric Acid Industry Analysis, Insights and Forecast, 2019-2031
- 9.1. Market Analysis, Insights and Forecast - by Form
- 9.1.1. Liquid
- 9.1.2. Anhydrous
- 9.2. Market Analysis, Insights and Forecast - by Application
- 9.2.1. Food and Beverage
- 9.2.1.1. Bakery
- 9.2.1.2. Confectionery
- 9.2.1.3. Dairy
- 9.2.1.4. Beverages
- 9.2.1.5. Other Foods and Beverages
- 9.2.2. Pharmaceutical
- 9.2.3. Personal Care
- 9.2.4. Other Applications
- 9.2.1. Food and Beverage
- 9.1. Market Analysis, Insights and Forecast - by Form
- 10. Middle East and Africa Citric Acid Industry Analysis, Insights and Forecast, 2019-2031
- 10.1. Market Analysis, Insights and Forecast - by Form
- 10.1.1. Liquid
- 10.1.2. Anhydrous
- 10.2. Market Analysis, Insights and Forecast - by Application
- 10.2.1. Food and Beverage
- 10.2.1.1. Bakery
- 10.2.1.2. Confectionery
- 10.2.1.3. Dairy
- 10.2.1.4. Beverages
- 10.2.1.5. Other Foods and Beverages
- 10.2.2. Pharmaceutical
- 10.2.3. Personal Care
- 10.2.4. Other Applications
- 10.2.1. Food and Beverage
- 10.1. Market Analysis, Insights and Forecast - by Form
- 11. North America Citric Acid Industry Analysis, Insights and Forecast, 2019-2031
- 11.1. Market Analysis, Insights and Forecast - By Country/Sub-region
- 11.1.1 United States
- 11.1.2 Canada
- 11.1.3 Mexico
- 11.1.4 Rest of North America
- 12. Europe Citric Acid Industry Analysis, Insights and Forecast, 2019-2031
- 12.1. Market Analysis, Insights and Forecast - By Country/Sub-region
- 12.1.1 Germany
- 12.1.2 United Kingdom
- 12.1.3 France
- 12.1.4 Russia
- 12.1.5 Spain
- 12.1.6 Italy
- 12.1.7 Rest of Europe
- 13. Asia Pacific Citric Acid Industry Analysis, Insights and Forecast, 2019-2031
- 13.1. Market Analysis, Insights and Forecast - By Country/Sub-region
- 13.1.1 India
- 13.1.2 China
- 13.1.3 Japan
- 13.1.4 Australia
- 13.1.5 Rest of Asia Pacific
- 14. South America Citric Acid Industry Analysis, Insights and Forecast, 2019-2031
- 14.1. Market Analysis, Insights and Forecast - By Country/Sub-region
- 14.1.1 Brazil
- 14.1.2 Argentina
- 14.1.3 Rest of South America
- 15. Middle East and Africa Citric Acid Industry Analysis, Insights and Forecast, 2019-2031
- 15.1. Market Analysis, Insights and Forecast - By Country/Sub-region
- 15.1.1 South Africa
- 15.1.2 United Arab Emirates
- 15.1.3 Rest of Middle East and Africa
- 16. Competitive Analysis
- 16.1. Global Market Share Analysis 2024
- 16.2. Company Profiles
- 16.2.1 Hawkins Pharmaceutical Group
- 16.2.1.1. Overview
- 16.2.1.2. Products
- 16.2.1.3. SWOT Analysis
- 16.2.1.4. Recent Developments
- 16.2.1.5. Financials (Based on Availability)
- 16.2.2 Cofco Biochemical
- 16.2.2.1. Overview
- 16.2.2.2. Products
- 16.2.2.3. SWOT Analysis
- 16.2.2.4. Recent Developments
- 16.2.2.5. Financials (Based on Availability)
- 16.2.3 Cargill Incorporated
- 16.2.3.1. Overview
- 16.2.3.2. Products
- 16.2.3.3. SWOT Analysis
- 16.2.3.4. Recent Developments
- 16.2.3.5. Financials (Based on Availability)
- 16.2.4 Merck KGaA
- 16.2.4.1. Overview
- 16.2.4.2. Products
- 16.2.4.3. SWOT Analysis
- 16.2.4.4. Recent Developments
- 16.2.4.5. Financials (Based on Availability)
- 16.2.5 Jungbunzlauer Suisse AG
- 16.2.5.1. Overview
- 16.2.5.2. Products
- 16.2.5.3. SWOT Analysis
- 16.2.5.4. Recent Developments
- 16.2.5.5. Financials (Based on Availability)
- 16.2.6 Posy Pharmachem Pvt Ltd
- 16.2.6.1. Overview
- 16.2.6.2. Products
- 16.2.6.3. SWOT Analysis
- 16.2.6.4. Recent Developments
- 16.2.6.5. Financials (Based on Availability)
- 16.2.7 Archer Daniels Midland Company
- 16.2.7.1. Overview
- 16.2.7.2. Products
- 16.2.7.3. SWOT Analysis
- 16.2.7.4. Recent Developments
- 16.2.7.5. Financials (Based on Availability)
- 16.2.8 Saudi Bio-Acids Company*List Not Exhaustive
- 16.2.8.1. Overview
- 16.2.8.2. Products
- 16.2.8.3. SWOT Analysis
- 16.2.8.4. Recent Developments
- 16.2.8.5. Financials (Based on Availability)
- 16.2.9 Gadot Biochemical Industries
- 16.2.9.1. Overview
- 16.2.9.2. Products
- 16.2.9.3. SWOT Analysis
- 16.2.9.4. Recent Developments
- 16.2.9.5. Financials (Based on Availability)
- 16.2.10 Foodchem International Corporation
- 16.2.10.1. Overview
- 16.2.10.2. Products
- 16.2.10.3. SWOT Analysis
- 16.2.10.4. Recent Developments
- 16.2.10.5. Financials (Based on Availability)
- 16.2.1 Hawkins Pharmaceutical Group
List of Figures
- Figure 1: Global Citric Acid Industry Revenue Breakdown (Million, %) by Region 2024 & 2032
- Figure 2: North America Citric Acid Industry Revenue (Million), by Country 2024 & 2032
- Figure 3: North America Citric Acid Industry Revenue Share (%), by Country 2024 & 2032
- Figure 4: Europe Citric Acid Industry Revenue (Million), by Country 2024 & 2032
- Figure 5: Europe Citric Acid Industry Revenue Share (%), by Country 2024 & 2032
- Figure 6: Asia Pacific Citric Acid Industry Revenue (Million), by Country 2024 & 2032
- Figure 7: Asia Pacific Citric Acid Industry Revenue Share (%), by Country 2024 & 2032
- Figure 8: South America Citric Acid Industry Revenue (Million), by Country 2024 & 2032
- Figure 9: South America Citric Acid Industry Revenue Share (%), by Country 2024 & 2032
- Figure 10: Middle East and Africa Citric Acid Industry Revenue (Million), by Country 2024 & 2032
- Figure 11: Middle East and Africa Citric Acid Industry Revenue Share (%), by Country 2024 & 2032
- Figure 12: North America Citric Acid Industry Revenue (Million), by Form 2024 & 2032
- Figure 13: North America Citric Acid Industry Revenue Share (%), by Form 2024 & 2032
- Figure 14: North America Citric Acid Industry Revenue (Million), by Application 2024 & 2032
- Figure 15: North America Citric Acid Industry Revenue Share (%), by Application 2024 & 2032
- Figure 16: North America Citric Acid Industry Revenue (Million), by Country 2024 & 2032
- Figure 17: North America Citric Acid Industry Revenue Share (%), by Country 2024 & 2032
- Figure 18: Europe Citric Acid Industry Revenue (Million), by Form 2024 & 2032
- Figure 19: Europe Citric Acid Industry Revenue Share (%), by Form 2024 & 2032
- Figure 20: Europe Citric Acid Industry Revenue (Million), by Application 2024 & 2032
- Figure 21: Europe Citric Acid Industry Revenue Share (%), by Application 2024 & 2032
- Figure 22: Europe Citric Acid Industry Revenue (Million), by Country 2024 & 2032
- Figure 23: Europe Citric Acid Industry Revenue Share (%), by Country 2024 & 2032
- Figure 24: Asia Pacific Citric Acid Industry Revenue (Million), by Form 2024 & 2032
- Figure 25: Asia Pacific Citric Acid Industry Revenue Share (%), by Form 2024 & 2032
- Figure 26: Asia Pacific Citric Acid Industry Revenue (Million), by Application 2024 & 2032
- Figure 27: Asia Pacific Citric Acid Industry Revenue Share (%), by Application 2024 & 2032
- Figure 28: Asia Pacific Citric Acid Industry Revenue (Million), by Country 2024 & 2032
- Figure 29: Asia Pacific Citric Acid Industry Revenue Share (%), by Country 2024 & 2032
- Figure 30: South America Citric Acid Industry Revenue (Million), by Form 2024 & 2032
- Figure 31: South America Citric Acid Industry Revenue Share (%), by Form 2024 & 2032
- Figure 32: South America Citric Acid Industry Revenue (Million), by Application 2024 & 2032
- Figure 33: South America Citric Acid Industry Revenue Share (%), by Application 2024 & 2032
- Figure 34: South America Citric Acid Industry Revenue (Million), by Country 2024 & 2032
- Figure 35: South America Citric Acid Industry Revenue Share (%), by Country 2024 & 2032
- Figure 36: Middle East and Africa Citric Acid Industry Revenue (Million), by Form 2024 & 2032
- Figure 37: Middle East and Africa Citric Acid Industry Revenue Share (%), by Form 2024 & 2032
- Figure 38: Middle East and Africa Citric Acid Industry Revenue (Million), by Application 2024 & 2032
- Figure 39: Middle East and Africa Citric Acid Industry Revenue Share (%), by Application 2024 & 2032
- Figure 40: Middle East and Africa Citric Acid Industry Revenue (Million), by Country 2024 & 2032
- Figure 41: Middle East and Africa Citric Acid Industry Revenue Share (%), by Country 2024 & 2032
List of Tables
- Table 1: Global Citric Acid Industry Revenue Million Forecast, by Region 2019 & 2032
- Table 2: Global Citric Acid Industry Revenue Million Forecast, by Form 2019 & 2032
- Table 3: Global Citric Acid Industry Revenue Million Forecast, by Application 2019 & 2032
- Table 4: Global Citric Acid Industry Revenue Million Forecast, by Region 2019 & 2032
- Table 5: Global Citric Acid Industry Revenue Million Forecast, by Country 2019 & 2032
- Table 6: United States Citric Acid Industry Revenue (Million) Forecast, by Application 2019 & 2032
- Table 7: Canada Citric Acid Industry Revenue (Million) Forecast, by Application 2019 & 2032
- Table 8: Mexico Citric Acid Industry Revenue (Million) Forecast, by Application 2019 & 2032
- Table 9: Rest of North America Citric Acid Industry Revenue (Million) Forecast, by Application 2019 & 2032
- Table 10: Global Citric Acid Industry Revenue Million Forecast, by Country 2019 & 2032
- Table 11: Germany Citric Acid Industry Revenue (Million) Forecast, by Application 2019 & 2032
- Table 12: United Kingdom Citric Acid Industry Revenue (Million) Forecast, by Application 2019 & 2032
- Table 13: France Citric Acid Industry Revenue (Million) Forecast, by Application 2019 & 2032
- Table 14: Russia Citric Acid Industry Revenue (Million) Forecast, by Application 2019 & 2032
- Table 15: Spain Citric Acid Industry Revenue (Million) Forecast, by Application 2019 & 2032
- Table 16: Italy Citric Acid Industry Revenue (Million) Forecast, by Application 2019 & 2032
- Table 17: Rest of Europe Citric Acid Industry Revenue (Million) Forecast, by Application 2019 & 2032
- Table 18: Global Citric Acid Industry Revenue Million Forecast, by Country 2019 & 2032
- Table 19: India Citric Acid Industry Revenue (Million) Forecast, by Application 2019 & 2032
- Table 20: China Citric Acid Industry Revenue (Million) Forecast, by Application 2019 & 2032
- Table 21: Japan Citric Acid Industry Revenue (Million) Forecast, by Application 2019 & 2032
- Table 22: Australia Citric Acid Industry Revenue (Million) Forecast, by Application 2019 & 2032
- Table 23: Rest of Asia Pacific Citric Acid Industry Revenue (Million) Forecast, by Application 2019 & 2032
- Table 24: Global Citric Acid Industry Revenue Million Forecast, by Country 2019 & 2032
- Table 25: Brazil Citric Acid Industry Revenue (Million) Forecast, by Application 2019 & 2032
- Table 26: Argentina Citric Acid Industry Revenue (Million) Forecast, by Application 2019 & 2032
- Table 27: Rest of South America Citric Acid Industry Revenue (Million) Forecast, by Application 2019 & 2032
- Table 28: Global Citric Acid Industry Revenue Million Forecast, by Country 2019 & 2032
- Table 29: South Africa Citric Acid Industry Revenue (Million) Forecast, by Application 2019 & 2032
- Table 30: United Arab Emirates Citric Acid Industry Revenue (Million) Forecast, by Application 2019 & 2032
- Table 31: Rest of Middle East and Africa Citric Acid Industry Revenue (Million) Forecast, by Application 2019 & 2032
- Table 32: Global Citric Acid Industry Revenue Million Forecast, by Form 2019 & 2032
- Table 33: Global Citric Acid Industry Revenue Million Forecast, by Application 2019 & 2032
- Table 34: Global Citric Acid Industry Revenue Million Forecast, by Country 2019 & 2032
- Table 35: United States Citric Acid Industry Revenue (Million) Forecast, by Application 2019 & 2032
- Table 36: Canada Citric Acid Industry Revenue (Million) Forecast, by Application 2019 & 2032
- Table 37: Mexico Citric Acid Industry Revenue (Million) Forecast, by Application 2019 & 2032
- Table 38: Rest of North America Citric Acid Industry Revenue (Million) Forecast, by Application 2019 & 2032
- Table 39: Global Citric Acid Industry Revenue Million Forecast, by Form 2019 & 2032
- Table 40: Global Citric Acid Industry Revenue Million Forecast, by Application 2019 & 2032
- Table 41: Global Citric Acid Industry Revenue Million Forecast, by Country 2019 & 2032
- Table 42: Germany Citric Acid Industry Revenue (Million) Forecast, by Application 2019 & 2032
- Table 43: United Kingdom Citric Acid Industry Revenue (Million) Forecast, by Application 2019 & 2032
- Table 44: France Citric Acid Industry Revenue (Million) Forecast, by Application 2019 & 2032
- Table 45: Russia Citric Acid Industry Revenue (Million) Forecast, by Application 2019 & 2032
- Table 46: Spain Citric Acid Industry Revenue (Million) Forecast, by Application 2019 & 2032
- Table 47: Italy Citric Acid Industry Revenue (Million) Forecast, by Application 2019 & 2032
- Table 48: Rest of Europe Citric Acid Industry Revenue (Million) Forecast, by Application 2019 & 2032
- Table 49: Global Citric Acid Industry Revenue Million Forecast, by Form 2019 & 2032
- Table 50: Global Citric Acid Industry Revenue Million Forecast, by Application 2019 & 2032
- Table 51: Global Citric Acid Industry Revenue Million Forecast, by Country 2019 & 2032
- Table 52: India Citric Acid Industry Revenue (Million) Forecast, by Application 2019 & 2032
- Table 53: China Citric Acid Industry Revenue (Million) Forecast, by Application 2019 & 2032
- Table 54: Japan Citric Acid Industry Revenue (Million) Forecast, by Application 2019 & 2032
- Table 55: Australia Citric Acid Industry Revenue (Million) Forecast, by Application 2019 & 2032
- Table 56: Rest of Asia Pacific Citric Acid Industry Revenue (Million) Forecast, by Application 2019 & 2032
- Table 57: Global Citric Acid Industry Revenue Million Forecast, by Form 2019 & 2032
- Table 58: Global Citric Acid Industry Revenue Million Forecast, by Application 2019 & 2032
- Table 59: Global Citric Acid Industry Revenue Million Forecast, by Country 2019 & 2032
- Table 60: Brazil Citric Acid Industry Revenue (Million) Forecast, by Application 2019 & 2032
- Table 61: Argentina Citric Acid Industry Revenue (Million) Forecast, by Application 2019 & 2032
- Table 62: Rest of South America Citric Acid Industry Revenue (Million) Forecast, by Application 2019 & 2032
- Table 63: Global Citric Acid Industry Revenue Million Forecast, by Form 2019 & 2032
- Table 64: Global Citric Acid Industry Revenue Million Forecast, by Application 2019 & 2032
- Table 65: Global Citric Acid Industry Revenue Million Forecast, by Country 2019 & 2032
- Table 66: South Africa Citric Acid Industry Revenue (Million) Forecast, by Application 2019 & 2032
- Table 67: United Arab Emirates Citric Acid Industry Revenue (Million) Forecast, by Application 2019 & 2032
- Table 68: Rest of Middle East and Africa Citric Acid Industry Revenue (Million) Forecast, by Application 2019 & 2032
Frequently Asked Questions
1. What is the projected Compound Annual Growth Rate (CAGR) of the Citric Acid Industry?
The projected CAGR is approximately 4.16%.
2. Which companies are prominent players in the Citric Acid Industry?
Key companies in the market include Hawkins Pharmaceutical Group, Cofco Biochemical, Cargill Incorporated, Merck KGaA, Jungbunzlauer Suisse AG, Posy Pharmachem Pvt Ltd, Archer Daniels Midland Company, Saudi Bio-Acids Company*List Not Exhaustive, Gadot Biochemical Industries, Foodchem International Corporation.
3. What are the main segments of the Citric Acid Industry?
The market segments include Form, Application.
4. Can you provide details about the market size?
The market size is estimated to be USD 3.62 Million as of 2022.
5. What are some drivers contributing to market growth?
Increasing Incidences of Food Allergies; Favorable Government Initiatives and Regulations for Food Safety.
6. What are the notable trends driving market growth?
Increasing Demand for Clean-Label and Natural/Organic Ingredients.
7. Are there any restraints impacting market growth?
Inconsistencies Involved in Food Allergen Declarations.
8. Can you provide examples of recent developments in the market?
November 2022: Gadot Biochemical Industries launched a new product called Cal2Mg, which is a composition of calcium citrate and magnesium citrate. The product is produced using a unique granulation process with the addition of a binder. This process helps to enhance the product's texture, making it easier to handle and incorporate into various food applications. With this launch, Gadot Biochemical Industries aims to cater to the growing demand for high-quality, functional food ingredients that can provide additional nutritional benefits to consumers.
9. What pricing options are available for accessing the report?
Pricing options include single-user, multi-user, and enterprise licenses priced at USD 4750, USD 5250, and USD 8750 respectively.
10. Is the market size provided in terms of value or volume?
The market size is provided in terms of value, measured in Million.
11. Are there any specific market keywords associated with the report?
Yes, the market keyword associated with the report is "Citric Acid Industry," which aids in identifying and referencing the specific market segment covered.
12. How do I determine which pricing option suits my needs best?
The pricing options vary based on user requirements and access needs. Individual users may opt for single-user licenses, while businesses requiring broader access may choose multi-user or enterprise licenses for cost-effective access to the report.
13. Are there any additional resources or data provided in the Citric Acid Industry report?
While the report offers comprehensive insights, it's advisable to review the specific contents or supplementary materials provided to ascertain if additional resources or data are available.
14. How can I stay updated on further developments or reports in the Citric Acid Industry?
To stay informed about further developments, trends, and reports in the Citric Acid Industry, consider subscribing to industry newsletters, following relevant companies and organizations, or regularly checking reputable industry news sources and publications.
Methodology
Step 1 - Identification of Relevant Samples Size from Population Database


Step 2 - Approaches for Defining Global Market Size (Value, Volume* & Price*)

Note*: In applicable scenarios
Step 3 - Data Sources
Primary Research
- Web Analytics
- Survey Reports
- Research Institute
- Latest Research Reports
- Opinion Leaders
Secondary Research
- Annual Reports
- White Paper
- Latest Press Release
- Industry Association
- Paid Database
- Investor Presentations

Step 4 - Data Triangulation
Involves using different sources of information in order to increase the validity of a study
These sources are likely to be stakeholders in a program - participants, other researchers, program staff, other community members, and so on.
Then we put all data in single framework & apply various statistical tools to find out the dynamic on the market.
During the analysis stage, feedback from the stakeholder groups would be compared to determine areas of agreement as well as areas of divergence
