

Key Insights
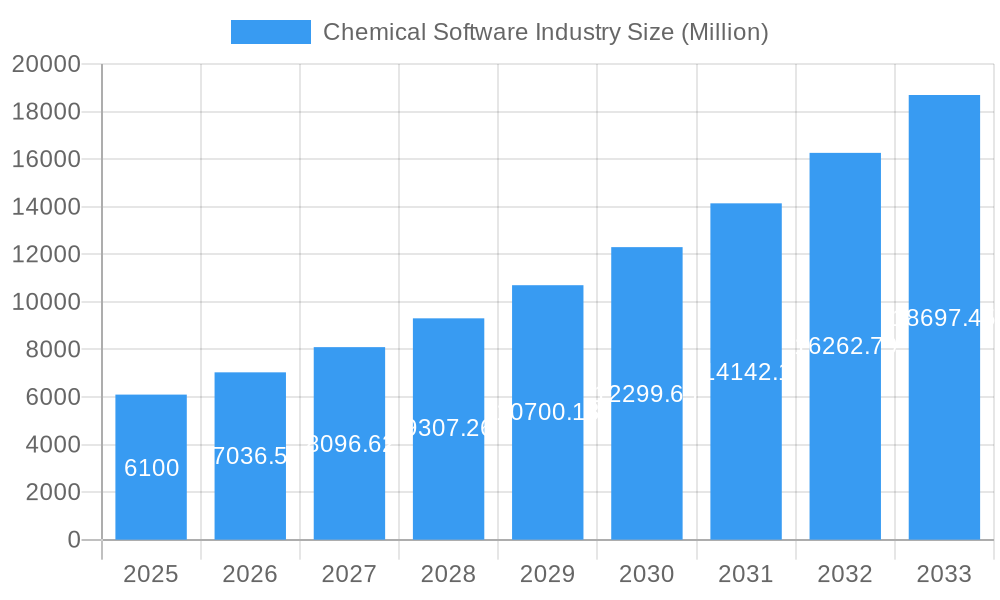
The Chemical Software market, valued at $6.10 billion in 2025, is projected to experience robust growth, exhibiting a Compound Annual Growth Rate (CAGR) of 15.50% from 2025 to 2033. This expansion is fueled by several key drivers. The increasing adoption of advanced computational methods in drug discovery and development is a significant factor, as virtual screening and molecular modeling software significantly reduce costs and accelerate the research process. Furthermore, the growing demand for efficient chemical analysis techniques across various industries, including pharmaceuticals, materials science, and environmental monitoring, is bolstering market growth. Stringent regulatory requirements for chemical safety and efficacy are also driving the adoption of sophisticated software solutions for compliance and data management. The market is segmented by application, with drug discovery and validation, virtual screening, and other chemical analysis applications representing substantial portions. Leading players like Chemaxon, BioSolveIT, and Schrödinger are actively innovating, introducing new features, and expanding their product portfolios to maintain a competitive edge. Geographic expansion, particularly in rapidly developing economies within Asia Pacific, presents lucrative opportunities for growth. While data scarcity for specific regional breakdowns remains, the strong global CAGR suggests balanced growth across North America, Europe, and the Asia-Pacific region. However, potential restraints could include high initial investment costs for sophisticated software and the need for specialized expertise to operate these tools effectively.
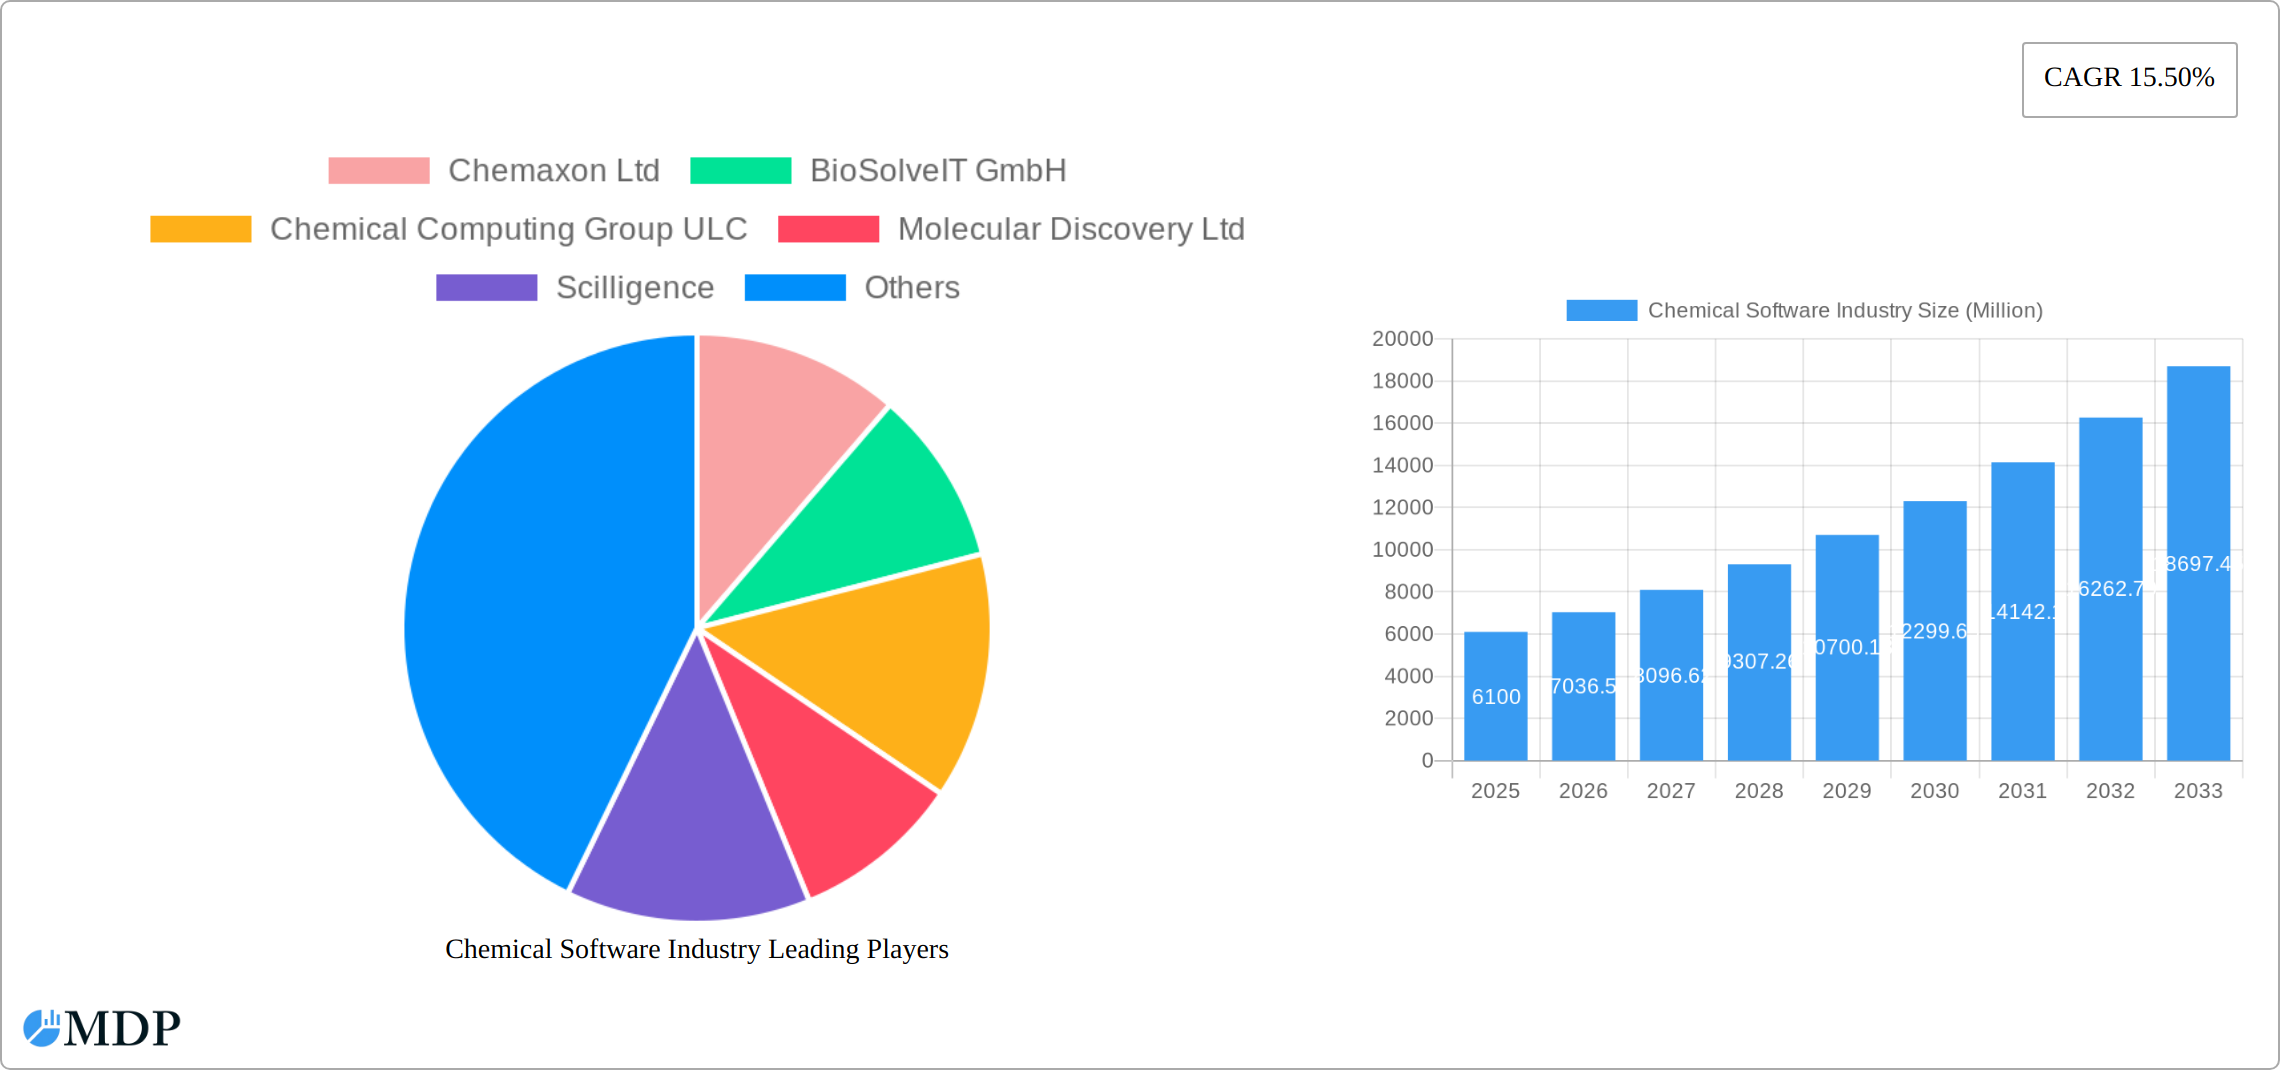
Chemical Software Industry Market Size (In Billion)
The market's future trajectory indicates continued expansion driven by ongoing advancements in artificial intelligence (AI) and machine learning (ML) integration within chemical software. AI-powered predictive modeling and automation capabilities will further enhance efficiency and accelerate research cycles in drug discovery and materials science. The rise of cloud-based solutions also promises greater accessibility and scalability, enabling smaller companies and research institutions to leverage advanced computational tools. However, the market must navigate challenges related to data security and integration, especially as the volume of chemical data generated continues to expand exponentially. Continuous investment in research and development, strategic partnerships, and collaborations will be crucial for companies to maintain market competitiveness and capture a larger share of this growing market.
Chemical Software Industry Company Market Share
Chemical Software Industry Market Report: 2019-2033 Forecast
Unlocking Growth in the Multi-Million Dollar Chemical Software Market: A Comprehensive Analysis (2019-2033)
This comprehensive report provides an in-depth analysis of the Chemical Software industry, projecting a market value exceeding $XX Million by 2033. We explore market dynamics, leading players, technological advancements, and future growth opportunities, offering actionable insights for stakeholders across the value chain. The report covers the period 2019-2033, with a base year of 2025 and a forecast period of 2025-2033. This detailed analysis utilizes data from the historical period (2019-2024) and current market trends to provide robust projections. Key segments analyzed include Chemical Analysis, Drug Discovery and Validation, Virtual Screening, and Other Applications. Leading companies like Chemaxon Ltd, BioSolveIT GmbH, and Schrödinger Inc. are profiled, highlighting their strategies and market positions.
Chemical Software Industry Market Dynamics & Concentration
The Chemical Software industry is characterized by a moderately concentrated market, with a few key players holding significant market share. In 2025, the top 5 companies are estimated to hold approximately XX% of the market. Innovation is a key driver, fueled by advancements in AI, machine learning, and high-performance computing. Stringent regulatory frameworks, particularly in the pharmaceutical sector, influence software development and adoption. Product substitutes, including manual methods and simpler software solutions, exist but are often less efficient and accurate. End-user trends reveal a growing preference for cloud-based solutions and integrated platforms offering enhanced data analysis and visualization capabilities. Mergers and acquisitions (M&A) activity has been moderate over the past few years, with an estimated XX M&A deals in the period 2019-2024.
- Market Concentration: Top 5 players holding approximately XX% market share (2025).
- Innovation Drivers: AI, Machine Learning, High-Performance Computing.
- Regulatory Frameworks: Stringent regulations in pharmaceutical and related industries.
- Product Substitutes: Manual methods, simpler software alternatives.
- End-User Trends: Increasing preference for cloud-based solutions and integrated platforms.
- M&A Activity: Approximately XX deals between 2019 and 2024.
Chemical Software Industry Industry Trends & Analysis
The Chemical Software market is experiencing dynamic growth, propelled by heightened demand from the pharmaceutical, biotechnology, and advanced chemical manufacturing sectors. This expansion is reflected in a projected Compound Annual Growth Rate (CAGR) of approximately 12-15% during the forecast period of 2025-2033. The escalating adoption of sophisticated computational chemistry techniques for accelerating drug discovery, pioneering materials science, and optimizing complex chemical processes is a primary growth driver. Furthermore, disruptive technological advancements, particularly the seamless integration of Artificial Intelligence (AI) and Machine Learning (ML) into chemical software workflows, are acting as significant catalysts for innovation and efficiency gains. Consumer and industry preferences are increasingly leaning towards intuitive user interfaces, highly scalable and flexible solutions, and robust, advanced data analytics capabilities for deeper insights. The competitive landscape is characterized by a relentless pace of product innovation, strategic collaborations and acquisitions, and strategic expansion into nascent and high-growth markets. The penetration of cutting-edge chemical software solutions is steadily rising across a diverse range of industries, with notable acceleration observed in regions demonstrating substantial investments in research and development.
Leading Markets & Segments in Chemical Software Industry
The North American region currently dominates the chemical software market, driven by robust R&D spending in the pharmaceutical and biotechnology sectors and a well-established IT infrastructure. Within applications, Drug Discovery and Validation is the largest segment, accounting for approximately XX% of the total market in 2025. This is attributed to the increasing reliance on computational methods in early-stage drug development. Virtual Screening is also experiencing rapid growth due to its ability to accelerate lead identification.
- North America Dominance: Driven by strong R&D investment and advanced IT infrastructure.
- Drug Discovery and Validation: Largest segment, accounting for approximately XX% of the market in 2025.
- Virtual Screening: Rapid growth due to its ability to accelerate lead identification.
- Key Drivers: High R&D expenditure, favorable regulatory environment, skilled workforce.
Chemical Software Industry Product Developments
Recent product developments in the chemical software arena are heavily focused on embedding advanced algorithmic architectures, sophisticated AI/ML capabilities, and highly intuitive visualization tools. These innovations are specifically designed to elevate the efficiency, precision, and predictive power of chemical simulations, analyses, and modeling. A notable trend is the emergence of novel software platforms that offer seamless, bi-directional integration with existing Laboratory Information Management Systems (LIMS) and Electronic Laboratory Notebooks (ELNs). These advancements are critical in addressing the escalating industry demand for streamlined, end-to-end workflows and robust data-driven decision-making across a multitude of chemical applications. The market is also witnessing a pronounced shift towards the widespread adoption of cloud-based solutions, which provide unparalleled scalability, cost-effectiveness, and on-demand access to substantial computational resources, democratizing advanced capabilities.
Key Drivers of Chemical Software Industry Growth
Several factors are driving the growth of the chemical software industry. Firstly, the increasing need for efficient and cost-effective drug discovery and development is a major catalyst. Secondly, the growing adoption of computational techniques across various chemical applications is boosting market expansion. Finally, government initiatives promoting research and development in chemistry and related fields further accelerate industry growth. For instance, the NIGMS program for AI-based chemical identification (June 2023) highlights the growing importance of technology in this field.
Challenges in the Chemical Software Industry Market
The Chemical Software industry faces challenges such as the high cost of software licenses and implementation, the need for specialized expertise to operate these complex platforms, and the integration of different software systems within laboratories. The competitive landscape also presents a challenge, with companies constantly striving to improve their offerings and win market share. Regulatory changes and compliance requirements can also impact the development and adoption of chemical software. These factors collectively may constrain market growth to some extent.
Emerging Opportunities in Chemical Software Industry
The Chemical Software market is exceptionally well-positioned for substantial and sustained long-term growth, largely fueled by ongoing breakthroughs in transformative technologies such as AI, advanced machine learning, and the burgeoning field of quantum computing. Strategic alliances and partnerships formed between innovative software developers and leading pharmaceutical and chemical companies are proving instrumental in accelerating the pace of innovation and fostering the widespread adoption of next-generation chemical software solutions. Furthermore, strategic expansion into emerging markets, particularly those in developing economies exhibiting robust growth in their R&D infrastructure and scientific endeavors, presents a significant avenue for opportunity. The expanding application of chemical software in pioneering and critical fields like sustainable chemistry, advanced materials design, and green chemical processes represents another key frontier for substantial market growth and impact.
Leading Players in the Chemical Software Industry Sector
- Chemaxon Ltd
- BioSolveIT GmbH
- Chemical Computing Group ULC
- Molecular Discovery Ltd
- Scilligence
- Collaborative Drug Discovery Inc
- Jubilant Biosys Ltd
- Cadence Design Systems Inc (OpenEye Scientific Software Inc)
- Schrödinger Inc
- Dassault Systemes
Key Milestones in Chemical Software Industry Industry
- October 2023: Cadence Molecular Sciences (OpenEye) announced an extended agreement with Pfizer Inc. for access to its molecular design software. This highlights the increasing reliance on advanced computational tools in drug discovery.
- June 2023: Vox Biomedical received funding from NIGMS to develop an AI-based chemical identification library using GC-DMS. This signifies the growing importance of AI in chemical analysis.
Strategic Outlook for Chemical Software Industry Market
The future trajectory of the Chemical Software industry is exceptionally promising, characterized by significant growth potential underpinned by continuous technological innovation and the expanding applicability of these solutions across a wide spectrum of scientific and industrial sectors. Strategic partnerships will continue to be a cornerstone, particularly those focused on achieving seamless integration of chemical software with other critical laboratory technologies and sophisticated data management systems, thereby accelerating market penetration and user adoption. The ongoing development and refinement of highly intuitive user interfaces, coupled with the pervasive availability of robust cloud-based solutions, will further democratize access and enhance the overall usability and adoption rates within the industry. Strategic expansion into new geographic markets with burgeoning R&D capabilities and the diversification into nascent and high-impact application areas are anticipated to be crucial contributors to sustained long-term growth and market leadership within this dynamic industry.
Chemical Software Industry Segmentation
-
1. Application
-
1.1. Chemical Analysis
- 1.1.1. Chemical Databases
- 1.1.2. Chemometrics
- 1.1.3. Molecular Modelling
- 1.1.4. Other Chemical Analysis
- 1.2. Drug Discovery and Validation
- 1.3. Virtual Screening
- 1.4. Other Applications
-
1.1. Chemical Analysis
Chemical Software Industry Segmentation By Geography
-
1. North America
- 1.1. United States
- 1.2. Canada
- 1.3. Mexico
-
2. Europe
- 2.1. Germany
- 2.2. United Kingdom
- 2.3. France
- 2.4. Italy
- 2.5. Spain
- 2.6. Rest of Europe
-
3. Asia Pacific
- 3.1. China
- 3.2. Japan
- 3.3. India
- 3.4. Australia
- 3.5. South Korea
- 3.6. Rest of Asia Pacific
-
4. Middle East and Africa
- 4.1. GCC
- 4.2. South Africa
- 4.3. Rest of Middle East and Africa
-
5. South America
- 5.1. Brazil
- 5.2. Argentina
- 5.3. Rest of South America
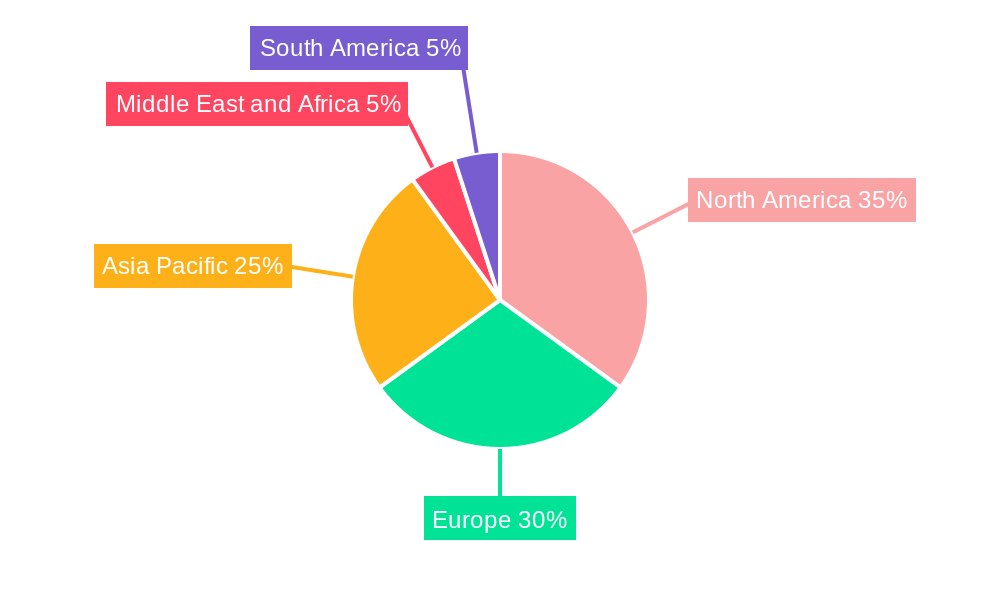
Chemical Software Industry Regional Market Share
Geographic Coverage of Chemical Software Industry
Chemical Software Industry REPORT HIGHLIGHTS
| Aspects | Details |
|---|---|
| Study Period | 2020-2034 |
| Base Year | 2025 |
| Estimated Year | 2026 |
| Forecast Period | 2026-2034 |
| Historical Period | 2020-2025 |
| Growth Rate | CAGR of 15.50% from 2020-2034 |
| Segmentation |
|
Table of Contents
- 1. Introduction
- 1.1. Research Scope
- 1.2. Market Segmentation
- 1.3. Research Methodology
- 1.4. Definitions and Assumptions
- 2. Executive Summary
- 2.1. Introduction
- 3. Market Dynamics
- 3.1. Introduction
- 3.2. Market Drivers
- 3.2.1. Innovations and Advancements in the Drug Development Process; Increased Demand of Personalized Medicine
- 3.3. Market Restrains
- 3.3.1. Lack of Skilled Labors
- 3.4. Market Trends
- 3.4.1. Virtual Screening Segment is Expected to Witness Growth in the Market Over the Forecast Period
- 4. Market Factor Analysis
- 4.1. Porters Five Forces
- 4.2. Supply/Value Chain
- 4.3. PESTEL analysis
- 4.4. Market Entropy
- 4.5. Patent/Trademark Analysis
- 5. Global Chemical Software Industry Analysis, Insights and Forecast, 2020-2032
- 5.1. Market Analysis, Insights and Forecast - by Application
- 5.1.1. Chemical Analysis
- 5.1.1.1. Chemical Databases
- 5.1.1.2. Chemometrics
- 5.1.1.3. Molecular Modelling
- 5.1.1.4. Other Chemical Analysis
- 5.1.2. Drug Discovery and Validation
- 5.1.3. Virtual Screening
- 5.1.4. Other Applications
- 5.1.1. Chemical Analysis
- 5.2. Market Analysis, Insights and Forecast - by Region
- 5.2.1. North America
- 5.2.2. Europe
- 5.2.3. Asia Pacific
- 5.2.4. Middle East and Africa
- 5.2.5. South America
- 5.1. Market Analysis, Insights and Forecast - by Application
- 6. North America Chemical Software Industry Analysis, Insights and Forecast, 2020-2032
- 6.1. Market Analysis, Insights and Forecast - by Application
- 6.1.1. Chemical Analysis
- 6.1.1.1. Chemical Databases
- 6.1.1.2. Chemometrics
- 6.1.1.3. Molecular Modelling
- 6.1.1.4. Other Chemical Analysis
- 6.1.2. Drug Discovery and Validation
- 6.1.3. Virtual Screening
- 6.1.4. Other Applications
- 6.1.1. Chemical Analysis
- 6.1. Market Analysis, Insights and Forecast - by Application
- 7. Europe Chemical Software Industry Analysis, Insights and Forecast, 2020-2032
- 7.1. Market Analysis, Insights and Forecast - by Application
- 7.1.1. Chemical Analysis
- 7.1.1.1. Chemical Databases
- 7.1.1.2. Chemometrics
- 7.1.1.3. Molecular Modelling
- 7.1.1.4. Other Chemical Analysis
- 7.1.2. Drug Discovery and Validation
- 7.1.3. Virtual Screening
- 7.1.4. Other Applications
- 7.1.1. Chemical Analysis
- 7.1. Market Analysis, Insights and Forecast - by Application
- 8. Asia Pacific Chemical Software Industry Analysis, Insights and Forecast, 2020-2032
- 8.1. Market Analysis, Insights and Forecast - by Application
- 8.1.1. Chemical Analysis
- 8.1.1.1. Chemical Databases
- 8.1.1.2. Chemometrics
- 8.1.1.3. Molecular Modelling
- 8.1.1.4. Other Chemical Analysis
- 8.1.2. Drug Discovery and Validation
- 8.1.3. Virtual Screening
- 8.1.4. Other Applications
- 8.1.1. Chemical Analysis
- 8.1. Market Analysis, Insights and Forecast - by Application
- 9. Middle East and Africa Chemical Software Industry Analysis, Insights and Forecast, 2020-2032
- 9.1. Market Analysis, Insights and Forecast - by Application
- 9.1.1. Chemical Analysis
- 9.1.1.1. Chemical Databases
- 9.1.1.2. Chemometrics
- 9.1.1.3. Molecular Modelling
- 9.1.1.4. Other Chemical Analysis
- 9.1.2. Drug Discovery and Validation
- 9.1.3. Virtual Screening
- 9.1.4. Other Applications
- 9.1.1. Chemical Analysis
- 9.1. Market Analysis, Insights and Forecast - by Application
- 10. South America Chemical Software Industry Analysis, Insights and Forecast, 2020-2032
- 10.1. Market Analysis, Insights and Forecast - by Application
- 10.1.1. Chemical Analysis
- 10.1.1.1. Chemical Databases
- 10.1.1.2. Chemometrics
- 10.1.1.3. Molecular Modelling
- 10.1.1.4. Other Chemical Analysis
- 10.1.2. Drug Discovery and Validation
- 10.1.3. Virtual Screening
- 10.1.4. Other Applications
- 10.1.1. Chemical Analysis
- 10.1. Market Analysis, Insights and Forecast - by Application
- 11. Competitive Analysis
- 11.1. Global Market Share Analysis 2025
- 11.2. Company Profiles
- 11.2.1 Chemaxon Ltd
- 11.2.1.1. Overview
- 11.2.1.2. Products
- 11.2.1.3. SWOT Analysis
- 11.2.1.4. Recent Developments
- 11.2.1.5. Financials (Based on Availability)
- 11.2.2 BioSolveIT GmbH
- 11.2.2.1. Overview
- 11.2.2.2. Products
- 11.2.2.3. SWOT Analysis
- 11.2.2.4. Recent Developments
- 11.2.2.5. Financials (Based on Availability)
- 11.2.3 Chemical Computing Group ULC
- 11.2.3.1. Overview
- 11.2.3.2. Products
- 11.2.3.3. SWOT Analysis
- 11.2.3.4. Recent Developments
- 11.2.3.5. Financials (Based on Availability)
- 11.2.4 Molecular Discovery Ltd
- 11.2.4.1. Overview
- 11.2.4.2. Products
- 11.2.4.3. SWOT Analysis
- 11.2.4.4. Recent Developments
- 11.2.4.5. Financials (Based on Availability)
- 11.2.5 Scilligence
- 11.2.5.1. Overview
- 11.2.5.2. Products
- 11.2.5.3. SWOT Analysis
- 11.2.5.4. Recent Developments
- 11.2.5.5. Financials (Based on Availability)
- 11.2.6 Collaborative Drug Discovery Inc
- 11.2.6.1. Overview
- 11.2.6.2. Products
- 11.2.6.3. SWOT Analysis
- 11.2.6.4. Recent Developments
- 11.2.6.5. Financials (Based on Availability)
- 11.2.7 Jubilant Biosys Ltd
- 11.2.7.1. Overview
- 11.2.7.2. Products
- 11.2.7.3. SWOT Analysis
- 11.2.7.4. Recent Developments
- 11.2.7.5. Financials (Based on Availability)
- 11.2.8 Cadence Design Systems Inc (OpenEye Scientific Software Inc )
- 11.2.8.1. Overview
- 11.2.8.2. Products
- 11.2.8.3. SWOT Analysis
- 11.2.8.4. Recent Developments
- 11.2.8.5. Financials (Based on Availability)
- 11.2.9 Schrödinger Inc
- 11.2.9.1. Overview
- 11.2.9.2. Products
- 11.2.9.3. SWOT Analysis
- 11.2.9.4. Recent Developments
- 11.2.9.5. Financials (Based on Availability)
- 11.2.10 Dassault Systemes
- 11.2.10.1. Overview
- 11.2.10.2. Products
- 11.2.10.3. SWOT Analysis
- 11.2.10.4. Recent Developments
- 11.2.10.5. Financials (Based on Availability)
- 11.2.1 Chemaxon Ltd
List of Figures
- Figure 1: Global Chemical Software Industry Revenue Breakdown (Million, %) by Region 2025 & 2033
- Figure 2: North America Chemical Software Industry Revenue (Million), by Application 2025 & 2033
- Figure 3: North America Chemical Software Industry Revenue Share (%), by Application 2025 & 2033
- Figure 4: North America Chemical Software Industry Revenue (Million), by Country 2025 & 2033
- Figure 5: North America Chemical Software Industry Revenue Share (%), by Country 2025 & 2033
- Figure 6: Europe Chemical Software Industry Revenue (Million), by Application 2025 & 2033
- Figure 7: Europe Chemical Software Industry Revenue Share (%), by Application 2025 & 2033
- Figure 8: Europe Chemical Software Industry Revenue (Million), by Country 2025 & 2033
- Figure 9: Europe Chemical Software Industry Revenue Share (%), by Country 2025 & 2033
- Figure 10: Asia Pacific Chemical Software Industry Revenue (Million), by Application 2025 & 2033
- Figure 11: Asia Pacific Chemical Software Industry Revenue Share (%), by Application 2025 & 2033
- Figure 12: Asia Pacific Chemical Software Industry Revenue (Million), by Country 2025 & 2033
- Figure 13: Asia Pacific Chemical Software Industry Revenue Share (%), by Country 2025 & 2033
- Figure 14: Middle East and Africa Chemical Software Industry Revenue (Million), by Application 2025 & 2033
- Figure 15: Middle East and Africa Chemical Software Industry Revenue Share (%), by Application 2025 & 2033
- Figure 16: Middle East and Africa Chemical Software Industry Revenue (Million), by Country 2025 & 2033
- Figure 17: Middle East and Africa Chemical Software Industry Revenue Share (%), by Country 2025 & 2033
- Figure 18: South America Chemical Software Industry Revenue (Million), by Application 2025 & 2033
- Figure 19: South America Chemical Software Industry Revenue Share (%), by Application 2025 & 2033
- Figure 20: South America Chemical Software Industry Revenue (Million), by Country 2025 & 2033
- Figure 21: South America Chemical Software Industry Revenue Share (%), by Country 2025 & 2033
List of Tables
- Table 1: Global Chemical Software Industry Revenue Million Forecast, by Application 2020 & 2033
- Table 2: Global Chemical Software Industry Revenue Million Forecast, by Region 2020 & 2033
- Table 3: Global Chemical Software Industry Revenue Million Forecast, by Application 2020 & 2033
- Table 4: Global Chemical Software Industry Revenue Million Forecast, by Country 2020 & 2033
- Table 5: United States Chemical Software Industry Revenue (Million) Forecast, by Application 2020 & 2033
- Table 6: Canada Chemical Software Industry Revenue (Million) Forecast, by Application 2020 & 2033
- Table 7: Mexico Chemical Software Industry Revenue (Million) Forecast, by Application 2020 & 2033
- Table 8: Global Chemical Software Industry Revenue Million Forecast, by Application 2020 & 2033
- Table 9: Global Chemical Software Industry Revenue Million Forecast, by Country 2020 & 2033
- Table 10: Germany Chemical Software Industry Revenue (Million) Forecast, by Application 2020 & 2033
- Table 11: United Kingdom Chemical Software Industry Revenue (Million) Forecast, by Application 2020 & 2033
- Table 12: France Chemical Software Industry Revenue (Million) Forecast, by Application 2020 & 2033
- Table 13: Italy Chemical Software Industry Revenue (Million) Forecast, by Application 2020 & 2033
- Table 14: Spain Chemical Software Industry Revenue (Million) Forecast, by Application 2020 & 2033
- Table 15: Rest of Europe Chemical Software Industry Revenue (Million) Forecast, by Application 2020 & 2033
- Table 16: Global Chemical Software Industry Revenue Million Forecast, by Application 2020 & 2033
- Table 17: Global Chemical Software Industry Revenue Million Forecast, by Country 2020 & 2033
- Table 18: China Chemical Software Industry Revenue (Million) Forecast, by Application 2020 & 2033
- Table 19: Japan Chemical Software Industry Revenue (Million) Forecast, by Application 2020 & 2033
- Table 20: India Chemical Software Industry Revenue (Million) Forecast, by Application 2020 & 2033
- Table 21: Australia Chemical Software Industry Revenue (Million) Forecast, by Application 2020 & 2033
- Table 22: South Korea Chemical Software Industry Revenue (Million) Forecast, by Application 2020 & 2033
- Table 23: Rest of Asia Pacific Chemical Software Industry Revenue (Million) Forecast, by Application 2020 & 2033
- Table 24: Global Chemical Software Industry Revenue Million Forecast, by Application 2020 & 2033
- Table 25: Global Chemical Software Industry Revenue Million Forecast, by Country 2020 & 2033
- Table 26: GCC Chemical Software Industry Revenue (Million) Forecast, by Application 2020 & 2033
- Table 27: South Africa Chemical Software Industry Revenue (Million) Forecast, by Application 2020 & 2033
- Table 28: Rest of Middle East and Africa Chemical Software Industry Revenue (Million) Forecast, by Application 2020 & 2033
- Table 29: Global Chemical Software Industry Revenue Million Forecast, by Application 2020 & 2033
- Table 30: Global Chemical Software Industry Revenue Million Forecast, by Country 2020 & 2033
- Table 31: Brazil Chemical Software Industry Revenue (Million) Forecast, by Application 2020 & 2033
- Table 32: Argentina Chemical Software Industry Revenue (Million) Forecast, by Application 2020 & 2033
- Table 33: Rest of South America Chemical Software Industry Revenue (Million) Forecast, by Application 2020 & 2033
Frequently Asked Questions
1. What is the projected Compound Annual Growth Rate (CAGR) of the Chemical Software Industry?
The projected CAGR is approximately 15.50%.
2. Which companies are prominent players in the Chemical Software Industry?
Key companies in the market include Chemaxon Ltd, BioSolveIT GmbH, Chemical Computing Group ULC, Molecular Discovery Ltd, Scilligence, Collaborative Drug Discovery Inc, Jubilant Biosys Ltd, Cadence Design Systems Inc (OpenEye Scientific Software Inc ), Schrödinger Inc, Dassault Systemes.
3. What are the main segments of the Chemical Software Industry?
The market segments include Application.
4. Can you provide details about the market size?
The market size is estimated to be USD 6.10 Million as of 2022.
5. What are some drivers contributing to market growth?
Innovations and Advancements in the Drug Development Process; Increased Demand of Personalized Medicine.
6. What are the notable trends driving market growth?
Virtual Screening Segment is Expected to Witness Growth in the Market Over the Forecast Period.
7. Are there any restraints impacting market growth?
Lack of Skilled Labors.
8. Can you provide examples of recent developments in the market?
In October 2023, Cadence Molecular Sciences (OpenEye) announced that Pfizer Inc. has signed an agreement to extend and expand access to Cadence products and programming toolkits for advanced molecular design. Cadence Molecular Sciences’ physics-and AI-based modelling and cheminformatics computational software is an enabler of early-stage drug discovery innovation.
9. What pricing options are available for accessing the report?
Pricing options include single-user, multi-user, and enterprise licenses priced at USD 4750, USD 5250, and USD 8750 respectively.
10. Is the market size provided in terms of value or volume?
The market size is provided in terms of value, measured in Million.
11. Are there any specific market keywords associated with the report?
Yes, the market keyword associated with the report is "Chemical Software Industry," which aids in identifying and referencing the specific market segment covered.
12. How do I determine which pricing option suits my needs best?
The pricing options vary based on user requirements and access needs. Individual users may opt for single-user licenses, while businesses requiring broader access may choose multi-user or enterprise licenses for cost-effective access to the report.
13. Are there any additional resources or data provided in the Chemical Software Industry report?
While the report offers comprehensive insights, it's advisable to review the specific contents or supplementary materials provided to ascertain if additional resources or data are available.
14. How can I stay updated on further developments or reports in the Chemical Software Industry?
To stay informed about further developments, trends, and reports in the Chemical Software Industry, consider subscribing to industry newsletters, following relevant companies and organizations, or regularly checking reputable industry news sources and publications.
Methodology
Step 1 - Identification of Relevant Samples Size from Population Database


Step 2 - Approaches for Defining Global Market Size (Value, Volume* & Price*)

Note*: In applicable scenarios
Step 3 - Data Sources
Primary Research
- Web Analytics
- Survey Reports
- Research Institute
- Latest Research Reports
- Opinion Leaders
Secondary Research
- Annual Reports
- White Paper
- Latest Press Release
- Industry Association
- Paid Database
- Investor Presentations

Step 4 - Data Triangulation
Involves using different sources of information in order to increase the validity of a study
These sources are likely to be stakeholders in a program - participants, other researchers, program staff, other community members, and so on.
Then we put all data in single framework & apply various statistical tools to find out the dynamic on the market.
During the analysis stage, feedback from the stakeholder groups would be compared to determine areas of agreement as well as areas of divergence