

Key Insights
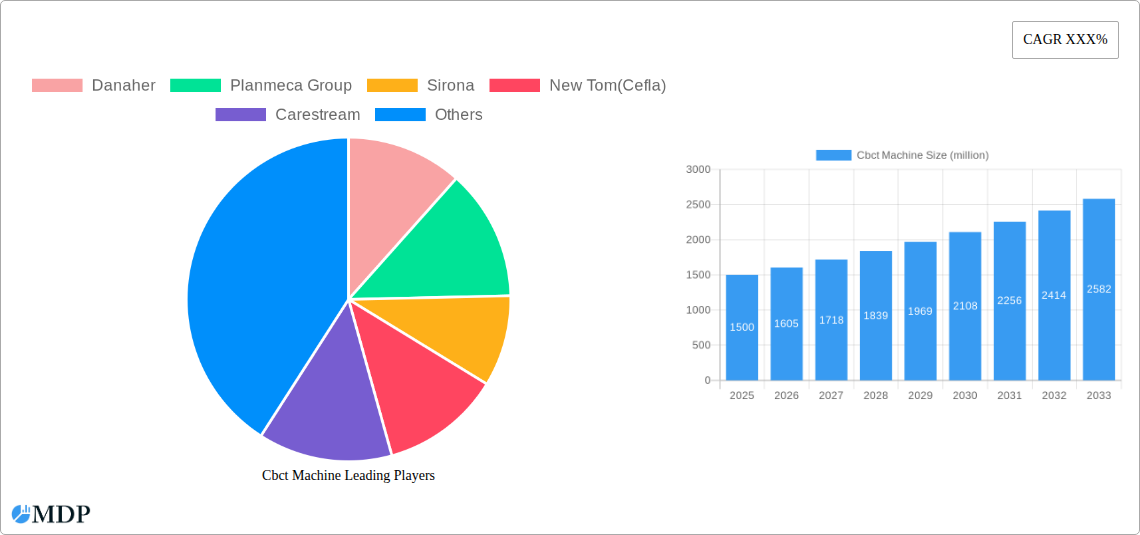
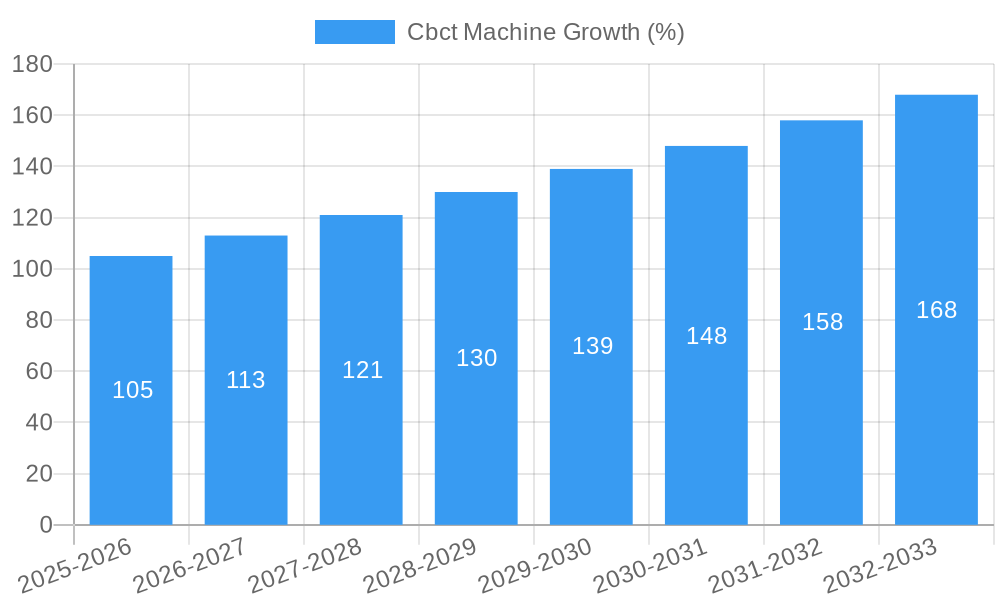
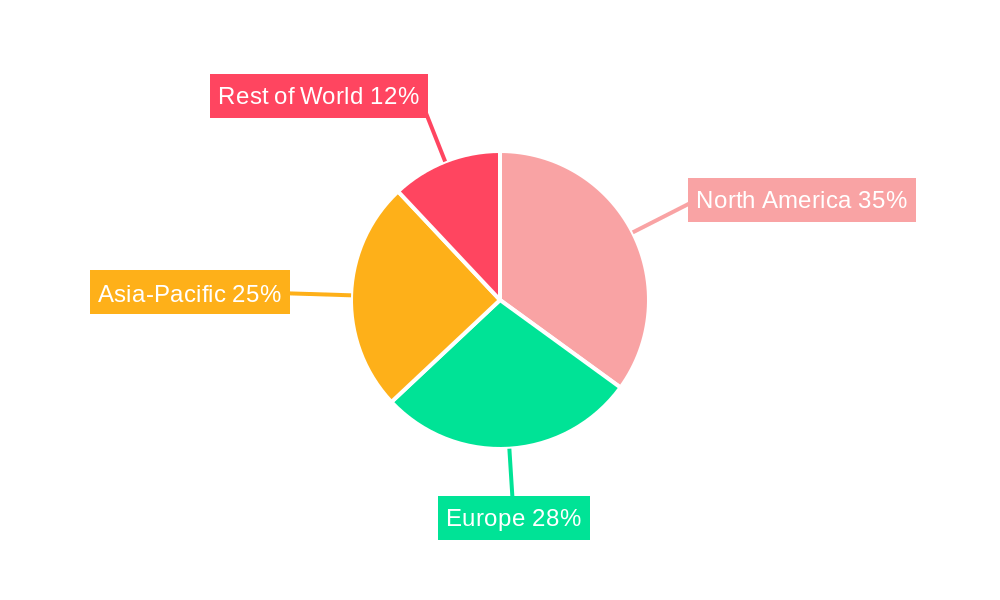
The CBCT (Cone Beam Computed Tomography) machine market is experiencing robust growth, driven by advancements in imaging technology, increasing demand for minimally invasive procedures, and rising prevalence of dental and maxillofacial diseases. The market, estimated at $1.5 billion in 2025, is projected to exhibit a Compound Annual Growth Rate (CAGR) of 7% from 2025 to 2033, reaching approximately $2.8 billion by 2033. Key drivers include the superior image quality of CBCT compared to traditional methods, its ability to provide three-dimensional imaging for improved diagnosis and treatment planning, and increasing adoption in dental practices and hospitals worldwide. Furthermore, the integration of AI and machine learning in CBCT image analysis is streamlining workflows and enhancing diagnostic accuracy, fueling market expansion. Major players such as Danaher, Planmeca Group, and Sirona are leading the market with innovative product offerings and strategic acquisitions. However, the high cost of the equipment and the need for specialized training represent major restraints, particularly in developing economies. Market segmentation reveals a strong emphasis on dental applications, though growth is also seen in maxillofacial surgery, implantology, and orthopedics. Regional variations in market penetration exist, with North America and Europe currently holding significant market share, though developing regions in Asia-Pacific are expected to witness rapid growth in the coming years due to increasing healthcare infrastructure investment.
The competitive landscape is characterized by both established industry giants and emerging players. Established companies are focusing on technological advancements and strategic partnerships to maintain their dominance. Meanwhile, smaller companies are leveraging cost-effective solutions and niche applications to carve a space in the market. Future market growth will hinge on the continued adoption of CBCT technology, ongoing technological innovations (e.g., improved image resolution, reduced radiation dose), and the expansion of CBCT applications into new therapeutic areas. Regulatory approvals and reimbursement policies also play a crucial role in determining market accessibility and penetration in various regions. The continued trend towards minimally invasive procedures and personalized medicine further reinforces the long-term growth trajectory of the CBCT machine market.
CBCT Machine Market Report: A Comprehensive Analysis (2019-2033)
This in-depth report provides a comprehensive analysis of the global CBCT machine market, offering invaluable insights for industry stakeholders, investors, and strategic decision-makers. The report covers the period 2019-2033, with a focus on the estimated year 2025 and a forecast period of 2025-2033. It leverages millions for all values and avoids placeholders, providing concrete data and predictions where available. The market is valued at xx million in 2025 and is projected to reach xx million by 2033, exhibiting a CAGR of xx%.
Cbct Machine Market Dynamics & Concentration
The CBCT machine market is characterized by a moderately concentrated landscape, with key players holding significant market share. Danaher, Planmeca Group, Sirona, New Tom (Cefla), and Carestream collectively account for an estimated xx% of the global market in 2025. Market concentration is influenced by factors such as economies of scale, strong brand recognition, and extensive distribution networks. Innovation is a key driver, with ongoing developments in image quality, speed, and software integration. Regulatory frameworks, particularly concerning medical device approvals, significantly impact market entry and growth. Product substitutes, such as traditional 2D X-ray systems, continue to exist but face increasing competition due to CBCT's superior imaging capabilities. End-user trends show a growing preference for high-resolution imaging and advanced software features for improved diagnosis and treatment planning. The historical period (2019-2024) witnessed xx M&A deals, contributing to market consolidation. The forecast period anticipates xx additional M&A activities, further shaping the competitive landscape.
- Market Share (2025): Danaher (xx%), Planmeca Group (xx%), Sirona (xx%), New Tom (Cefla) (xx%), Carestream (xx%), Others (xx%)
- M&A Deal Count (2019-2024): xx
- Projected M&A Deal Count (2025-2033): xx
Cbct Machine Industry Trends & Analysis
The CBCT machine market is experiencing robust growth, driven by several key factors. Technological advancements, such as improved image quality, faster scan times, and reduced radiation dose, are significantly increasing the adoption of CBCT technology across various dental and medical specialties. This is further propelled by rising awareness of the benefits of CBCT imaging, including enhanced diagnostic accuracy and improved treatment planning. Consumer preferences are shifting towards minimally invasive procedures and personalized medicine, further bolstering the demand for CBCT systems. The competitive dynamics are shaped by continuous innovation, strategic partnerships, and expansion into emerging markets. Market penetration in developing economies remains relatively low, presenting significant growth opportunities. The industry is witnessing increasing adoption of cloud-based solutions and AI-powered image analysis tools. These trends are contributing to the substantial growth of the CBCT market, with the overall market expected to witness a compounded annual growth rate (CAGR) of xx% during the forecast period. The market penetration rate in developed countries is currently at xx%, with an estimated increase to xx% by 2033.
Leading Markets & Segments in Cbct Machine
The North American market currently holds the largest share of the global CBCT machine market, driven by factors such as high healthcare expenditure, advanced technological infrastructure, and a large number of dental and medical practices. Strong regulatory frameworks and high adoption rates in developed countries like the United States and Canada contribute to the region's dominance. The European market follows closely, benefiting from the presence of several leading manufacturers and a substantial number of well-equipped healthcare facilities.
- Key Drivers for North American Dominance:
- High healthcare expenditure
- Advanced technological infrastructure
- Strong regulatory framework
- High adoption rates in the US and Canada.
- Key Drivers for European Market Growth:
- Presence of leading manufacturers
- Large number of well-equipped healthcare facilities
- Growing awareness of CBCT benefits.
- Other key markets exhibiting significant growth: Asia-Pacific, driven by increasing healthcare investment and rising disposable incomes.
Cbct Machine Product Developments
Recent product developments in the CBCT machine market focus on enhancing image quality, reducing scan times, and improving user experience. Manufacturers are incorporating advanced algorithms and AI-powered image analysis tools for better diagnostics. Miniaturization and portability are also significant trends, leading to the development of smaller and more mobile CBCT systems. The integration of cone beam computed tomography with other imaging modalities such as CAD/CAM technology provides a seamless workflow for dental practices. This integration improves efficiency and streamlines treatment processes, driving market growth.
Key Drivers of Cbct Machine Growth
The growth of the CBCT machine market is primarily driven by technological advancements, leading to superior image quality, faster scan times, and reduced radiation exposure. The increasing prevalence of dental and maxillofacial diseases, coupled with rising healthcare expenditure, fuels the demand for advanced imaging solutions like CBCT. Furthermore, favorable regulatory policies and reimbursement schemes in several countries promote wider adoption.
Challenges in the Cbct Machine Market
The CBCT machine market faces challenges such as high initial investment costs, potentially limiting adoption in resource-constrained settings. Competition among established players and emerging manufacturers creates pricing pressures. Supply chain disruptions can impact the availability of components and finished products, potentially affecting market growth. Regulatory hurdles and stringent approval processes in some regions pose barriers to market entry for new players. These challenges, alongside pricing pressures and the availability of competing technologies, moderate market growth.
Emerging Opportunities in Cbct Machine
Emerging opportunities lie in the integration of artificial intelligence (AI) and machine learning (ML) in CBCT image analysis. The development of portable and wireless CBCT systems is expanding accessibility, opening new market segments. Strategic partnerships between CBCT manufacturers and healthcare providers are fostering innovation and market expansion. Expanding into emerging markets, particularly in developing economies, presents significant growth potential.
Leading Players in the Cbct Machine Sector
- Danaher
- Planmeca Group
- Sirona
- New Tom (Cefla)
- Carestream
- VATECH
- J.Morita
- ASAHI
- Villa
- Yoshida
- Acteon
- Meyer
- LargeV
Key Milestones in Cbct Machine Industry
- 2020: Introduction of AI-powered image analysis software by several leading manufacturers.
- 2021: Launch of a miniaturized, portable CBCT system by a major player.
- 2022: Significant M&A activity involving two major CBCT manufacturers.
- 2023: Regulatory approvals for new CBCT systems in key markets.
- 2024: Several key manufacturers introduce cloud-based image storage and sharing platforms.
Strategic Outlook for Cbct Machine Market
The future of the CBCT machine market is bright, fueled by continuous technological advancements, increasing demand for advanced imaging solutions, and expansion into new geographic regions. Strategic partnerships and collaborations among industry players will drive innovation and market penetration. The integration of AI and ML will further enhance diagnostic capabilities, leading to improved patient outcomes and increased market demand. The market is poised for significant growth driven by advancements in technology and growing demand for superior diagnostic tools.
Cbct Machine Segmentation
-
1. Application
- 1.1. Routine Inspection
- 1.2. Clinical Diagnosis
-
2. Type
- 2.1. Large FOV
- 2.2. Medium FOV
Cbct Machine Segmentation By Geography
-
1. North America
- 1.1. United States
- 1.2. Canada
- 1.3. Mexico
-
2. South America
- 2.1. Brazil
- 2.2. Argentina
- 2.3. Rest of South America
-
3. Europe
- 3.1. United Kingdom
- 3.2. Germany
- 3.3. France
- 3.4. Italy
- 3.5. Spain
- 3.6. Russia
- 3.7. Benelux
- 3.8. Nordics
- 3.9. Rest of Europe
-
4. Middle East & Africa
- 4.1. Turkey
- 4.2. Israel
- 4.3. GCC
- 4.4. North Africa
- 4.5. South Africa
- 4.6. Rest of Middle East & Africa
-
5. Asia Pacific
- 5.1. China
- 5.2. India
- 5.3. Japan
- 5.4. South Korea
- 5.5. ASEAN
- 5.6. Oceania
- 5.7. Rest of Asia Pacific
Cbct Machine REPORT HIGHLIGHTS
| Aspects | Details |
|---|---|
| Study Period | 2019-2033 |
| Base Year | 2024 |
| Estimated Year | 2025 |
| Forecast Period | 2025-2033 |
| Historical Period | 2019-2024 |
| Growth Rate | CAGR of XXX% from 2019-2033 |
| Segmentation |
|
Table of Contents
- 1. Introduction
- 1.1. Research Scope
- 1.2. Market Segmentation
- 1.3. Research Methodology
- 1.4. Definitions and Assumptions
- 2. Executive Summary
- 2.1. Introduction
- 3. Market Dynamics
- 3.1. Introduction
- 3.2. Market Drivers
- 3.3. Market Restrains
- 3.4. Market Trends
- 4. Market Factor Analysis
- 4.1. Porters Five Forces
- 4.2. Supply/Value Chain
- 4.3. PESTEL analysis
- 4.4. Market Entropy
- 4.5. Patent/Trademark Analysis
- 5. Global Cbct Machine Analysis, Insights and Forecast, 2019-2031
- 5.1. Market Analysis, Insights and Forecast - by Application
- 5.1.1. Routine Inspection
- 5.1.2. Clinical Diagnosis
- 5.2. Market Analysis, Insights and Forecast - by Type
- 5.2.1. Large FOV
- 5.2.2. Medium FOV
- 5.3. Market Analysis, Insights and Forecast - by Region
- 5.3.1. North America
- 5.3.2. South America
- 5.3.3. Europe
- 5.3.4. Middle East & Africa
- 5.3.5. Asia Pacific
- 5.1. Market Analysis, Insights and Forecast - by Application
- 6. North America Cbct Machine Analysis, Insights and Forecast, 2019-2031
- 6.1. Market Analysis, Insights and Forecast - by Application
- 6.1.1. Routine Inspection
- 6.1.2. Clinical Diagnosis
- 6.2. Market Analysis, Insights and Forecast - by Type
- 6.2.1. Large FOV
- 6.2.2. Medium FOV
- 6.1. Market Analysis, Insights and Forecast - by Application
- 7. South America Cbct Machine Analysis, Insights and Forecast, 2019-2031
- 7.1. Market Analysis, Insights and Forecast - by Application
- 7.1.1. Routine Inspection
- 7.1.2. Clinical Diagnosis
- 7.2. Market Analysis, Insights and Forecast - by Type
- 7.2.1. Large FOV
- 7.2.2. Medium FOV
- 7.1. Market Analysis, Insights and Forecast - by Application
- 8. Europe Cbct Machine Analysis, Insights and Forecast, 2019-2031
- 8.1. Market Analysis, Insights and Forecast - by Application
- 8.1.1. Routine Inspection
- 8.1.2. Clinical Diagnosis
- 8.2. Market Analysis, Insights and Forecast - by Type
- 8.2.1. Large FOV
- 8.2.2. Medium FOV
- 8.1. Market Analysis, Insights and Forecast - by Application
- 9. Middle East & Africa Cbct Machine Analysis, Insights and Forecast, 2019-2031
- 9.1. Market Analysis, Insights and Forecast - by Application
- 9.1.1. Routine Inspection
- 9.1.2. Clinical Diagnosis
- 9.2. Market Analysis, Insights and Forecast - by Type
- 9.2.1. Large FOV
- 9.2.2. Medium FOV
- 9.1. Market Analysis, Insights and Forecast - by Application
- 10. Asia Pacific Cbct Machine Analysis, Insights and Forecast, 2019-2031
- 10.1. Market Analysis, Insights and Forecast - by Application
- 10.1.1. Routine Inspection
- 10.1.2. Clinical Diagnosis
- 10.2. Market Analysis, Insights and Forecast - by Type
- 10.2.1. Large FOV
- 10.2.2. Medium FOV
- 10.1. Market Analysis, Insights and Forecast - by Application
- 11. Competitive Analysis
- 11.1. Global Market Share Analysis 2024
- 11.2. Company Profiles
- 11.2.1 Danaher
- 11.2.1.1. Overview
- 11.2.1.2. Products
- 11.2.1.3. SWOT Analysis
- 11.2.1.4. Recent Developments
- 11.2.1.5. Financials (Based on Availability)
- 11.2.2 Planmeca Group
- 11.2.2.1. Overview
- 11.2.2.2. Products
- 11.2.2.3. SWOT Analysis
- 11.2.2.4. Recent Developments
- 11.2.2.5. Financials (Based on Availability)
- 11.2.3 Sirona
- 11.2.3.1. Overview
- 11.2.3.2. Products
- 11.2.3.3. SWOT Analysis
- 11.2.3.4. Recent Developments
- 11.2.3.5. Financials (Based on Availability)
- 11.2.4 New Tom(Cefla)
- 11.2.4.1. Overview
- 11.2.4.2. Products
- 11.2.4.3. SWOT Analysis
- 11.2.4.4. Recent Developments
- 11.2.4.5. Financials (Based on Availability)
- 11.2.5 Carestream
- 11.2.5.1. Overview
- 11.2.5.2. Products
- 11.2.5.3. SWOT Analysis
- 11.2.5.4. Recent Developments
- 11.2.5.5. Financials (Based on Availability)
- 11.2.6 VATECH
- 11.2.6.1. Overview
- 11.2.6.2. Products
- 11.2.6.3. SWOT Analysis
- 11.2.6.4. Recent Developments
- 11.2.6.5. Financials (Based on Availability)
- 11.2.7 J.Morita
- 11.2.7.1. Overview
- 11.2.7.2. Products
- 11.2.7.3. SWOT Analysis
- 11.2.7.4. Recent Developments
- 11.2.7.5. Financials (Based on Availability)
- 11.2.8 ASAHI
- 11.2.8.1. Overview
- 11.2.8.2. Products
- 11.2.8.3. SWOT Analysis
- 11.2.8.4. Recent Developments
- 11.2.8.5. Financials (Based on Availability)
- 11.2.9 Villa
- 11.2.9.1. Overview
- 11.2.9.2. Products
- 11.2.9.3. SWOT Analysis
- 11.2.9.4. Recent Developments
- 11.2.9.5. Financials (Based on Availability)
- 11.2.10 Yoshida
- 11.2.10.1. Overview
- 11.2.10.2. Products
- 11.2.10.3. SWOT Analysis
- 11.2.10.4. Recent Developments
- 11.2.10.5. Financials (Based on Availability)
- 11.2.11 Acteon
- 11.2.11.1. Overview
- 11.2.11.2. Products
- 11.2.11.3. SWOT Analysis
- 11.2.11.4. Recent Developments
- 11.2.11.5. Financials (Based on Availability)
- 11.2.12 Meyer
- 11.2.12.1. Overview
- 11.2.12.2. Products
- 11.2.12.3. SWOT Analysis
- 11.2.12.4. Recent Developments
- 11.2.12.5. Financials (Based on Availability)
- 11.2.13 LargeV
- 11.2.13.1. Overview
- 11.2.13.2. Products
- 11.2.13.3. SWOT Analysis
- 11.2.13.4. Recent Developments
- 11.2.13.5. Financials (Based on Availability)
- 11.2.1 Danaher
List of Figures
- Figure 1: Global Cbct Machine Revenue Breakdown (million, %) by Region 2024 & 2032
- Figure 2: Global Cbct Machine Volume Breakdown (K, %) by Region 2024 & 2032
- Figure 3: North America Cbct Machine Revenue (million), by Application 2024 & 2032
- Figure 4: North America Cbct Machine Volume (K), by Application 2024 & 2032
- Figure 5: North America Cbct Machine Revenue Share (%), by Application 2024 & 2032
- Figure 6: North America Cbct Machine Volume Share (%), by Application 2024 & 2032
- Figure 7: North America Cbct Machine Revenue (million), by Type 2024 & 2032
- Figure 8: North America Cbct Machine Volume (K), by Type 2024 & 2032
- Figure 9: North America Cbct Machine Revenue Share (%), by Type 2024 & 2032
- Figure 10: North America Cbct Machine Volume Share (%), by Type 2024 & 2032
- Figure 11: North America Cbct Machine Revenue (million), by Country 2024 & 2032
- Figure 12: North America Cbct Machine Volume (K), by Country 2024 & 2032
- Figure 13: North America Cbct Machine Revenue Share (%), by Country 2024 & 2032
- Figure 14: North America Cbct Machine Volume Share (%), by Country 2024 & 2032
- Figure 15: South America Cbct Machine Revenue (million), by Application 2024 & 2032
- Figure 16: South America Cbct Machine Volume (K), by Application 2024 & 2032
- Figure 17: South America Cbct Machine Revenue Share (%), by Application 2024 & 2032
- Figure 18: South America Cbct Machine Volume Share (%), by Application 2024 & 2032
- Figure 19: South America Cbct Machine Revenue (million), by Type 2024 & 2032
- Figure 20: South America Cbct Machine Volume (K), by Type 2024 & 2032
- Figure 21: South America Cbct Machine Revenue Share (%), by Type 2024 & 2032
- Figure 22: South America Cbct Machine Volume Share (%), by Type 2024 & 2032
- Figure 23: South America Cbct Machine Revenue (million), by Country 2024 & 2032
- Figure 24: South America Cbct Machine Volume (K), by Country 2024 & 2032
- Figure 25: South America Cbct Machine Revenue Share (%), by Country 2024 & 2032
- Figure 26: South America Cbct Machine Volume Share (%), by Country 2024 & 2032
- Figure 27: Europe Cbct Machine Revenue (million), by Application 2024 & 2032
- Figure 28: Europe Cbct Machine Volume (K), by Application 2024 & 2032
- Figure 29: Europe Cbct Machine Revenue Share (%), by Application 2024 & 2032
- Figure 30: Europe Cbct Machine Volume Share (%), by Application 2024 & 2032
- Figure 31: Europe Cbct Machine Revenue (million), by Type 2024 & 2032
- Figure 32: Europe Cbct Machine Volume (K), by Type 2024 & 2032
- Figure 33: Europe Cbct Machine Revenue Share (%), by Type 2024 & 2032
- Figure 34: Europe Cbct Machine Volume Share (%), by Type 2024 & 2032
- Figure 35: Europe Cbct Machine Revenue (million), by Country 2024 & 2032
- Figure 36: Europe Cbct Machine Volume (K), by Country 2024 & 2032
- Figure 37: Europe Cbct Machine Revenue Share (%), by Country 2024 & 2032
- Figure 38: Europe Cbct Machine Volume Share (%), by Country 2024 & 2032
- Figure 39: Middle East & Africa Cbct Machine Revenue (million), by Application 2024 & 2032
- Figure 40: Middle East & Africa Cbct Machine Volume (K), by Application 2024 & 2032
- Figure 41: Middle East & Africa Cbct Machine Revenue Share (%), by Application 2024 & 2032
- Figure 42: Middle East & Africa Cbct Machine Volume Share (%), by Application 2024 & 2032
- Figure 43: Middle East & Africa Cbct Machine Revenue (million), by Type 2024 & 2032
- Figure 44: Middle East & Africa Cbct Machine Volume (K), by Type 2024 & 2032
- Figure 45: Middle East & Africa Cbct Machine Revenue Share (%), by Type 2024 & 2032
- Figure 46: Middle East & Africa Cbct Machine Volume Share (%), by Type 2024 & 2032
- Figure 47: Middle East & Africa Cbct Machine Revenue (million), by Country 2024 & 2032
- Figure 48: Middle East & Africa Cbct Machine Volume (K), by Country 2024 & 2032
- Figure 49: Middle East & Africa Cbct Machine Revenue Share (%), by Country 2024 & 2032
- Figure 50: Middle East & Africa Cbct Machine Volume Share (%), by Country 2024 & 2032
- Figure 51: Asia Pacific Cbct Machine Revenue (million), by Application 2024 & 2032
- Figure 52: Asia Pacific Cbct Machine Volume (K), by Application 2024 & 2032
- Figure 53: Asia Pacific Cbct Machine Revenue Share (%), by Application 2024 & 2032
- Figure 54: Asia Pacific Cbct Machine Volume Share (%), by Application 2024 & 2032
- Figure 55: Asia Pacific Cbct Machine Revenue (million), by Type 2024 & 2032
- Figure 56: Asia Pacific Cbct Machine Volume (K), by Type 2024 & 2032
- Figure 57: Asia Pacific Cbct Machine Revenue Share (%), by Type 2024 & 2032
- Figure 58: Asia Pacific Cbct Machine Volume Share (%), by Type 2024 & 2032
- Figure 59: Asia Pacific Cbct Machine Revenue (million), by Country 2024 & 2032
- Figure 60: Asia Pacific Cbct Machine Volume (K), by Country 2024 & 2032
- Figure 61: Asia Pacific Cbct Machine Revenue Share (%), by Country 2024 & 2032
- Figure 62: Asia Pacific Cbct Machine Volume Share (%), by Country 2024 & 2032
List of Tables
- Table 1: Global Cbct Machine Revenue million Forecast, by Region 2019 & 2032
- Table 2: Global Cbct Machine Volume K Forecast, by Region 2019 & 2032
- Table 3: Global Cbct Machine Revenue million Forecast, by Application 2019 & 2032
- Table 4: Global Cbct Machine Volume K Forecast, by Application 2019 & 2032
- Table 5: Global Cbct Machine Revenue million Forecast, by Type 2019 & 2032
- Table 6: Global Cbct Machine Volume K Forecast, by Type 2019 & 2032
- Table 7: Global Cbct Machine Revenue million Forecast, by Region 2019 & 2032
- Table 8: Global Cbct Machine Volume K Forecast, by Region 2019 & 2032
- Table 9: Global Cbct Machine Revenue million Forecast, by Application 2019 & 2032
- Table 10: Global Cbct Machine Volume K Forecast, by Application 2019 & 2032
- Table 11: Global Cbct Machine Revenue million Forecast, by Type 2019 & 2032
- Table 12: Global Cbct Machine Volume K Forecast, by Type 2019 & 2032
- Table 13: Global Cbct Machine Revenue million Forecast, by Country 2019 & 2032
- Table 14: Global Cbct Machine Volume K Forecast, by Country 2019 & 2032
- Table 15: United States Cbct Machine Revenue (million) Forecast, by Application 2019 & 2032
- Table 16: United States Cbct Machine Volume (K) Forecast, by Application 2019 & 2032
- Table 17: Canada Cbct Machine Revenue (million) Forecast, by Application 2019 & 2032
- Table 18: Canada Cbct Machine Volume (K) Forecast, by Application 2019 & 2032
- Table 19: Mexico Cbct Machine Revenue (million) Forecast, by Application 2019 & 2032
- Table 20: Mexico Cbct Machine Volume (K) Forecast, by Application 2019 & 2032
- Table 21: Global Cbct Machine Revenue million Forecast, by Application 2019 & 2032
- Table 22: Global Cbct Machine Volume K Forecast, by Application 2019 & 2032
- Table 23: Global Cbct Machine Revenue million Forecast, by Type 2019 & 2032
- Table 24: Global Cbct Machine Volume K Forecast, by Type 2019 & 2032
- Table 25: Global Cbct Machine Revenue million Forecast, by Country 2019 & 2032
- Table 26: Global Cbct Machine Volume K Forecast, by Country 2019 & 2032
- Table 27: Brazil Cbct Machine Revenue (million) Forecast, by Application 2019 & 2032
- Table 28: Brazil Cbct Machine Volume (K) Forecast, by Application 2019 & 2032
- Table 29: Argentina Cbct Machine Revenue (million) Forecast, by Application 2019 & 2032
- Table 30: Argentina Cbct Machine Volume (K) Forecast, by Application 2019 & 2032
- Table 31: Rest of South America Cbct Machine Revenue (million) Forecast, by Application 2019 & 2032
- Table 32: Rest of South America Cbct Machine Volume (K) Forecast, by Application 2019 & 2032
- Table 33: Global Cbct Machine Revenue million Forecast, by Application 2019 & 2032
- Table 34: Global Cbct Machine Volume K Forecast, by Application 2019 & 2032
- Table 35: Global Cbct Machine Revenue million Forecast, by Type 2019 & 2032
- Table 36: Global Cbct Machine Volume K Forecast, by Type 2019 & 2032
- Table 37: Global Cbct Machine Revenue million Forecast, by Country 2019 & 2032
- Table 38: Global Cbct Machine Volume K Forecast, by Country 2019 & 2032
- Table 39: United Kingdom Cbct Machine Revenue (million) Forecast, by Application 2019 & 2032
- Table 40: United Kingdom Cbct Machine Volume (K) Forecast, by Application 2019 & 2032
- Table 41: Germany Cbct Machine Revenue (million) Forecast, by Application 2019 & 2032
- Table 42: Germany Cbct Machine Volume (K) Forecast, by Application 2019 & 2032
- Table 43: France Cbct Machine Revenue (million) Forecast, by Application 2019 & 2032
- Table 44: France Cbct Machine Volume (K) Forecast, by Application 2019 & 2032
- Table 45: Italy Cbct Machine Revenue (million) Forecast, by Application 2019 & 2032
- Table 46: Italy Cbct Machine Volume (K) Forecast, by Application 2019 & 2032
- Table 47: Spain Cbct Machine Revenue (million) Forecast, by Application 2019 & 2032
- Table 48: Spain Cbct Machine Volume (K) Forecast, by Application 2019 & 2032
- Table 49: Russia Cbct Machine Revenue (million) Forecast, by Application 2019 & 2032
- Table 50: Russia Cbct Machine Volume (K) Forecast, by Application 2019 & 2032
- Table 51: Benelux Cbct Machine Revenue (million) Forecast, by Application 2019 & 2032
- Table 52: Benelux Cbct Machine Volume (K) Forecast, by Application 2019 & 2032
- Table 53: Nordics Cbct Machine Revenue (million) Forecast, by Application 2019 & 2032
- Table 54: Nordics Cbct Machine Volume (K) Forecast, by Application 2019 & 2032
- Table 55: Rest of Europe Cbct Machine Revenue (million) Forecast, by Application 2019 & 2032
- Table 56: Rest of Europe Cbct Machine Volume (K) Forecast, by Application 2019 & 2032
- Table 57: Global Cbct Machine Revenue million Forecast, by Application 2019 & 2032
- Table 58: Global Cbct Machine Volume K Forecast, by Application 2019 & 2032
- Table 59: Global Cbct Machine Revenue million Forecast, by Type 2019 & 2032
- Table 60: Global Cbct Machine Volume K Forecast, by Type 2019 & 2032
- Table 61: Global Cbct Machine Revenue million Forecast, by Country 2019 & 2032
- Table 62: Global Cbct Machine Volume K Forecast, by Country 2019 & 2032
- Table 63: Turkey Cbct Machine Revenue (million) Forecast, by Application 2019 & 2032
- Table 64: Turkey Cbct Machine Volume (K) Forecast, by Application 2019 & 2032
- Table 65: Israel Cbct Machine Revenue (million) Forecast, by Application 2019 & 2032
- Table 66: Israel Cbct Machine Volume (K) Forecast, by Application 2019 & 2032
- Table 67: GCC Cbct Machine Revenue (million) Forecast, by Application 2019 & 2032
- Table 68: GCC Cbct Machine Volume (K) Forecast, by Application 2019 & 2032
- Table 69: North Africa Cbct Machine Revenue (million) Forecast, by Application 2019 & 2032
- Table 70: North Africa Cbct Machine Volume (K) Forecast, by Application 2019 & 2032
- Table 71: South Africa Cbct Machine Revenue (million) Forecast, by Application 2019 & 2032
- Table 72: South Africa Cbct Machine Volume (K) Forecast, by Application 2019 & 2032
- Table 73: Rest of Middle East & Africa Cbct Machine Revenue (million) Forecast, by Application 2019 & 2032
- Table 74: Rest of Middle East & Africa Cbct Machine Volume (K) Forecast, by Application 2019 & 2032
- Table 75: Global Cbct Machine Revenue million Forecast, by Application 2019 & 2032
- Table 76: Global Cbct Machine Volume K Forecast, by Application 2019 & 2032
- Table 77: Global Cbct Machine Revenue million Forecast, by Type 2019 & 2032
- Table 78: Global Cbct Machine Volume K Forecast, by Type 2019 & 2032
- Table 79: Global Cbct Machine Revenue million Forecast, by Country 2019 & 2032
- Table 80: Global Cbct Machine Volume K Forecast, by Country 2019 & 2032
- Table 81: China Cbct Machine Revenue (million) Forecast, by Application 2019 & 2032
- Table 82: China Cbct Machine Volume (K) Forecast, by Application 2019 & 2032
- Table 83: India Cbct Machine Revenue (million) Forecast, by Application 2019 & 2032
- Table 84: India Cbct Machine Volume (K) Forecast, by Application 2019 & 2032
- Table 85: Japan Cbct Machine Revenue (million) Forecast, by Application 2019 & 2032
- Table 86: Japan Cbct Machine Volume (K) Forecast, by Application 2019 & 2032
- Table 87: South Korea Cbct Machine Revenue (million) Forecast, by Application 2019 & 2032
- Table 88: South Korea Cbct Machine Volume (K) Forecast, by Application 2019 & 2032
- Table 89: ASEAN Cbct Machine Revenue (million) Forecast, by Application 2019 & 2032
- Table 90: ASEAN Cbct Machine Volume (K) Forecast, by Application 2019 & 2032
- Table 91: Oceania Cbct Machine Revenue (million) Forecast, by Application 2019 & 2032
- Table 92: Oceania Cbct Machine Volume (K) Forecast, by Application 2019 & 2032
- Table 93: Rest of Asia Pacific Cbct Machine Revenue (million) Forecast, by Application 2019 & 2032
- Table 94: Rest of Asia Pacific Cbct Machine Volume (K) Forecast, by Application 2019 & 2032
Frequently Asked Questions
1. What is the projected Compound Annual Growth Rate (CAGR) of the Cbct Machine?
The projected CAGR is approximately XXX%.
2. Which companies are prominent players in the Cbct Machine?
Key companies in the market include Danaher, Planmeca Group, Sirona, New Tom(Cefla), Carestream, VATECH, J.Morita, ASAHI, Villa, Yoshida, Acteon, Meyer, LargeV.
3. What are the main segments of the Cbct Machine?
The market segments include Application, Type.
4. Can you provide details about the market size?
The market size is estimated to be USD XXX million as of 2022.
5. What are some drivers contributing to market growth?
N/A
6. What are the notable trends driving market growth?
N/A
7. Are there any restraints impacting market growth?
N/A
8. Can you provide examples of recent developments in the market?
N/A
9. What pricing options are available for accessing the report?
Pricing options include single-user, multi-user, and enterprise licenses priced at USD 3950.00, USD 5925.00, and USD 7900.00 respectively.
10. Is the market size provided in terms of value or volume?
The market size is provided in terms of value, measured in million and volume, measured in K.
11. Are there any specific market keywords associated with the report?
Yes, the market keyword associated with the report is "Cbct Machine," which aids in identifying and referencing the specific market segment covered.
12. How do I determine which pricing option suits my needs best?
The pricing options vary based on user requirements and access needs. Individual users may opt for single-user licenses, while businesses requiring broader access may choose multi-user or enterprise licenses for cost-effective access to the report.
13. Are there any additional resources or data provided in the Cbct Machine report?
While the report offers comprehensive insights, it's advisable to review the specific contents or supplementary materials provided to ascertain if additional resources or data are available.
14. How can I stay updated on further developments or reports in the Cbct Machine?
To stay informed about further developments, trends, and reports in the Cbct Machine, consider subscribing to industry newsletters, following relevant companies and organizations, or regularly checking reputable industry news sources and publications.
Methodology
Step 1 - Identification of Relevant Samples Size from Population Database


Step 2 - Approaches for Defining Global Market Size (Value, Volume* & Price*)

Note*: In applicable scenarios
Step 3 - Data Sources
Primary Research
- Web Analytics
- Survey Reports
- Research Institute
- Latest Research Reports
- Opinion Leaders
Secondary Research
- Annual Reports
- White Paper
- Latest Press Release
- Industry Association
- Paid Database
- Investor Presentations

Step 4 - Data Triangulation
Involves using different sources of information in order to increase the validity of a study
These sources are likely to be stakeholders in a program - participants, other researchers, program staff, other community members, and so on.
Then we put all data in single framework & apply various statistical tools to find out the dynamic on the market.
During the analysis stage, feedback from the stakeholder groups would be compared to determine areas of agreement as well as areas of divergence
