

Key Insights
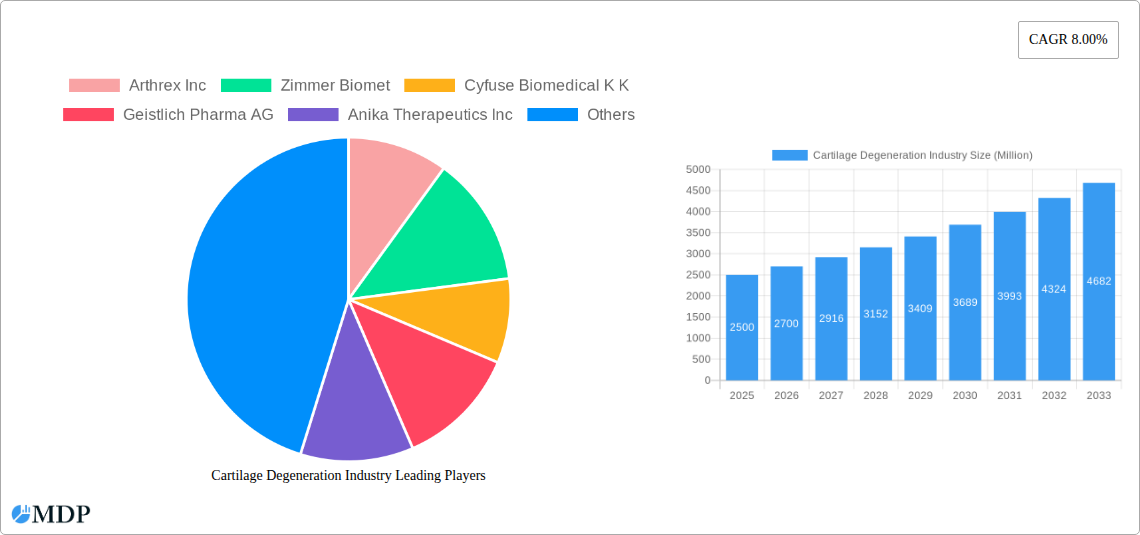
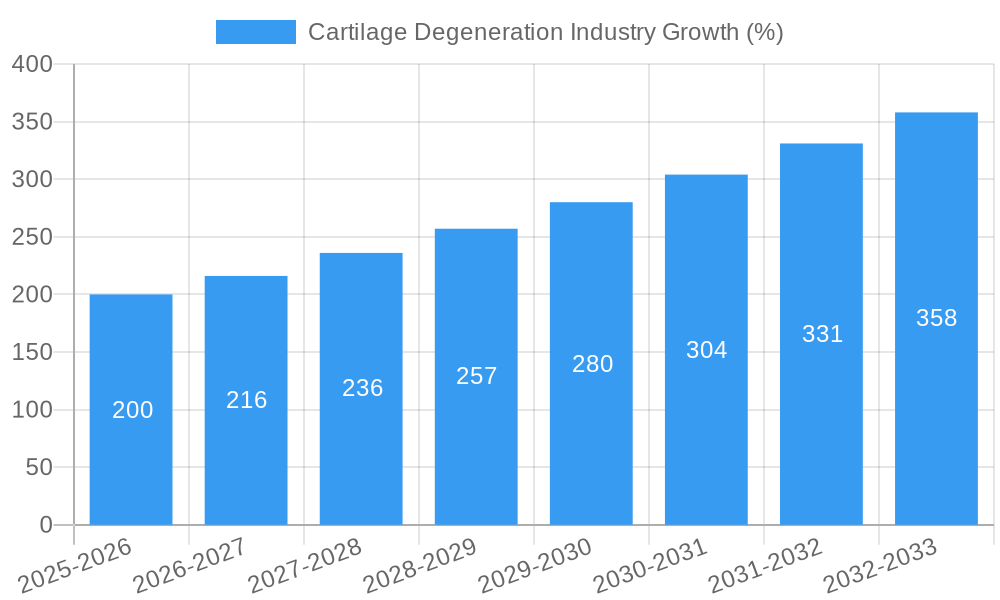
The global cartilage degeneration market, valued at approximately $2.5 billion in 2025, is projected to experience robust growth, exhibiting a compound annual growth rate (CAGR) of 8% from 2025 to 2033. This expansion is fueled by several key factors. The aging global population is a significant driver, as cartilage degeneration is strongly associated with age-related wear and tear. Increased prevalence of osteoarthritis and other degenerative joint diseases further contributes to market demand. Advances in treatment modalities, including minimally invasive surgical techniques and the development of innovative cell-based therapies like autologous chondrocyte implantation (ACI) and matrix-induced autologous chondrocyte implantation (MACI), are stimulating market growth. The increasing adoption of regenerative medicine approaches focusing on intrinsic repair stimulus offers promising treatment options beyond palliative care, further driving market expansion. Growth is particularly notable in segments such as knee and hip applications, reflecting the high incidence of osteoarthritis in these joints. While high treatment costs and the potential for complications associated with certain procedures act as restraints, the overall market outlook remains positive due to the unmet clinical need and ongoing research and development efforts.
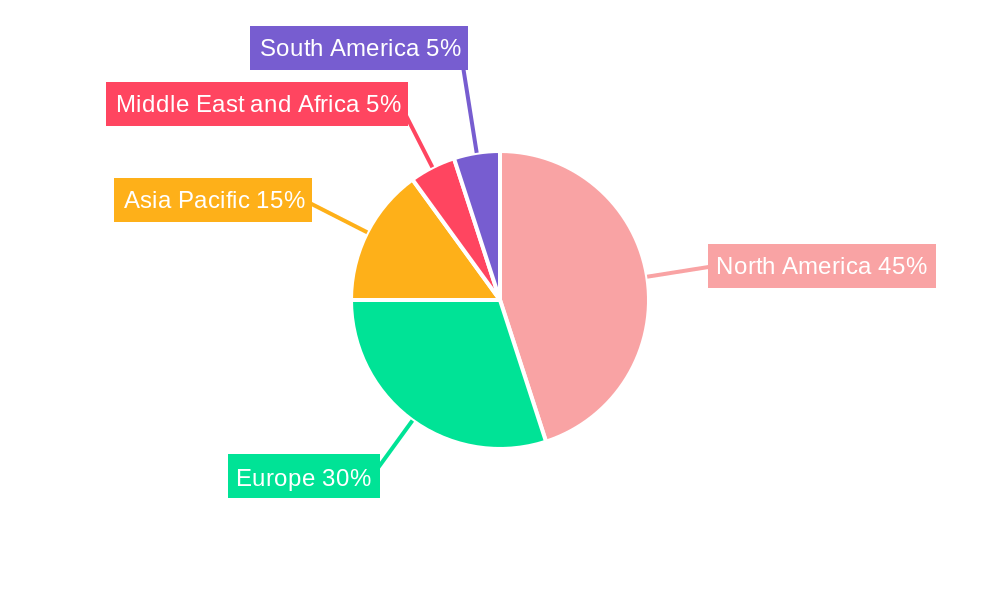
The market is segmented by cartilage type (fibrocartilage, hyaline cartilage, others), treatment modality (cell-based, non-cell-based), treatment type (palliative, intrinsic repair stimulus), and application site (knee, spine, ankle, hip, others). North America currently holds the largest market share due to high healthcare expenditure, advanced medical infrastructure, and a large patient population. However, Asia-Pacific is anticipated to witness significant growth over the forecast period, driven by rising disposable incomes, increasing healthcare awareness, and expanding access to advanced treatment options. Competitive dynamics are characterized by the presence of major players such as Arthrex Inc., Zimmer Biomet, and Johnson & Johnson, alongside several emerging companies focused on innovative regenerative medicine solutions. The continuous innovation in cartilage repair techniques and the growing adoption of personalized medicine approaches will significantly shape the market trajectory in the coming years.
Cartilage Degeneration Industry Market Report: 2019-2033
This comprehensive report provides a detailed analysis of the Cartilage Degeneration industry, covering market dynamics, leading players, emerging trends, and future growth prospects from 2019 to 2033. The study period spans 2019-2024 (Historical Period), with 2025 as the base year and estimated year. The forecast period extends from 2025-2033. The global market is projected to reach $XX Million by 2033, exhibiting a CAGR of XX% during the forecast period. This in-depth analysis will equip stakeholders with actionable insights to navigate the evolving landscape of this vital sector.
Cartilage Degeneration Industry Market Dynamics & Concentration
The Cartilage Degeneration industry is characterized by a moderately concentrated market structure, with key players like Arthrex Inc, Zimmer Biomet, and Johnson & Johnson holding significant market share. The market concentration ratio (CR5) is estimated at XX%, indicating the dominance of a few major players. However, the market is witnessing increased competition from emerging companies with innovative treatment modalities. Market growth is primarily driven by the rising prevalence of osteoarthritis and other cartilage-related disorders, coupled with an aging global population. Innovation in cell-based therapies and advanced biomaterials is a significant driver, while stringent regulatory frameworks and high treatment costs pose challenges. The industry has seen a moderate level of M&A activity in recent years, with approximately XX deals recorded between 2019 and 2024. These activities often aim to expand product portfolios and access new technologies. Product substitutes, such as pain management drugs and joint replacement surgeries, create competitive pressures, influencing treatment choices and market share dynamics. End-user preferences are shifting towards minimally invasive procedures and personalized medicine, driving demand for innovative treatment solutions.
- Market Concentration: CR5 estimated at XX% in 2024.
- M&A Activity: Approximately XX deals recorded from 2019-2024.
- Key Innovation Drivers: Cell-based therapies, advanced biomaterials, minimally invasive procedures.
- Regulatory Landscape: Stringent regulatory approvals for new treatments.
- Product Substitutes: Pain management drugs, joint replacement surgeries.
Cartilage Degeneration Industry Industry Trends & Analysis
The Cartilage Degeneration industry is experiencing robust growth, driven by several key factors. The increasing prevalence of osteoarthritis, particularly among aging populations in developed countries, is a primary driver. Technological advancements, such as the development of novel cell-based therapies and biomaterials, are revolutionizing treatment approaches, leading to improved patient outcomes and market expansion. Consumer preferences are shifting toward less invasive and more effective treatments with faster recovery times, driving demand for innovative solutions. The competitive landscape is dynamic, with both established players and emerging companies investing in research and development, fueling market innovation and competition. The market has witnessed a notable increase in the adoption of cell-based therapies, with a projected market penetration of XX% by 2033. The overall market exhibits a strong projected CAGR of XX% during the forecast period (2025-2033). This growth is further fueled by increasing healthcare expenditure and rising awareness regarding cartilage degeneration diseases. The shift towards personalized medicine and improved diagnostic tools contributes to a more targeted and effective treatment approach, increasing market potential.
Leading Markets & Segments in Cartilage Degeneration Industry
The knee segment dominates the application site market, owing to the high prevalence of knee osteoarthritis. North America holds the largest market share globally, driven by high healthcare expenditure, advanced infrastructure, and a significant aging population. Within treatment modalities, non-cell-based treatments currently hold a larger market share than cell-based treatments. However, the cell-based treatment segment is projected to experience significant growth due to its potential for long-term solutions. Hyaline cartilage accounts for the largest share in the types of cartilage segment.
- Dominant Region: North America
- Dominant Application Site: Knee
- Dominant Type of Cartilage: Hyaline Cartilage
- Dominant Treatment Modality: Non-cell-based (Currently)
- Key Drivers for North America: High healthcare expenditure, aging population, advanced healthcare infrastructure.
Key Drivers for Knee Segment: High prevalence of osteoarthritis, increased awareness, readily available treatment options.
Key Drivers for Hyaline Cartilage Segment: High incidence in osteoarthritis, suitability for various treatment options.
Cartilage Degeneration Industry Product Developments
Recent product innovations focus on improving the efficacy and safety of cartilage repair procedures. This includes the development of novel biomaterials with enhanced biocompatibility and improved integration with native tissue. There's a significant emphasis on minimally invasive techniques to reduce patient recovery time and improve patient outcomes. Several companies are developing personalized treatment options, tailoring interventions based on individual patient needs. These advancements address unmet clinical needs and enhance market competitiveness, particularly in cell-based therapies, which offer a potential cure for cartilage degeneration.
Key Drivers of Cartilage Degeneration Industry Growth
Several factors propel the growth of the Cartilage Degeneration industry. Firstly, the rising prevalence of osteoarthritis, a leading cause of cartilage degeneration, is driving increased demand for treatments. Technological advancements in cell-based therapies and biomaterials provide improved treatment options, stimulating market growth. Increased healthcare expenditure, particularly in developed nations, also fuels demand. Moreover, supportive regulatory frameworks and initiatives promoting healthcare access play a critical role.
Challenges in the Cartilage Degeneration Industry Market
The industry faces challenges like stringent regulatory approval processes for new treatments, which often lead to extended timelines and increased development costs. High treatment costs and limited insurance coverage restrict patient access to advanced therapies. The competitive landscape with both established and emerging players increases the pressure on companies to innovate and maintain market share. Supply chain complexities and the need for specialized facilities can further constrain market growth.
Emerging Opportunities in Cartilage Degeneration Industry
The industry presents several growth opportunities. The development of next-generation cell-based therapies and biomaterials holds significant promise for improving treatment outcomes. Strategic partnerships between pharmaceutical companies, research institutions, and medical device manufacturers can accelerate product development and market penetration. Expansion into emerging markets with growing populations and increased healthcare expenditure presents considerable potential for growth. The increasing prevalence of cartilage-related diseases and the rising geriatric population globally provide a strong foundation for future expansion and growth.
Leading Players in the Cartilage Degeneration Industry Sector
- Arthrex Inc
- Zimmer Biomet
- Cyfuse Biomedical K K
- Geistlich Pharma AG
- Anika Therapeutics Inc
- Vericel Corporation
- Johnson & Johnson
- B Braun Melsungen AG
- Stryker Corporation
- Smith & Nephew plc
Key Milestones in Cartilage Degeneration Industry Industry
- July 2022: Orthox received Medicines and Healthcare products Regulatory Agency (MHRA) authorisation for a clinical trial of its knee cartilage repair FibroFix product platform. This milestone signifies progress in the development of novel cartilage repair solutions.
- July 2021: The United States Food and Drug Administration granted breakthrough device status to Hyalex's cartilage system. This designation accelerates the development and market entry of innovative cartilage repair technologies.
Strategic Outlook for Cartilage Degeneration Industry Market
The Cartilage Degeneration industry is poised for significant growth driven by technological advancements, increasing disease prevalence, and rising healthcare spending. Strategic partnerships and investments in research and development will be crucial for companies to maintain competitiveness. Focusing on personalized medicine and minimally invasive procedures will appeal to market preferences. Expansion into emerging markets and developing new products with enhanced efficacy and safety will be key to capitalizing on long-term market potential.
Cartilage Degeneration Industry Segmentation
-
1. Types of Cartilage
- 1.1. Fibrocartilage
- 1.2. Hyaline Cartilage
- 1.3. Others
-
2. Treatment Modality
- 2.1. Cell-based
- 2.2. Non-Cell-based
-
3. Treatment Type
- 3.1. Palliative
- 3.2. Intrinsic Repair Stimulus
-
4. Application Site
- 4.1. Knee
- 4.2. Spine
- 4.3. Ankle
- 4.4. Hip
- 4.5. Others
Cartilage Degeneration Industry Segmentation By Geography
-
1. North America
- 1.1. United States
- 1.2. Canada
- 1.3. Mexico
-
2. Europe
- 2.1. Germany
- 2.2. United Kingdom
- 2.3. France
- 2.4. Italy
- 2.5. Spain
- 2.6. Rest of Europe
-
3. Asia Pacific
- 3.1. China
- 3.2. Japan
- 3.3. India
- 3.4. Australia
- 3.5. South Korea
- 3.6. Rest of Asia Pacific
-
4. Middle East and Africa
- 4.1. GCC
- 4.2. South Africa
- 4.3. Rest of Middle East and Africa
-
5. South America
- 5.1. Brazil
- 5.2. Argentina
- 5.3. Rest of South America
Cartilage Degeneration Industry REPORT HIGHLIGHTS
| Aspects | Details |
|---|---|
| Study Period | 2019-2033 |
| Base Year | 2024 |
| Estimated Year | 2025 |
| Forecast Period | 2025-2033 |
| Historical Period | 2019-2024 |
| Growth Rate | CAGR of 8.00% from 2019-2033 |
| Segmentation |
|
Table of Contents
- 1. Introduction
- 1.1. Research Scope
- 1.2. Market Segmentation
- 1.3. Research Methodology
- 1.4. Definitions and Assumptions
- 2. Executive Summary
- 2.1. Introduction
- 3. Market Dynamics
- 3.1. Introduction
- 3.2. Market Drivers
- 3.2.1. Rising Prevalence of the Joints and Bones Disorders around the World and Increasing Geriatric Population; Technological Advancements in Cartilage Repair/Regeneration; Increasing Number of Injuries and Accidents
- 3.3. Market Restrains
- 3.3.1. High Costs of Cartilage Repair Procedures; Regulatory and Reimbursement Issues
- 3.4. Market Trends
- 3.4.1. Knee Application Segment is Expected to Hold a Major Share in the Cartilage Repair/Regeneration Market
- 4. Market Factor Analysis
- 4.1. Porters Five Forces
- 4.2. Supply/Value Chain
- 4.3. PESTEL analysis
- 4.4. Market Entropy
- 4.5. Patent/Trademark Analysis
- 5. Global Cartilage Degeneration Industry Analysis, Insights and Forecast, 2019-2031
- 5.1. Market Analysis, Insights and Forecast - by Types of Cartilage
- 5.1.1. Fibrocartilage
- 5.1.2. Hyaline Cartilage
- 5.1.3. Others
- 5.2. Market Analysis, Insights and Forecast - by Treatment Modality
- 5.2.1. Cell-based
- 5.2.2. Non-Cell-based
- 5.3. Market Analysis, Insights and Forecast - by Treatment Type
- 5.3.1. Palliative
- 5.3.2. Intrinsic Repair Stimulus
- 5.4. Market Analysis, Insights and Forecast - by Application Site
- 5.4.1. Knee
- 5.4.2. Spine
- 5.4.3. Ankle
- 5.4.4. Hip
- 5.4.5. Others
- 5.5. Market Analysis, Insights and Forecast - by Region
- 5.5.1. North America
- 5.5.2. Europe
- 5.5.3. Asia Pacific
- 5.5.4. Middle East and Africa
- 5.5.5. South America
- 5.1. Market Analysis, Insights and Forecast - by Types of Cartilage
- 6. North America Cartilage Degeneration Industry Analysis, Insights and Forecast, 2019-2031
- 6.1. Market Analysis, Insights and Forecast - by Types of Cartilage
- 6.1.1. Fibrocartilage
- 6.1.2. Hyaline Cartilage
- 6.1.3. Others
- 6.2. Market Analysis, Insights and Forecast - by Treatment Modality
- 6.2.1. Cell-based
- 6.2.2. Non-Cell-based
- 6.3. Market Analysis, Insights and Forecast - by Treatment Type
- 6.3.1. Palliative
- 6.3.2. Intrinsic Repair Stimulus
- 6.4. Market Analysis, Insights and Forecast - by Application Site
- 6.4.1. Knee
- 6.4.2. Spine
- 6.4.3. Ankle
- 6.4.4. Hip
- 6.4.5. Others
- 6.1. Market Analysis, Insights and Forecast - by Types of Cartilage
- 7. Europe Cartilage Degeneration Industry Analysis, Insights and Forecast, 2019-2031
- 7.1. Market Analysis, Insights and Forecast - by Types of Cartilage
- 7.1.1. Fibrocartilage
- 7.1.2. Hyaline Cartilage
- 7.1.3. Others
- 7.2. Market Analysis, Insights and Forecast - by Treatment Modality
- 7.2.1. Cell-based
- 7.2.2. Non-Cell-based
- 7.3. Market Analysis, Insights and Forecast - by Treatment Type
- 7.3.1. Palliative
- 7.3.2. Intrinsic Repair Stimulus
- 7.4. Market Analysis, Insights and Forecast - by Application Site
- 7.4.1. Knee
- 7.4.2. Spine
- 7.4.3. Ankle
- 7.4.4. Hip
- 7.4.5. Others
- 7.1. Market Analysis, Insights and Forecast - by Types of Cartilage
- 8. Asia Pacific Cartilage Degeneration Industry Analysis, Insights and Forecast, 2019-2031
- 8.1. Market Analysis, Insights and Forecast - by Types of Cartilage
- 8.1.1. Fibrocartilage
- 8.1.2. Hyaline Cartilage
- 8.1.3. Others
- 8.2. Market Analysis, Insights and Forecast - by Treatment Modality
- 8.2.1. Cell-based
- 8.2.2. Non-Cell-based
- 8.3. Market Analysis, Insights and Forecast - by Treatment Type
- 8.3.1. Palliative
- 8.3.2. Intrinsic Repair Stimulus
- 8.4. Market Analysis, Insights and Forecast - by Application Site
- 8.4.1. Knee
- 8.4.2. Spine
- 8.4.3. Ankle
- 8.4.4. Hip
- 8.4.5. Others
- 8.1. Market Analysis, Insights and Forecast - by Types of Cartilage
- 9. Middle East and Africa Cartilage Degeneration Industry Analysis, Insights and Forecast, 2019-2031
- 9.1. Market Analysis, Insights and Forecast - by Types of Cartilage
- 9.1.1. Fibrocartilage
- 9.1.2. Hyaline Cartilage
- 9.1.3. Others
- 9.2. Market Analysis, Insights and Forecast - by Treatment Modality
- 9.2.1. Cell-based
- 9.2.2. Non-Cell-based
- 9.3. Market Analysis, Insights and Forecast - by Treatment Type
- 9.3.1. Palliative
- 9.3.2. Intrinsic Repair Stimulus
- 9.4. Market Analysis, Insights and Forecast - by Application Site
- 9.4.1. Knee
- 9.4.2. Spine
- 9.4.3. Ankle
- 9.4.4. Hip
- 9.4.5. Others
- 9.1. Market Analysis, Insights and Forecast - by Types of Cartilage
- 10. South America Cartilage Degeneration Industry Analysis, Insights and Forecast, 2019-2031
- 10.1. Market Analysis, Insights and Forecast - by Types of Cartilage
- 10.1.1. Fibrocartilage
- 10.1.2. Hyaline Cartilage
- 10.1.3. Others
- 10.2. Market Analysis, Insights and Forecast - by Treatment Modality
- 10.2.1. Cell-based
- 10.2.2. Non-Cell-based
- 10.3. Market Analysis, Insights and Forecast - by Treatment Type
- 10.3.1. Palliative
- 10.3.2. Intrinsic Repair Stimulus
- 10.4. Market Analysis, Insights and Forecast - by Application Site
- 10.4.1. Knee
- 10.4.2. Spine
- 10.4.3. Ankle
- 10.4.4. Hip
- 10.4.5. Others
- 10.1. Market Analysis, Insights and Forecast - by Types of Cartilage
- 11. North America Cartilage Degeneration Industry Analysis, Insights and Forecast, 2019-2031
- 11.1. Market Analysis, Insights and Forecast - By Country/Sub-region
- 11.1.1. undefined
- 12. Europe Cartilage Degeneration Industry Analysis, Insights and Forecast, 2019-2031
- 12.1. Market Analysis, Insights and Forecast - By Country/Sub-region
- 12.1.1. undefined
- 13. Asia Pacific Cartilage Degeneration Industry Analysis, Insights and Forecast, 2019-2031
- 13.1. Market Analysis, Insights and Forecast - By Country/Sub-region
- 13.1.1. undefined
- 14. Middle East and Africa Cartilage Degeneration Industry Analysis, Insights and Forecast, 2019-2031
- 14.1. Market Analysis, Insights and Forecast - By Country/Sub-region
- 14.1.1. undefined
- 15. South America Cartilage Degeneration Industry Analysis, Insights and Forecast, 2019-2031
- 15.1. Market Analysis, Insights and Forecast - By Country/Sub-region
- 15.1.1. undefined
- 16. Competitive Analysis
- 16.1. Global Market Share Analysis 2024
- 16.2. Company Profiles
- 16.2.1 Arthrex Inc
- 16.2.1.1. Overview
- 16.2.1.2. Products
- 16.2.1.3. SWOT Analysis
- 16.2.1.4. Recent Developments
- 16.2.1.5. Financials (Based on Availability)
- 16.2.2 Zimmer Biomet
- 16.2.2.1. Overview
- 16.2.2.2. Products
- 16.2.2.3. SWOT Analysis
- 16.2.2.4. Recent Developments
- 16.2.2.5. Financials (Based on Availability)
- 16.2.3 Cyfuse Biomedical K K
- 16.2.3.1. Overview
- 16.2.3.2. Products
- 16.2.3.3. SWOT Analysis
- 16.2.3.4. Recent Developments
- 16.2.3.5. Financials (Based on Availability)
- 16.2.4 Geistlich Pharma AG
- 16.2.4.1. Overview
- 16.2.4.2. Products
- 16.2.4.3. SWOT Analysis
- 16.2.4.4. Recent Developments
- 16.2.4.5. Financials (Based on Availability)
- 16.2.5 Anika Therapeutics Inc
- 16.2.5.1. Overview
- 16.2.5.2. Products
- 16.2.5.3. SWOT Analysis
- 16.2.5.4. Recent Developments
- 16.2.5.5. Financials (Based on Availability)
- 16.2.6 Vericel Corporation
- 16.2.6.1. Overview
- 16.2.6.2. Products
- 16.2.6.3. SWOT Analysis
- 16.2.6.4. Recent Developments
- 16.2.6.5. Financials (Based on Availability)
- 16.2.7 Johnson & Johnson
- 16.2.7.1. Overview
- 16.2.7.2. Products
- 16.2.7.3. SWOT Analysis
- 16.2.7.4. Recent Developments
- 16.2.7.5. Financials (Based on Availability)
- 16.2.8 B Braun Melsungen AG
- 16.2.8.1. Overview
- 16.2.8.2. Products
- 16.2.8.3. SWOT Analysis
- 16.2.8.4. Recent Developments
- 16.2.8.5. Financials (Based on Availability)
- 16.2.9 Stryker Corporation
- 16.2.9.1. Overview
- 16.2.9.2. Products
- 16.2.9.3. SWOT Analysis
- 16.2.9.4. Recent Developments
- 16.2.9.5. Financials (Based on Availability)
- 16.2.10 Smith & Nephew plc
- 16.2.10.1. Overview
- 16.2.10.2. Products
- 16.2.10.3. SWOT Analysis
- 16.2.10.4. Recent Developments
- 16.2.10.5. Financials (Based on Availability)
- 16.2.1 Arthrex Inc
List of Figures
- Figure 1: Global Cartilage Degeneration Industry Revenue Breakdown (Million, %) by Region 2024 & 2032
- Figure 2: Global Cartilage Degeneration Industry Volume Breakdown (K Unit, %) by Region 2024 & 2032
- Figure 3: North America Cartilage Degeneration Industry Revenue (Million), by Country 2024 & 2032
- Figure 4: North America Cartilage Degeneration Industry Volume (K Unit), by Country 2024 & 2032
- Figure 5: North America Cartilage Degeneration Industry Revenue Share (%), by Country 2024 & 2032
- Figure 6: North America Cartilage Degeneration Industry Volume Share (%), by Country 2024 & 2032
- Figure 7: Europe Cartilage Degeneration Industry Revenue (Million), by Country 2024 & 2032
- Figure 8: Europe Cartilage Degeneration Industry Volume (K Unit), by Country 2024 & 2032
- Figure 9: Europe Cartilage Degeneration Industry Revenue Share (%), by Country 2024 & 2032
- Figure 10: Europe Cartilage Degeneration Industry Volume Share (%), by Country 2024 & 2032
- Figure 11: Asia Pacific Cartilage Degeneration Industry Revenue (Million), by Country 2024 & 2032
- Figure 12: Asia Pacific Cartilage Degeneration Industry Volume (K Unit), by Country 2024 & 2032
- Figure 13: Asia Pacific Cartilage Degeneration Industry Revenue Share (%), by Country 2024 & 2032
- Figure 14: Asia Pacific Cartilage Degeneration Industry Volume Share (%), by Country 2024 & 2032
- Figure 15: Middle East and Africa Cartilage Degeneration Industry Revenue (Million), by Country 2024 & 2032
- Figure 16: Middle East and Africa Cartilage Degeneration Industry Volume (K Unit), by Country 2024 & 2032
- Figure 17: Middle East and Africa Cartilage Degeneration Industry Revenue Share (%), by Country 2024 & 2032
- Figure 18: Middle East and Africa Cartilage Degeneration Industry Volume Share (%), by Country 2024 & 2032
- Figure 19: South America Cartilage Degeneration Industry Revenue (Million), by Country 2024 & 2032
- Figure 20: South America Cartilage Degeneration Industry Volume (K Unit), by Country 2024 & 2032
- Figure 21: South America Cartilage Degeneration Industry Revenue Share (%), by Country 2024 & 2032
- Figure 22: South America Cartilage Degeneration Industry Volume Share (%), by Country 2024 & 2032
- Figure 23: North America Cartilage Degeneration Industry Revenue (Million), by Types of Cartilage 2024 & 2032
- Figure 24: North America Cartilage Degeneration Industry Volume (K Unit), by Types of Cartilage 2024 & 2032
- Figure 25: North America Cartilage Degeneration Industry Revenue Share (%), by Types of Cartilage 2024 & 2032
- Figure 26: North America Cartilage Degeneration Industry Volume Share (%), by Types of Cartilage 2024 & 2032
- Figure 27: North America Cartilage Degeneration Industry Revenue (Million), by Treatment Modality 2024 & 2032
- Figure 28: North America Cartilage Degeneration Industry Volume (K Unit), by Treatment Modality 2024 & 2032
- Figure 29: North America Cartilage Degeneration Industry Revenue Share (%), by Treatment Modality 2024 & 2032
- Figure 30: North America Cartilage Degeneration Industry Volume Share (%), by Treatment Modality 2024 & 2032
- Figure 31: North America Cartilage Degeneration Industry Revenue (Million), by Treatment Type 2024 & 2032
- Figure 32: North America Cartilage Degeneration Industry Volume (K Unit), by Treatment Type 2024 & 2032
- Figure 33: North America Cartilage Degeneration Industry Revenue Share (%), by Treatment Type 2024 & 2032
- Figure 34: North America Cartilage Degeneration Industry Volume Share (%), by Treatment Type 2024 & 2032
- Figure 35: North America Cartilage Degeneration Industry Revenue (Million), by Application Site 2024 & 2032
- Figure 36: North America Cartilage Degeneration Industry Volume (K Unit), by Application Site 2024 & 2032
- Figure 37: North America Cartilage Degeneration Industry Revenue Share (%), by Application Site 2024 & 2032
- Figure 38: North America Cartilage Degeneration Industry Volume Share (%), by Application Site 2024 & 2032
- Figure 39: North America Cartilage Degeneration Industry Revenue (Million), by Country 2024 & 2032
- Figure 40: North America Cartilage Degeneration Industry Volume (K Unit), by Country 2024 & 2032
- Figure 41: North America Cartilage Degeneration Industry Revenue Share (%), by Country 2024 & 2032
- Figure 42: North America Cartilage Degeneration Industry Volume Share (%), by Country 2024 & 2032
- Figure 43: Europe Cartilage Degeneration Industry Revenue (Million), by Types of Cartilage 2024 & 2032
- Figure 44: Europe Cartilage Degeneration Industry Volume (K Unit), by Types of Cartilage 2024 & 2032
- Figure 45: Europe Cartilage Degeneration Industry Revenue Share (%), by Types of Cartilage 2024 & 2032
- Figure 46: Europe Cartilage Degeneration Industry Volume Share (%), by Types of Cartilage 2024 & 2032
- Figure 47: Europe Cartilage Degeneration Industry Revenue (Million), by Treatment Modality 2024 & 2032
- Figure 48: Europe Cartilage Degeneration Industry Volume (K Unit), by Treatment Modality 2024 & 2032
- Figure 49: Europe Cartilage Degeneration Industry Revenue Share (%), by Treatment Modality 2024 & 2032
- Figure 50: Europe Cartilage Degeneration Industry Volume Share (%), by Treatment Modality 2024 & 2032
- Figure 51: Europe Cartilage Degeneration Industry Revenue (Million), by Treatment Type 2024 & 2032
- Figure 52: Europe Cartilage Degeneration Industry Volume (K Unit), by Treatment Type 2024 & 2032
- Figure 53: Europe Cartilage Degeneration Industry Revenue Share (%), by Treatment Type 2024 & 2032
- Figure 54: Europe Cartilage Degeneration Industry Volume Share (%), by Treatment Type 2024 & 2032
- Figure 55: Europe Cartilage Degeneration Industry Revenue (Million), by Application Site 2024 & 2032
- Figure 56: Europe Cartilage Degeneration Industry Volume (K Unit), by Application Site 2024 & 2032
- Figure 57: Europe Cartilage Degeneration Industry Revenue Share (%), by Application Site 2024 & 2032
- Figure 58: Europe Cartilage Degeneration Industry Volume Share (%), by Application Site 2024 & 2032
- Figure 59: Europe Cartilage Degeneration Industry Revenue (Million), by Country 2024 & 2032
- Figure 60: Europe Cartilage Degeneration Industry Volume (K Unit), by Country 2024 & 2032
- Figure 61: Europe Cartilage Degeneration Industry Revenue Share (%), by Country 2024 & 2032
- Figure 62: Europe Cartilage Degeneration Industry Volume Share (%), by Country 2024 & 2032
- Figure 63: Asia Pacific Cartilage Degeneration Industry Revenue (Million), by Types of Cartilage 2024 & 2032
- Figure 64: Asia Pacific Cartilage Degeneration Industry Volume (K Unit), by Types of Cartilage 2024 & 2032
- Figure 65: Asia Pacific Cartilage Degeneration Industry Revenue Share (%), by Types of Cartilage 2024 & 2032
- Figure 66: Asia Pacific Cartilage Degeneration Industry Volume Share (%), by Types of Cartilage 2024 & 2032
- Figure 67: Asia Pacific Cartilage Degeneration Industry Revenue (Million), by Treatment Modality 2024 & 2032
- Figure 68: Asia Pacific Cartilage Degeneration Industry Volume (K Unit), by Treatment Modality 2024 & 2032
- Figure 69: Asia Pacific Cartilage Degeneration Industry Revenue Share (%), by Treatment Modality 2024 & 2032
- Figure 70: Asia Pacific Cartilage Degeneration Industry Volume Share (%), by Treatment Modality 2024 & 2032
- Figure 71: Asia Pacific Cartilage Degeneration Industry Revenue (Million), by Treatment Type 2024 & 2032
- Figure 72: Asia Pacific Cartilage Degeneration Industry Volume (K Unit), by Treatment Type 2024 & 2032
- Figure 73: Asia Pacific Cartilage Degeneration Industry Revenue Share (%), by Treatment Type 2024 & 2032
- Figure 74: Asia Pacific Cartilage Degeneration Industry Volume Share (%), by Treatment Type 2024 & 2032
- Figure 75: Asia Pacific Cartilage Degeneration Industry Revenue (Million), by Application Site 2024 & 2032
- Figure 76: Asia Pacific Cartilage Degeneration Industry Volume (K Unit), by Application Site 2024 & 2032
- Figure 77: Asia Pacific Cartilage Degeneration Industry Revenue Share (%), by Application Site 2024 & 2032
- Figure 78: Asia Pacific Cartilage Degeneration Industry Volume Share (%), by Application Site 2024 & 2032
- Figure 79: Asia Pacific Cartilage Degeneration Industry Revenue (Million), by Country 2024 & 2032
- Figure 80: Asia Pacific Cartilage Degeneration Industry Volume (K Unit), by Country 2024 & 2032
- Figure 81: Asia Pacific Cartilage Degeneration Industry Revenue Share (%), by Country 2024 & 2032
- Figure 82: Asia Pacific Cartilage Degeneration Industry Volume Share (%), by Country 2024 & 2032
- Figure 83: Middle East and Africa Cartilage Degeneration Industry Revenue (Million), by Types of Cartilage 2024 & 2032
- Figure 84: Middle East and Africa Cartilage Degeneration Industry Volume (K Unit), by Types of Cartilage 2024 & 2032
- Figure 85: Middle East and Africa Cartilage Degeneration Industry Revenue Share (%), by Types of Cartilage 2024 & 2032
- Figure 86: Middle East and Africa Cartilage Degeneration Industry Volume Share (%), by Types of Cartilage 2024 & 2032
- Figure 87: Middle East and Africa Cartilage Degeneration Industry Revenue (Million), by Treatment Modality 2024 & 2032
- Figure 88: Middle East and Africa Cartilage Degeneration Industry Volume (K Unit), by Treatment Modality 2024 & 2032
- Figure 89: Middle East and Africa Cartilage Degeneration Industry Revenue Share (%), by Treatment Modality 2024 & 2032
- Figure 90: Middle East and Africa Cartilage Degeneration Industry Volume Share (%), by Treatment Modality 2024 & 2032
- Figure 91: Middle East and Africa Cartilage Degeneration Industry Revenue (Million), by Treatment Type 2024 & 2032
- Figure 92: Middle East and Africa Cartilage Degeneration Industry Volume (K Unit), by Treatment Type 2024 & 2032
- Figure 93: Middle East and Africa Cartilage Degeneration Industry Revenue Share (%), by Treatment Type 2024 & 2032
- Figure 94: Middle East and Africa Cartilage Degeneration Industry Volume Share (%), by Treatment Type 2024 & 2032
- Figure 95: Middle East and Africa Cartilage Degeneration Industry Revenue (Million), by Application Site 2024 & 2032
- Figure 96: Middle East and Africa Cartilage Degeneration Industry Volume (K Unit), by Application Site 2024 & 2032
- Figure 97: Middle East and Africa Cartilage Degeneration Industry Revenue Share (%), by Application Site 2024 & 2032
- Figure 98: Middle East and Africa Cartilage Degeneration Industry Volume Share (%), by Application Site 2024 & 2032
- Figure 99: Middle East and Africa Cartilage Degeneration Industry Revenue (Million), by Country 2024 & 2032
- Figure 100: Middle East and Africa Cartilage Degeneration Industry Volume (K Unit), by Country 2024 & 2032
- Figure 101: Middle East and Africa Cartilage Degeneration Industry Revenue Share (%), by Country 2024 & 2032
- Figure 102: Middle East and Africa Cartilage Degeneration Industry Volume Share (%), by Country 2024 & 2032
- Figure 103: South America Cartilage Degeneration Industry Revenue (Million), by Types of Cartilage 2024 & 2032
- Figure 104: South America Cartilage Degeneration Industry Volume (K Unit), by Types of Cartilage 2024 & 2032
- Figure 105: South America Cartilage Degeneration Industry Revenue Share (%), by Types of Cartilage 2024 & 2032
- Figure 106: South America Cartilage Degeneration Industry Volume Share (%), by Types of Cartilage 2024 & 2032
- Figure 107: South America Cartilage Degeneration Industry Revenue (Million), by Treatment Modality 2024 & 2032
- Figure 108: South America Cartilage Degeneration Industry Volume (K Unit), by Treatment Modality 2024 & 2032
- Figure 109: South America Cartilage Degeneration Industry Revenue Share (%), by Treatment Modality 2024 & 2032
- Figure 110: South America Cartilage Degeneration Industry Volume Share (%), by Treatment Modality 2024 & 2032
- Figure 111: South America Cartilage Degeneration Industry Revenue (Million), by Treatment Type 2024 & 2032
- Figure 112: South America Cartilage Degeneration Industry Volume (K Unit), by Treatment Type 2024 & 2032
- Figure 113: South America Cartilage Degeneration Industry Revenue Share (%), by Treatment Type 2024 & 2032
- Figure 114: South America Cartilage Degeneration Industry Volume Share (%), by Treatment Type 2024 & 2032
- Figure 115: South America Cartilage Degeneration Industry Revenue (Million), by Application Site 2024 & 2032
- Figure 116: South America Cartilage Degeneration Industry Volume (K Unit), by Application Site 2024 & 2032
- Figure 117: South America Cartilage Degeneration Industry Revenue Share (%), by Application Site 2024 & 2032
- Figure 118: South America Cartilage Degeneration Industry Volume Share (%), by Application Site 2024 & 2032
- Figure 119: South America Cartilage Degeneration Industry Revenue (Million), by Country 2024 & 2032
- Figure 120: South America Cartilage Degeneration Industry Volume (K Unit), by Country 2024 & 2032
- Figure 121: South America Cartilage Degeneration Industry Revenue Share (%), by Country 2024 & 2032
- Figure 122: South America Cartilage Degeneration Industry Volume Share (%), by Country 2024 & 2032
List of Tables
- Table 1: Global Cartilage Degeneration Industry Revenue Million Forecast, by Region 2019 & 2032
- Table 2: Global Cartilage Degeneration Industry Volume K Unit Forecast, by Region 2019 & 2032
- Table 3: Global Cartilage Degeneration Industry Revenue Million Forecast, by Types of Cartilage 2019 & 2032
- Table 4: Global Cartilage Degeneration Industry Volume K Unit Forecast, by Types of Cartilage 2019 & 2032
- Table 5: Global Cartilage Degeneration Industry Revenue Million Forecast, by Treatment Modality 2019 & 2032
- Table 6: Global Cartilage Degeneration Industry Volume K Unit Forecast, by Treatment Modality 2019 & 2032
- Table 7: Global Cartilage Degeneration Industry Revenue Million Forecast, by Treatment Type 2019 & 2032
- Table 8: Global Cartilage Degeneration Industry Volume K Unit Forecast, by Treatment Type 2019 & 2032
- Table 9: Global Cartilage Degeneration Industry Revenue Million Forecast, by Application Site 2019 & 2032
- Table 10: Global Cartilage Degeneration Industry Volume K Unit Forecast, by Application Site 2019 & 2032
- Table 11: Global Cartilage Degeneration Industry Revenue Million Forecast, by Region 2019 & 2032
- Table 12: Global Cartilage Degeneration Industry Volume K Unit Forecast, by Region 2019 & 2032
- Table 13: Global Cartilage Degeneration Industry Revenue Million Forecast, by Country 2019 & 2032
- Table 14: Global Cartilage Degeneration Industry Volume K Unit Forecast, by Country 2019 & 2032
- Table 15: Global Cartilage Degeneration Industry Revenue Million Forecast, by Country 2019 & 2032
- Table 16: Global Cartilage Degeneration Industry Volume K Unit Forecast, by Country 2019 & 2032
- Table 17: Global Cartilage Degeneration Industry Revenue Million Forecast, by Country 2019 & 2032
- Table 18: Global Cartilage Degeneration Industry Volume K Unit Forecast, by Country 2019 & 2032
- Table 19: Global Cartilage Degeneration Industry Revenue Million Forecast, by Country 2019 & 2032
- Table 20: Global Cartilage Degeneration Industry Volume K Unit Forecast, by Country 2019 & 2032
- Table 21: Global Cartilage Degeneration Industry Revenue Million Forecast, by Country 2019 & 2032
- Table 22: Global Cartilage Degeneration Industry Volume K Unit Forecast, by Country 2019 & 2032
- Table 23: Global Cartilage Degeneration Industry Revenue Million Forecast, by Types of Cartilage 2019 & 2032
- Table 24: Global Cartilage Degeneration Industry Volume K Unit Forecast, by Types of Cartilage 2019 & 2032
- Table 25: Global Cartilage Degeneration Industry Revenue Million Forecast, by Treatment Modality 2019 & 2032
- Table 26: Global Cartilage Degeneration Industry Volume K Unit Forecast, by Treatment Modality 2019 & 2032
- Table 27: Global Cartilage Degeneration Industry Revenue Million Forecast, by Treatment Type 2019 & 2032
- Table 28: Global Cartilage Degeneration Industry Volume K Unit Forecast, by Treatment Type 2019 & 2032
- Table 29: Global Cartilage Degeneration Industry Revenue Million Forecast, by Application Site 2019 & 2032
- Table 30: Global Cartilage Degeneration Industry Volume K Unit Forecast, by Application Site 2019 & 2032
- Table 31: Global Cartilage Degeneration Industry Revenue Million Forecast, by Country 2019 & 2032
- Table 32: Global Cartilage Degeneration Industry Volume K Unit Forecast, by Country 2019 & 2032
- Table 33: United States Cartilage Degeneration Industry Revenue (Million) Forecast, by Application 2019 & 2032
- Table 34: United States Cartilage Degeneration Industry Volume (K Unit) Forecast, by Application 2019 & 2032
- Table 35: Canada Cartilage Degeneration Industry Revenue (Million) Forecast, by Application 2019 & 2032
- Table 36: Canada Cartilage Degeneration Industry Volume (K Unit) Forecast, by Application 2019 & 2032
- Table 37: Mexico Cartilage Degeneration Industry Revenue (Million) Forecast, by Application 2019 & 2032
- Table 38: Mexico Cartilage Degeneration Industry Volume (K Unit) Forecast, by Application 2019 & 2032
- Table 39: Global Cartilage Degeneration Industry Revenue Million Forecast, by Types of Cartilage 2019 & 2032
- Table 40: Global Cartilage Degeneration Industry Volume K Unit Forecast, by Types of Cartilage 2019 & 2032
- Table 41: Global Cartilage Degeneration Industry Revenue Million Forecast, by Treatment Modality 2019 & 2032
- Table 42: Global Cartilage Degeneration Industry Volume K Unit Forecast, by Treatment Modality 2019 & 2032
- Table 43: Global Cartilage Degeneration Industry Revenue Million Forecast, by Treatment Type 2019 & 2032
- Table 44: Global Cartilage Degeneration Industry Volume K Unit Forecast, by Treatment Type 2019 & 2032
- Table 45: Global Cartilage Degeneration Industry Revenue Million Forecast, by Application Site 2019 & 2032
- Table 46: Global Cartilage Degeneration Industry Volume K Unit Forecast, by Application Site 2019 & 2032
- Table 47: Global Cartilage Degeneration Industry Revenue Million Forecast, by Country 2019 & 2032
- Table 48: Global Cartilage Degeneration Industry Volume K Unit Forecast, by Country 2019 & 2032
- Table 49: Germany Cartilage Degeneration Industry Revenue (Million) Forecast, by Application 2019 & 2032
- Table 50: Germany Cartilage Degeneration Industry Volume (K Unit) Forecast, by Application 2019 & 2032
- Table 51: United Kingdom Cartilage Degeneration Industry Revenue (Million) Forecast, by Application 2019 & 2032
- Table 52: United Kingdom Cartilage Degeneration Industry Volume (K Unit) Forecast, by Application 2019 & 2032
- Table 53: France Cartilage Degeneration Industry Revenue (Million) Forecast, by Application 2019 & 2032
- Table 54: France Cartilage Degeneration Industry Volume (K Unit) Forecast, by Application 2019 & 2032
- Table 55: Italy Cartilage Degeneration Industry Revenue (Million) Forecast, by Application 2019 & 2032
- Table 56: Italy Cartilage Degeneration Industry Volume (K Unit) Forecast, by Application 2019 & 2032
- Table 57: Spain Cartilage Degeneration Industry Revenue (Million) Forecast, by Application 2019 & 2032
- Table 58: Spain Cartilage Degeneration Industry Volume (K Unit) Forecast, by Application 2019 & 2032
- Table 59: Rest of Europe Cartilage Degeneration Industry Revenue (Million) Forecast, by Application 2019 & 2032
- Table 60: Rest of Europe Cartilage Degeneration Industry Volume (K Unit) Forecast, by Application 2019 & 2032
- Table 61: Global Cartilage Degeneration Industry Revenue Million Forecast, by Types of Cartilage 2019 & 2032
- Table 62: Global Cartilage Degeneration Industry Volume K Unit Forecast, by Types of Cartilage 2019 & 2032
- Table 63: Global Cartilage Degeneration Industry Revenue Million Forecast, by Treatment Modality 2019 & 2032
- Table 64: Global Cartilage Degeneration Industry Volume K Unit Forecast, by Treatment Modality 2019 & 2032
- Table 65: Global Cartilage Degeneration Industry Revenue Million Forecast, by Treatment Type 2019 & 2032
- Table 66: Global Cartilage Degeneration Industry Volume K Unit Forecast, by Treatment Type 2019 & 2032
- Table 67: Global Cartilage Degeneration Industry Revenue Million Forecast, by Application Site 2019 & 2032
- Table 68: Global Cartilage Degeneration Industry Volume K Unit Forecast, by Application Site 2019 & 2032
- Table 69: Global Cartilage Degeneration Industry Revenue Million Forecast, by Country 2019 & 2032
- Table 70: Global Cartilage Degeneration Industry Volume K Unit Forecast, by Country 2019 & 2032
- Table 71: China Cartilage Degeneration Industry Revenue (Million) Forecast, by Application 2019 & 2032
- Table 72: China Cartilage Degeneration Industry Volume (K Unit) Forecast, by Application 2019 & 2032
- Table 73: Japan Cartilage Degeneration Industry Revenue (Million) Forecast, by Application 2019 & 2032
- Table 74: Japan Cartilage Degeneration Industry Volume (K Unit) Forecast, by Application 2019 & 2032
- Table 75: India Cartilage Degeneration Industry Revenue (Million) Forecast, by Application 2019 & 2032
- Table 76: India Cartilage Degeneration Industry Volume (K Unit) Forecast, by Application 2019 & 2032
- Table 77: Australia Cartilage Degeneration Industry Revenue (Million) Forecast, by Application 2019 & 2032
- Table 78: Australia Cartilage Degeneration Industry Volume (K Unit) Forecast, by Application 2019 & 2032
- Table 79: South Korea Cartilage Degeneration Industry Revenue (Million) Forecast, by Application 2019 & 2032
- Table 80: South Korea Cartilage Degeneration Industry Volume (K Unit) Forecast, by Application 2019 & 2032
- Table 81: Rest of Asia Pacific Cartilage Degeneration Industry Revenue (Million) Forecast, by Application 2019 & 2032
- Table 82: Rest of Asia Pacific Cartilage Degeneration Industry Volume (K Unit) Forecast, by Application 2019 & 2032
- Table 83: Global Cartilage Degeneration Industry Revenue Million Forecast, by Types of Cartilage 2019 & 2032
- Table 84: Global Cartilage Degeneration Industry Volume K Unit Forecast, by Types of Cartilage 2019 & 2032
- Table 85: Global Cartilage Degeneration Industry Revenue Million Forecast, by Treatment Modality 2019 & 2032
- Table 86: Global Cartilage Degeneration Industry Volume K Unit Forecast, by Treatment Modality 2019 & 2032
- Table 87: Global Cartilage Degeneration Industry Revenue Million Forecast, by Treatment Type 2019 & 2032
- Table 88: Global Cartilage Degeneration Industry Volume K Unit Forecast, by Treatment Type 2019 & 2032
- Table 89: Global Cartilage Degeneration Industry Revenue Million Forecast, by Application Site 2019 & 2032
- Table 90: Global Cartilage Degeneration Industry Volume K Unit Forecast, by Application Site 2019 & 2032
- Table 91: Global Cartilage Degeneration Industry Revenue Million Forecast, by Country 2019 & 2032
- Table 92: Global Cartilage Degeneration Industry Volume K Unit Forecast, by Country 2019 & 2032
- Table 93: GCC Cartilage Degeneration Industry Revenue (Million) Forecast, by Application 2019 & 2032
- Table 94: GCC Cartilage Degeneration Industry Volume (K Unit) Forecast, by Application 2019 & 2032
- Table 95: South Africa Cartilage Degeneration Industry Revenue (Million) Forecast, by Application 2019 & 2032
- Table 96: South Africa Cartilage Degeneration Industry Volume (K Unit) Forecast, by Application 2019 & 2032
- Table 97: Rest of Middle East and Africa Cartilage Degeneration Industry Revenue (Million) Forecast, by Application 2019 & 2032
- Table 98: Rest of Middle East and Africa Cartilage Degeneration Industry Volume (K Unit) Forecast, by Application 2019 & 2032
- Table 99: Global Cartilage Degeneration Industry Revenue Million Forecast, by Types of Cartilage 2019 & 2032
- Table 100: Global Cartilage Degeneration Industry Volume K Unit Forecast, by Types of Cartilage 2019 & 2032
- Table 101: Global Cartilage Degeneration Industry Revenue Million Forecast, by Treatment Modality 2019 & 2032
- Table 102: Global Cartilage Degeneration Industry Volume K Unit Forecast, by Treatment Modality 2019 & 2032
- Table 103: Global Cartilage Degeneration Industry Revenue Million Forecast, by Treatment Type 2019 & 2032
- Table 104: Global Cartilage Degeneration Industry Volume K Unit Forecast, by Treatment Type 2019 & 2032
- Table 105: Global Cartilage Degeneration Industry Revenue Million Forecast, by Application Site 2019 & 2032
- Table 106: Global Cartilage Degeneration Industry Volume K Unit Forecast, by Application Site 2019 & 2032
- Table 107: Global Cartilage Degeneration Industry Revenue Million Forecast, by Country 2019 & 2032
- Table 108: Global Cartilage Degeneration Industry Volume K Unit Forecast, by Country 2019 & 2032
- Table 109: Brazil Cartilage Degeneration Industry Revenue (Million) Forecast, by Application 2019 & 2032
- Table 110: Brazil Cartilage Degeneration Industry Volume (K Unit) Forecast, by Application 2019 & 2032
- Table 111: Argentina Cartilage Degeneration Industry Revenue (Million) Forecast, by Application 2019 & 2032
- Table 112: Argentina Cartilage Degeneration Industry Volume (K Unit) Forecast, by Application 2019 & 2032
- Table 113: Rest of South America Cartilage Degeneration Industry Revenue (Million) Forecast, by Application 2019 & 2032
- Table 114: Rest of South America Cartilage Degeneration Industry Volume (K Unit) Forecast, by Application 2019 & 2032
Frequently Asked Questions
1. What is the projected Compound Annual Growth Rate (CAGR) of the Cartilage Degeneration Industry?
The projected CAGR is approximately 8.00%.
2. Which companies are prominent players in the Cartilage Degeneration Industry?
Key companies in the market include Arthrex Inc, Zimmer Biomet, Cyfuse Biomedical K K, Geistlich Pharma AG, Anika Therapeutics Inc, Vericel Corporation, Johnson & Johnson, B Braun Melsungen AG, Stryker Corporation, Smith & Nephew plc.
3. What are the main segments of the Cartilage Degeneration Industry?
The market segments include Types of Cartilage, Treatment Modality, Treatment Type, Application Site.
4. Can you provide details about the market size?
The market size is estimated to be USD XX Million as of 2022.
5. What are some drivers contributing to market growth?
Rising Prevalence of the Joints and Bones Disorders around the World and Increasing Geriatric Population; Technological Advancements in Cartilage Repair/Regeneration; Increasing Number of Injuries and Accidents.
6. What are the notable trends driving market growth?
Knee Application Segment is Expected to Hold a Major Share in the Cartilage Repair/Regeneration Market.
7. Are there any restraints impacting market growth?
High Costs of Cartilage Repair Procedures; Regulatory and Reimbursement Issues.
8. Can you provide examples of recent developments in the market?
In July 2022, Orthox received Medicines and Healthcare products Regulatory Agency (MHRA) authorisation for a clinical trial of knee cartilage repair FibroFix product platform.
9. What pricing options are available for accessing the report?
Pricing options include single-user, multi-user, and enterprise licenses priced at USD 4750, USD 5250, and USD 8750 respectively.
10. Is the market size provided in terms of value or volume?
The market size is provided in terms of value, measured in Million and volume, measured in K Unit.
11. Are there any specific market keywords associated with the report?
Yes, the market keyword associated with the report is "Cartilage Degeneration Industry," which aids in identifying and referencing the specific market segment covered.
12. How do I determine which pricing option suits my needs best?
The pricing options vary based on user requirements and access needs. Individual users may opt for single-user licenses, while businesses requiring broader access may choose multi-user or enterprise licenses for cost-effective access to the report.
13. Are there any additional resources or data provided in the Cartilage Degeneration Industry report?
While the report offers comprehensive insights, it's advisable to review the specific contents or supplementary materials provided to ascertain if additional resources or data are available.
14. How can I stay updated on further developments or reports in the Cartilage Degeneration Industry?
To stay informed about further developments, trends, and reports in the Cartilage Degeneration Industry, consider subscribing to industry newsletters, following relevant companies and organizations, or regularly checking reputable industry news sources and publications.
Methodology
Step 1 - Identification of Relevant Samples Size from Population Database


Step 2 - Approaches for Defining Global Market Size (Value, Volume* & Price*)

Note*: In applicable scenarios
Step 3 - Data Sources
Primary Research
- Web Analytics
- Survey Reports
- Research Institute
- Latest Research Reports
- Opinion Leaders
Secondary Research
- Annual Reports
- White Paper
- Latest Press Release
- Industry Association
- Paid Database
- Investor Presentations

Step 4 - Data Triangulation
Involves using different sources of information in order to increase the validity of a study
These sources are likely to be stakeholders in a program - participants, other researchers, program staff, other community members, and so on.
Then we put all data in single framework & apply various statistical tools to find out the dynamic on the market.
During the analysis stage, feedback from the stakeholder groups would be compared to determine areas of agreement as well as areas of divergence
