

Key Insights
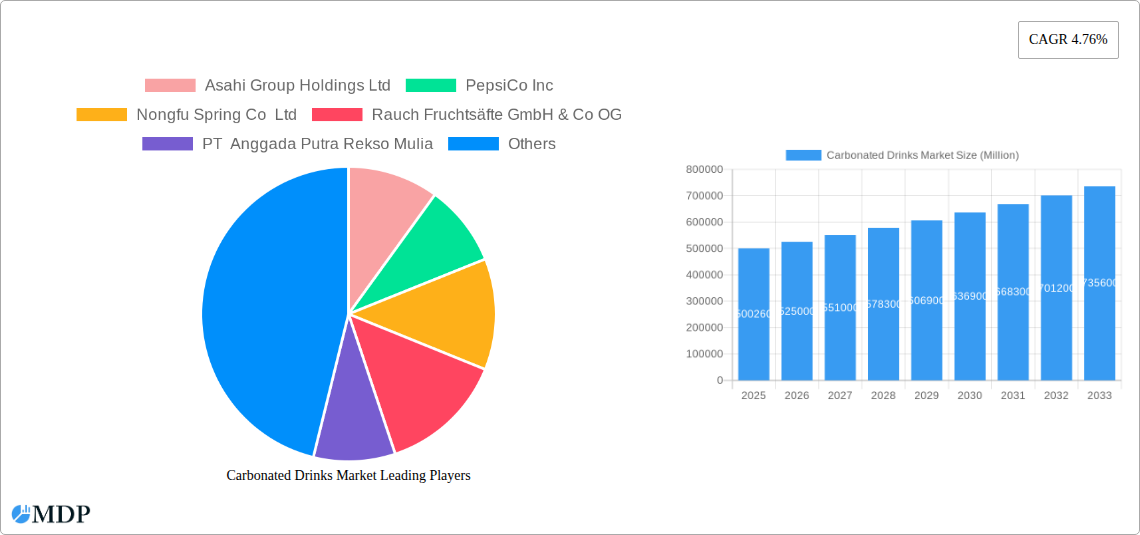
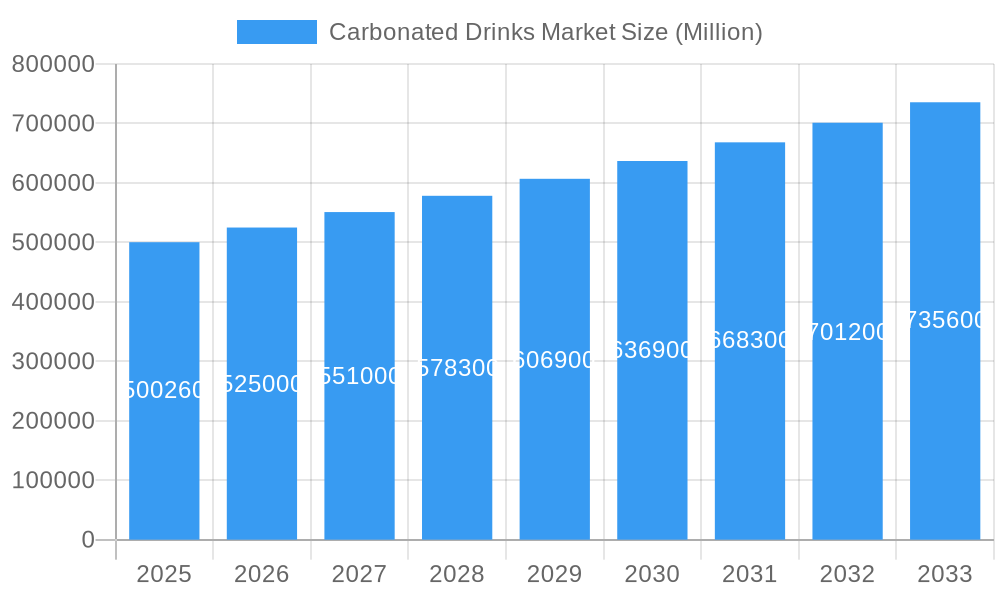
The global carbonated drinks market, valued at $500.26 billion in 2025, is projected to experience robust growth, driven by several key factors. The 4.76% CAGR indicates a significant expansion over the forecast period (2025-2033). Consumer preferences are shifting, with growing demand for healthier options like diet colas and fruit-flavored carbonates, counterbalancing the persistent popularity of standard cola. This diversification is reflected in the market segmentation, with PET bottles and cans dominating packaging, while both on-trade (restaurants, bars) and off-trade (retail stores) distribution channels contribute significantly to sales. The market's geographical spread is substantial, with North America and Asia Pacific expected to lead, fueled by large populations and established consumer bases. However, increasing health consciousness and growing awareness of the negative health impacts of excessive sugar consumption pose challenges. This necessitates innovation in product formulations and marketing strategies. Successful players will focus on healthier ingredients, sustainable packaging, and targeted marketing campaigns addressing diverse consumer segments. Competition is intense, with major multinational corporations like Coca-Cola and PepsiCo alongside regional players vying for market share. Future growth will likely hinge on successfully navigating consumer health concerns and adapting to evolving preferences while maintaining cost-effectiveness and efficient supply chains.
Carbonated Drinks Market Market Size (In Billion)
The competitive landscape is defined by a mix of established global giants and regional players. Companies like Coca-Cola and PepsiCo leverage strong brand recognition and extensive distribution networks, while regional players capitalize on local tastes and preferences. Innovation in product development is crucial, with a focus on healthier alternatives, functional drinks, and sustainable packaging to appeal to the evolving consumer base. Furthermore, effective marketing strategies tailored to specific regional markets and demographic groups are paramount for sustaining growth. The market's future success will depend on successfully balancing the demands of health-conscious consumers with the need for profitability and sustainable practices throughout the value chain. Expansion into emerging markets and the adoption of digital marketing techniques will also play a significant role in shaping the competitive landscape and driving future growth.
Carbonated Drinks Market Company Market Share
Carbonated Drinks Market: A Comprehensive Report (2019-2033)
This comprehensive report provides an in-depth analysis of the global carbonated drinks market, offering invaluable insights for stakeholders seeking to navigate this dynamic industry. Covering the period 2019-2033, with a focus on 2025, this report unveils key trends, growth drivers, challenges, and opportunities within this multi-billion dollar sector. The report incorporates meticulous market sizing, segmentation, and competitive analysis, providing actionable intelligence for informed decision-making.
Carbonated Drinks Market Dynamics & Concentration
The global carbonated drinks market, valued at xx Million in 2024, exhibits a moderately concentrated landscape, with key players such as Coca-Cola, PepsiCo, and Asahi Group Holdings commanding significant market share. The market’s dynamics are shaped by several factors:
- Innovation: Continuous innovation in flavors, packaging, and health-conscious formulations drives market growth. The rise of functional beverages and sugar-free options is a key trend.
- Regulatory Framework: Government regulations regarding sugar content and labeling significantly impact product development and marketing strategies. Fluctuations in excise duties and taxes also influence market dynamics.
- Product Substitutes: The market faces competition from healthier alternatives like bottled water, juices, and functional drinks. This competitive pressure fuels innovation in the carbonated drinks sector.
- End-User Trends: Shifting consumer preferences towards healthier options, sustainability concerns, and premiumization influence purchasing decisions and product development.
- M&A Activity: The carbonated drinks market has witnessed a moderate level of mergers and acquisitions, with xx deals recorded between 2019 and 2024. These activities contribute to market consolidation and reshape the competitive landscape.
Market concentration is further analyzed through the Herfindahl-Hirschman Index (HHI) and market share data for the top ten players, revealing the degree of competition and potential for future consolidation.
Carbonated Drinks Market Industry Trends & Analysis
The global carbonated drinks market demonstrates a robust growth trajectory, with a projected CAGR of xx% during the forecast period (2025-2033). Several factors contribute to this growth:
The market's growth is primarily driven by factors such as rising disposable incomes, particularly in developing economies, coupled with increasing urbanization and changing lifestyles. The growing popularity of convenient, ready-to-drink beverages further propels market expansion. Technological advancements in packaging and production efficiency contribute to cost optimization and increased product availability. However, the market also grapples with challenges stemming from health concerns surrounding sugar consumption and growing environmental awareness. The market penetration of sugar-free and low-calorie options is steadily increasing, reflecting consumer health consciousness. Competitive dynamics are shaped by aggressive marketing strategies, product diversification, and strategic partnerships. The evolving consumer landscape necessitates continuous adaptation and innovation to maintain market relevance and competitiveness.
Leading Markets & Segments in Carbonated Drinks Market
The global carbonated drinks market is a dynamic landscape with distinct regional strengths and evolving consumer preferences. Currently, North America holds a dominant position, fueled by deeply ingrained consumption habits, pervasive brand recognition, and highly efficient distribution infrastructures. Following closely is the Asia-Pacific region, experiencing robust expansion driven by rapid economic development, a growing middle class with increased disposable incomes, and a sheer increase in population. Europe, while a mature market with well-established brands, faces a more complex environment. It navigates challenges posed by increasing health consciousness among consumers and evolving regulatory frameworks, prompting a strategic shift towards healthier alternatives.
Segment-wise, the standard cola segment continues to command the largest market share, a testament to its enduring appeal, extensive availability, and deep-rooted brand loyalty. Fruit-flavored carbonates are a strong contender, witnessing rising popularity due to their diverse flavor profiles that cater to a broader spectrum of consumer tastes and preferences. In terms of packaging, PET bottles remain the preferred choice, largely attributed to their cost-effectiveness, light weight, and convenience for both manufacturers and consumers. The off-trade channel, encompassing supermarkets and convenience stores, significantly outperforms the on-trade segment in terms of market share, offering greater accessibility and convenience for a wider consumer base.
Key factors underpinning the dominance of these segments include:
- North America: High per capita consumption rates, an extensive network of established brands, and sophisticated distribution channels.
- Asia-Pacific: Significant drivers include rapid economic growth, a rising disposable income, and a burgeoning, young population with evolving beverage choices.
- Europe: Characterized by a mature market with strong brand heritage, yet influenced by health and wellness trends and regulatory pressures impacting traditional offerings.
- Standard Cola: Enduring brand loyalty, ubiquitous availability across all retail points, and a long history of market penetration.
- Fruit Flavored Carbonates: Growing consumer demand for a wider variety of appealing flavors, offering a refreshing alternative to traditional options.
- PET Bottles: Their cost-effectiveness, inherent lightness, recyclability, and ease of handling make them an ideal choice for mass distribution.
- Off-trade Distribution: The convenience of purchasing from readily accessible retail outlets like supermarkets and convenience stores directly contributes to its market dominance.
Carbonated Drinks Market Product Developments
The carbonated drinks sector is undergoing a significant transformation, driven by a confluence of evolving consumer expectations and heightened awareness regarding health and well-being. This evolution is prominently reflected in the surge of sugar-free and low-calorie alternatives, catering to the growing demand for healthier choices. Furthermore, the integration of functional ingredients, such as vitamins, minerals, and natural extracts, is creating a new category of beverages designed to offer added health benefits. Innovation in flavor profiles continues to be a key differentiator, with companies experimenting with novel and exotic tastes to capture consumer interest. Simultaneously, advancements in packaging technology are prioritizing sustainability and environmental responsibility, with a focus on eco-friendly and recyclable materials. This not only appeals to environmentally conscious consumers but also enhances brand image and market competitiveness. In parallel, a strategic emphasis on personalized marketing strategies is enabling companies to connect with specific consumer demographics, offering tailored products and resonant messaging that fosters stronger brand engagement and loyalty.
Key Drivers of Carbonated Drinks Market Growth
Several factors fuel the growth of the carbonated drinks market:
- Technological advancements: Improved production techniques, sustainable packaging solutions.
- Economic growth: Increasing disposable incomes in developing economies drive consumption.
- Favorable regulatory environments: Supportive policies in certain regions promote market expansion.
Challenges in the Carbonated Drinks Market
The carbonated drinks market faces significant challenges:
- Health concerns: Growing awareness of sugar's negative health impacts leads to reduced consumption.
- Supply chain disruptions: Global events and logistical issues impact production and distribution.
- Intense competition: Established and emerging players vie for market share, intensifying competition. The negative impact on profits is estimated to be xx Million annually due to these challenges.
Emerging Opportunities in Carbonated Drinks Market
Several opportunities exist for growth:
- Premiumization: Consumers increasingly seek premium-priced, high-quality beverages, presenting an opportunity for innovative product development and higher profit margins.
- Functional beverages: Growing demand for drinks with added health benefits, creating a niche market for specialized products.
- Sustainable packaging: The adoption of eco-friendly packaging materials strengthens the brand image and appeals to environmentally conscious consumers.
Leading Players in the Carbonated Drinks Market Sector
- Asahi Group Holdings Ltd
- PepsiCo Inc
- Nongfu Spring Co Ltd
- Rauch Fruchtsäfte GmbH & Co OG
- PT Anggada Putra Rekso Mulia
- Suntory Holdings Limited
- Keurig Dr Pepper Inc
- National Beverage Corp
- Refresco Group BV
- The Coca-Cola Company
- Hangzhou Wahaha Group Co Ltd
- Kirin Holdings Company Limited
- Britvic PLC
- Tingyi (Cayman Islands) Holding Corporation
- Thai Beverages PCL
Key Milestones in Carbonated Drinks Market Industry
- January 2023: PepsiCo Inc. launched Starry, a lemon-lime flavored soda in regular and zero-sugar versions. This launch reflects the growing demand for healthier options.
- October 2023: Coca-Cola launched Coca-Cola Y3000, an AI-created limited-edition flavor. This innovative approach showcases the company's commitment to product diversification and appealing to younger demographics.
- December 2023: Kirin launched Tokusei Ginger Ale Sour and sugar-free teas (black tea and Hojicha) in Japan. This launch highlights the increasing consumer preference for sugar-free beverages due to health consciousness.
Strategic Outlook for Carbonated Drinks Market
The carbonated drinks market is anticipated to experience consistent and robust growth in the coming years. This expansion will be primarily fueled by an ongoing commitment to product innovation, encompassing the development of healthier formulations, unique flavor combinations, and functional beverage options. Strategic partnerships and collaborations will also play a pivotal role in market expansion, enabling companies to leverage each other's strengths and reach new consumer bases. Furthermore, a significant focus will be placed on expansion into emerging markets, where the potential for growth is substantial due to evolving consumer preferences and increasing disposable incomes. Companies that proactively embrace healthier formulations, prioritize sustainable practices in their operations and packaging, and effectively implement personalized marketing strategies are best positioned to capture a competitive advantage. Ultimately, the future trajectory of the carbonated drinks market will be shaped by its ability to adeptly respond to changing consumer demands and skillfully leverage technological advancements to not only enhance product offerings but also to champion environmental responsibility.
Carbonated Drinks Market Segmentation
-
1. Soft Drink Type
- 1.1. Diet Cola
- 1.2. Fruit Flavored Carbonates
- 1.3. Standard Cola
- 1.4. Other Types
-
2. Packaging Type
- 2.1. Disposable Cups
- 2.2. Glass Bottles
- 2.3. Metal Can
- 2.4. PET Bottles
-
3. Distribution Channel
-
3.1. Off-trade
- 3.1.1. Convenience Stores
- 3.1.2. Online Retail
- 3.1.3. Supermarket/Hypermarket
- 3.1.4. Others
- 3.2. On-trade
-
3.1. Off-trade
Carbonated Drinks Market Segmentation By Geography
-
1. North America
- 1.1. United States
- 1.2. Canada
- 1.3. Mexico
-
2. South America
- 2.1. Brazil
- 2.2. Argentina
- 2.3. Rest of South America
-
3. Europe
- 3.1. United Kingdom
- 3.2. Germany
- 3.3. France
- 3.4. Italy
- 3.5. Spain
- 3.6. Russia
- 3.7. Benelux
- 3.8. Nordics
- 3.9. Rest of Europe
-
4. Middle East & Africa
- 4.1. Turkey
- 4.2. Israel
- 4.3. GCC
- 4.4. North Africa
- 4.5. South Africa
- 4.6. Rest of Middle East & Africa
-
5. Asia Pacific
- 5.1. China
- 5.2. India
- 5.3. Japan
- 5.4. South Korea
- 5.5. ASEAN
- 5.6. Oceania
- 5.7. Rest of Asia Pacific
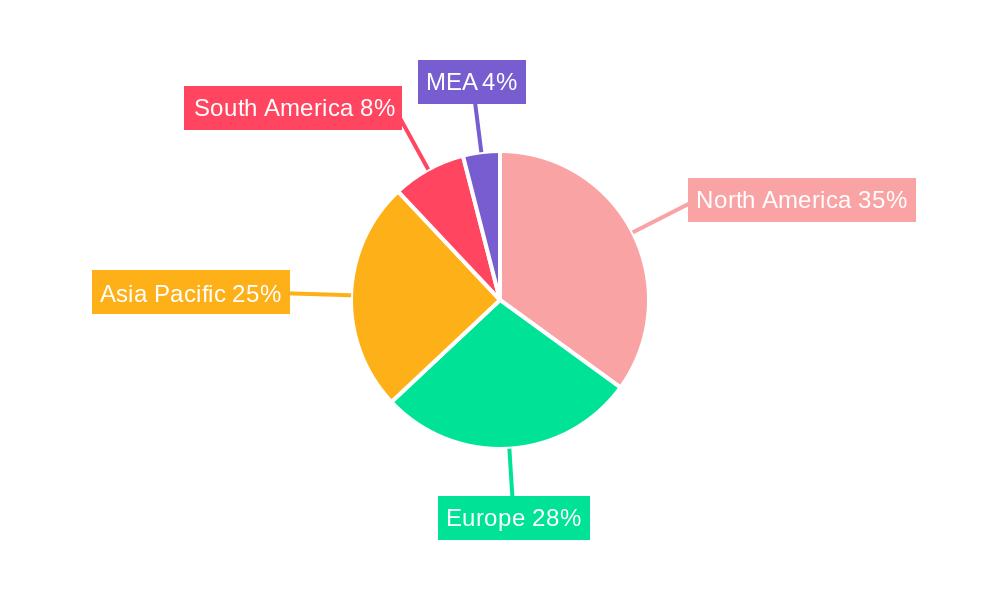
Carbonated Drinks Market Regional Market Share
Geographic Coverage of Carbonated Drinks Market
Carbonated Drinks Market REPORT HIGHLIGHTS
| Aspects | Details |
|---|---|
| Study Period | 2020-2034 |
| Base Year | 2025 |
| Estimated Year | 2026 |
| Forecast Period | 2026-2034 |
| Historical Period | 2020-2025 |
| Growth Rate | CAGR of 4.76% from 2020-2034 |
| Segmentation |
|
Table of Contents
- 1. Introduction
- 1.1. Research Scope
- 1.2. Market Segmentation
- 1.3. Research Methodology
- 1.4. Definitions and Assumptions
- 2. Executive Summary
- 2.1. Introduction
- 3. Market Dynamics
- 3.1. Introduction
- 3.2. Market Drivers
- 3.2.1. Growing preference for low alcoholic beer by volume (abv) or non-alcoholic beers; Rising number of breweries leading to high prominence of craft beer
- 3.3. Market Restrains
- 3.3.1. Demand for other alcoholic beverages
- 3.4. Market Trends
- 3.4.1. OTHER KEY INDUSTRY TRENDS COVERED IN THE REPORT
- 4. Market Factor Analysis
- 4.1. Porters Five Forces
- 4.2. Supply/Value Chain
- 4.3. PESTEL analysis
- 4.4. Market Entropy
- 4.5. Patent/Trademark Analysis
- 5. Global Carbonated Drinks Market Analysis, Insights and Forecast, 2020-2032
- 5.1. Market Analysis, Insights and Forecast - by Soft Drink Type
- 5.1.1. Diet Cola
- 5.1.2. Fruit Flavored Carbonates
- 5.1.3. Standard Cola
- 5.1.4. Other Types
- 5.2. Market Analysis, Insights and Forecast - by Packaging Type
- 5.2.1. Disposable Cups
- 5.2.2. Glass Bottles
- 5.2.3. Metal Can
- 5.2.4. PET Bottles
- 5.3. Market Analysis, Insights and Forecast - by Distribution Channel
- 5.3.1. Off-trade
- 5.3.1.1. Convenience Stores
- 5.3.1.2. Online Retail
- 5.3.1.3. Supermarket/Hypermarket
- 5.3.1.4. Others
- 5.3.2. On-trade
- 5.3.1. Off-trade
- 5.4. Market Analysis, Insights and Forecast - by Region
- 5.4.1. North America
- 5.4.2. South America
- 5.4.3. Europe
- 5.4.4. Middle East & Africa
- 5.4.5. Asia Pacific
- 5.1. Market Analysis, Insights and Forecast - by Soft Drink Type
- 6. North America Carbonated Drinks Market Analysis, Insights and Forecast, 2020-2032
- 6.1. Market Analysis, Insights and Forecast - by Soft Drink Type
- 6.1.1. Diet Cola
- 6.1.2. Fruit Flavored Carbonates
- 6.1.3. Standard Cola
- 6.1.4. Other Types
- 6.2. Market Analysis, Insights and Forecast - by Packaging Type
- 6.2.1. Disposable Cups
- 6.2.2. Glass Bottles
- 6.2.3. Metal Can
- 6.2.4. PET Bottles
- 6.3. Market Analysis, Insights and Forecast - by Distribution Channel
- 6.3.1. Off-trade
- 6.3.1.1. Convenience Stores
- 6.3.1.2. Online Retail
- 6.3.1.3. Supermarket/Hypermarket
- 6.3.1.4. Others
- 6.3.2. On-trade
- 6.3.1. Off-trade
- 6.1. Market Analysis, Insights and Forecast - by Soft Drink Type
- 7. South America Carbonated Drinks Market Analysis, Insights and Forecast, 2020-2032
- 7.1. Market Analysis, Insights and Forecast - by Soft Drink Type
- 7.1.1. Diet Cola
- 7.1.2. Fruit Flavored Carbonates
- 7.1.3. Standard Cola
- 7.1.4. Other Types
- 7.2. Market Analysis, Insights and Forecast - by Packaging Type
- 7.2.1. Disposable Cups
- 7.2.2. Glass Bottles
- 7.2.3. Metal Can
- 7.2.4. PET Bottles
- 7.3. Market Analysis, Insights and Forecast - by Distribution Channel
- 7.3.1. Off-trade
- 7.3.1.1. Convenience Stores
- 7.3.1.2. Online Retail
- 7.3.1.3. Supermarket/Hypermarket
- 7.3.1.4. Others
- 7.3.2. On-trade
- 7.3.1. Off-trade
- 7.1. Market Analysis, Insights and Forecast - by Soft Drink Type
- 8. Europe Carbonated Drinks Market Analysis, Insights and Forecast, 2020-2032
- 8.1. Market Analysis, Insights and Forecast - by Soft Drink Type
- 8.1.1. Diet Cola
- 8.1.2. Fruit Flavored Carbonates
- 8.1.3. Standard Cola
- 8.1.4. Other Types
- 8.2. Market Analysis, Insights and Forecast - by Packaging Type
- 8.2.1. Disposable Cups
- 8.2.2. Glass Bottles
- 8.2.3. Metal Can
- 8.2.4. PET Bottles
- 8.3. Market Analysis, Insights and Forecast - by Distribution Channel
- 8.3.1. Off-trade
- 8.3.1.1. Convenience Stores
- 8.3.1.2. Online Retail
- 8.3.1.3. Supermarket/Hypermarket
- 8.3.1.4. Others
- 8.3.2. On-trade
- 8.3.1. Off-trade
- 8.1. Market Analysis, Insights and Forecast - by Soft Drink Type
- 9. Middle East & Africa Carbonated Drinks Market Analysis, Insights and Forecast, 2020-2032
- 9.1. Market Analysis, Insights and Forecast - by Soft Drink Type
- 9.1.1. Diet Cola
- 9.1.2. Fruit Flavored Carbonates
- 9.1.3. Standard Cola
- 9.1.4. Other Types
- 9.2. Market Analysis, Insights and Forecast - by Packaging Type
- 9.2.1. Disposable Cups
- 9.2.2. Glass Bottles
- 9.2.3. Metal Can
- 9.2.4. PET Bottles
- 9.3. Market Analysis, Insights and Forecast - by Distribution Channel
- 9.3.1. Off-trade
- 9.3.1.1. Convenience Stores
- 9.3.1.2. Online Retail
- 9.3.1.3. Supermarket/Hypermarket
- 9.3.1.4. Others
- 9.3.2. On-trade
- 9.3.1. Off-trade
- 9.1. Market Analysis, Insights and Forecast - by Soft Drink Type
- 10. Asia Pacific Carbonated Drinks Market Analysis, Insights and Forecast, 2020-2032
- 10.1. Market Analysis, Insights and Forecast - by Soft Drink Type
- 10.1.1. Diet Cola
- 10.1.2. Fruit Flavored Carbonates
- 10.1.3. Standard Cola
- 10.1.4. Other Types
- 10.2. Market Analysis, Insights and Forecast - by Packaging Type
- 10.2.1. Disposable Cups
- 10.2.2. Glass Bottles
- 10.2.3. Metal Can
- 10.2.4. PET Bottles
- 10.3. Market Analysis, Insights and Forecast - by Distribution Channel
- 10.3.1. Off-trade
- 10.3.1.1. Convenience Stores
- 10.3.1.2. Online Retail
- 10.3.1.3. Supermarket/Hypermarket
- 10.3.1.4. Others
- 10.3.2. On-trade
- 10.3.1. Off-trade
- 10.1. Market Analysis, Insights and Forecast - by Soft Drink Type
- 11. Competitive Analysis
- 11.1. Global Market Share Analysis 2025
- 11.2. Company Profiles
- 11.2.1 Asahi Group Holdings Ltd
- 11.2.1.1. Overview
- 11.2.1.2. Products
- 11.2.1.3. SWOT Analysis
- 11.2.1.4. Recent Developments
- 11.2.1.5. Financials (Based on Availability)
- 11.2.2 PepsiCo Inc
- 11.2.2.1. Overview
- 11.2.2.2. Products
- 11.2.2.3. SWOT Analysis
- 11.2.2.4. Recent Developments
- 11.2.2.5. Financials (Based on Availability)
- 11.2.3 Nongfu Spring Co Ltd
- 11.2.3.1. Overview
- 11.2.3.2. Products
- 11.2.3.3. SWOT Analysis
- 11.2.3.4. Recent Developments
- 11.2.3.5. Financials (Based on Availability)
- 11.2.4 Rauch Fruchtsäfte GmbH & Co OG
- 11.2.4.1. Overview
- 11.2.4.2. Products
- 11.2.4.3. SWOT Analysis
- 11.2.4.4. Recent Developments
- 11.2.4.5. Financials (Based on Availability)
- 11.2.5 PT Anggada Putra Rekso Mulia
- 11.2.5.1. Overview
- 11.2.5.2. Products
- 11.2.5.3. SWOT Analysis
- 11.2.5.4. Recent Developments
- 11.2.5.5. Financials (Based on Availability)
- 11.2.6 Suntory Holdings Limited
- 11.2.6.1. Overview
- 11.2.6.2. Products
- 11.2.6.3. SWOT Analysis
- 11.2.6.4. Recent Developments
- 11.2.6.5. Financials (Based on Availability)
- 11.2.7 Keurig Dr Pepper Inc
- 11.2.7.1. Overview
- 11.2.7.2. Products
- 11.2.7.3. SWOT Analysis
- 11.2.7.4. Recent Developments
- 11.2.7.5. Financials (Based on Availability)
- 11.2.8 National Beverage Corp
- 11.2.8.1. Overview
- 11.2.8.2. Products
- 11.2.8.3. SWOT Analysis
- 11.2.8.4. Recent Developments
- 11.2.8.5. Financials (Based on Availability)
- 11.2.9 Refresco Group BV
- 11.2.9.1. Overview
- 11.2.9.2. Products
- 11.2.9.3. SWOT Analysis
- 11.2.9.4. Recent Developments
- 11.2.9.5. Financials (Based on Availability)
- 11.2.10 The Coca-Cola Company
- 11.2.10.1. Overview
- 11.2.10.2. Products
- 11.2.10.3. SWOT Analysis
- 11.2.10.4. Recent Developments
- 11.2.10.5. Financials (Based on Availability)
- 11.2.11 Hangzhou Wahaha Group Co Ltd
- 11.2.11.1. Overview
- 11.2.11.2. Products
- 11.2.11.3. SWOT Analysis
- 11.2.11.4. Recent Developments
- 11.2.11.5. Financials (Based on Availability)
- 11.2.12 Kirin Holdings Company Limited
- 11.2.12.1. Overview
- 11.2.12.2. Products
- 11.2.12.3. SWOT Analysis
- 11.2.12.4. Recent Developments
- 11.2.12.5. Financials (Based on Availability)
- 11.2.13 Britvic PLC
- 11.2.13.1. Overview
- 11.2.13.2. Products
- 11.2.13.3. SWOT Analysis
- 11.2.13.4. Recent Developments
- 11.2.13.5. Financials (Based on Availability)
- 11.2.14 Tingyi (Cayman Islands) Holding Corporatio
- 11.2.14.1. Overview
- 11.2.14.2. Products
- 11.2.14.3. SWOT Analysis
- 11.2.14.4. Recent Developments
- 11.2.14.5. Financials (Based on Availability)
- 11.2.15 Thai Beverages PCL
- 11.2.15.1. Overview
- 11.2.15.2. Products
- 11.2.15.3. SWOT Analysis
- 11.2.15.4. Recent Developments
- 11.2.15.5. Financials (Based on Availability)
- 11.2.1 Asahi Group Holdings Ltd
List of Figures
- Figure 1: Global Carbonated Drinks Market Revenue Breakdown (Million, %) by Region 2025 & 2033
- Figure 2: Global Carbonated Drinks Market Volume Breakdown (liter , %) by Region 2025 & 2033
- Figure 3: North America Carbonated Drinks Market Revenue (Million), by Soft Drink Type 2025 & 2033
- Figure 4: North America Carbonated Drinks Market Volume (liter ), by Soft Drink Type 2025 & 2033
- Figure 5: North America Carbonated Drinks Market Revenue Share (%), by Soft Drink Type 2025 & 2033
- Figure 6: North America Carbonated Drinks Market Volume Share (%), by Soft Drink Type 2025 & 2033
- Figure 7: North America Carbonated Drinks Market Revenue (Million), by Packaging Type 2025 & 2033
- Figure 8: North America Carbonated Drinks Market Volume (liter ), by Packaging Type 2025 & 2033
- Figure 9: North America Carbonated Drinks Market Revenue Share (%), by Packaging Type 2025 & 2033
- Figure 10: North America Carbonated Drinks Market Volume Share (%), by Packaging Type 2025 & 2033
- Figure 11: North America Carbonated Drinks Market Revenue (Million), by Distribution Channel 2025 & 2033
- Figure 12: North America Carbonated Drinks Market Volume (liter ), by Distribution Channel 2025 & 2033
- Figure 13: North America Carbonated Drinks Market Revenue Share (%), by Distribution Channel 2025 & 2033
- Figure 14: North America Carbonated Drinks Market Volume Share (%), by Distribution Channel 2025 & 2033
- Figure 15: North America Carbonated Drinks Market Revenue (Million), by Country 2025 & 2033
- Figure 16: North America Carbonated Drinks Market Volume (liter ), by Country 2025 & 2033
- Figure 17: North America Carbonated Drinks Market Revenue Share (%), by Country 2025 & 2033
- Figure 18: North America Carbonated Drinks Market Volume Share (%), by Country 2025 & 2033
- Figure 19: South America Carbonated Drinks Market Revenue (Million), by Soft Drink Type 2025 & 2033
- Figure 20: South America Carbonated Drinks Market Volume (liter ), by Soft Drink Type 2025 & 2033
- Figure 21: South America Carbonated Drinks Market Revenue Share (%), by Soft Drink Type 2025 & 2033
- Figure 22: South America Carbonated Drinks Market Volume Share (%), by Soft Drink Type 2025 & 2033
- Figure 23: South America Carbonated Drinks Market Revenue (Million), by Packaging Type 2025 & 2033
- Figure 24: South America Carbonated Drinks Market Volume (liter ), by Packaging Type 2025 & 2033
- Figure 25: South America Carbonated Drinks Market Revenue Share (%), by Packaging Type 2025 & 2033
- Figure 26: South America Carbonated Drinks Market Volume Share (%), by Packaging Type 2025 & 2033
- Figure 27: South America Carbonated Drinks Market Revenue (Million), by Distribution Channel 2025 & 2033
- Figure 28: South America Carbonated Drinks Market Volume (liter ), by Distribution Channel 2025 & 2033
- Figure 29: South America Carbonated Drinks Market Revenue Share (%), by Distribution Channel 2025 & 2033
- Figure 30: South America Carbonated Drinks Market Volume Share (%), by Distribution Channel 2025 & 2033
- Figure 31: South America Carbonated Drinks Market Revenue (Million), by Country 2025 & 2033
- Figure 32: South America Carbonated Drinks Market Volume (liter ), by Country 2025 & 2033
- Figure 33: South America Carbonated Drinks Market Revenue Share (%), by Country 2025 & 2033
- Figure 34: South America Carbonated Drinks Market Volume Share (%), by Country 2025 & 2033
- Figure 35: Europe Carbonated Drinks Market Revenue (Million), by Soft Drink Type 2025 & 2033
- Figure 36: Europe Carbonated Drinks Market Volume (liter ), by Soft Drink Type 2025 & 2033
- Figure 37: Europe Carbonated Drinks Market Revenue Share (%), by Soft Drink Type 2025 & 2033
- Figure 38: Europe Carbonated Drinks Market Volume Share (%), by Soft Drink Type 2025 & 2033
- Figure 39: Europe Carbonated Drinks Market Revenue (Million), by Packaging Type 2025 & 2033
- Figure 40: Europe Carbonated Drinks Market Volume (liter ), by Packaging Type 2025 & 2033
- Figure 41: Europe Carbonated Drinks Market Revenue Share (%), by Packaging Type 2025 & 2033
- Figure 42: Europe Carbonated Drinks Market Volume Share (%), by Packaging Type 2025 & 2033
- Figure 43: Europe Carbonated Drinks Market Revenue (Million), by Distribution Channel 2025 & 2033
- Figure 44: Europe Carbonated Drinks Market Volume (liter ), by Distribution Channel 2025 & 2033
- Figure 45: Europe Carbonated Drinks Market Revenue Share (%), by Distribution Channel 2025 & 2033
- Figure 46: Europe Carbonated Drinks Market Volume Share (%), by Distribution Channel 2025 & 2033
- Figure 47: Europe Carbonated Drinks Market Revenue (Million), by Country 2025 & 2033
- Figure 48: Europe Carbonated Drinks Market Volume (liter ), by Country 2025 & 2033
- Figure 49: Europe Carbonated Drinks Market Revenue Share (%), by Country 2025 & 2033
- Figure 50: Europe Carbonated Drinks Market Volume Share (%), by Country 2025 & 2033
- Figure 51: Middle East & Africa Carbonated Drinks Market Revenue (Million), by Soft Drink Type 2025 & 2033
- Figure 52: Middle East & Africa Carbonated Drinks Market Volume (liter ), by Soft Drink Type 2025 & 2033
- Figure 53: Middle East & Africa Carbonated Drinks Market Revenue Share (%), by Soft Drink Type 2025 & 2033
- Figure 54: Middle East & Africa Carbonated Drinks Market Volume Share (%), by Soft Drink Type 2025 & 2033
- Figure 55: Middle East & Africa Carbonated Drinks Market Revenue (Million), by Packaging Type 2025 & 2033
- Figure 56: Middle East & Africa Carbonated Drinks Market Volume (liter ), by Packaging Type 2025 & 2033
- Figure 57: Middle East & Africa Carbonated Drinks Market Revenue Share (%), by Packaging Type 2025 & 2033
- Figure 58: Middle East & Africa Carbonated Drinks Market Volume Share (%), by Packaging Type 2025 & 2033
- Figure 59: Middle East & Africa Carbonated Drinks Market Revenue (Million), by Distribution Channel 2025 & 2033
- Figure 60: Middle East & Africa Carbonated Drinks Market Volume (liter ), by Distribution Channel 2025 & 2033
- Figure 61: Middle East & Africa Carbonated Drinks Market Revenue Share (%), by Distribution Channel 2025 & 2033
- Figure 62: Middle East & Africa Carbonated Drinks Market Volume Share (%), by Distribution Channel 2025 & 2033
- Figure 63: Middle East & Africa Carbonated Drinks Market Revenue (Million), by Country 2025 & 2033
- Figure 64: Middle East & Africa Carbonated Drinks Market Volume (liter ), by Country 2025 & 2033
- Figure 65: Middle East & Africa Carbonated Drinks Market Revenue Share (%), by Country 2025 & 2033
- Figure 66: Middle East & Africa Carbonated Drinks Market Volume Share (%), by Country 2025 & 2033
- Figure 67: Asia Pacific Carbonated Drinks Market Revenue (Million), by Soft Drink Type 2025 & 2033
- Figure 68: Asia Pacific Carbonated Drinks Market Volume (liter ), by Soft Drink Type 2025 & 2033
- Figure 69: Asia Pacific Carbonated Drinks Market Revenue Share (%), by Soft Drink Type 2025 & 2033
- Figure 70: Asia Pacific Carbonated Drinks Market Volume Share (%), by Soft Drink Type 2025 & 2033
- Figure 71: Asia Pacific Carbonated Drinks Market Revenue (Million), by Packaging Type 2025 & 2033
- Figure 72: Asia Pacific Carbonated Drinks Market Volume (liter ), by Packaging Type 2025 & 2033
- Figure 73: Asia Pacific Carbonated Drinks Market Revenue Share (%), by Packaging Type 2025 & 2033
- Figure 74: Asia Pacific Carbonated Drinks Market Volume Share (%), by Packaging Type 2025 & 2033
- Figure 75: Asia Pacific Carbonated Drinks Market Revenue (Million), by Distribution Channel 2025 & 2033
- Figure 76: Asia Pacific Carbonated Drinks Market Volume (liter ), by Distribution Channel 2025 & 2033
- Figure 77: Asia Pacific Carbonated Drinks Market Revenue Share (%), by Distribution Channel 2025 & 2033
- Figure 78: Asia Pacific Carbonated Drinks Market Volume Share (%), by Distribution Channel 2025 & 2033
- Figure 79: Asia Pacific Carbonated Drinks Market Revenue (Million), by Country 2025 & 2033
- Figure 80: Asia Pacific Carbonated Drinks Market Volume (liter ), by Country 2025 & 2033
- Figure 81: Asia Pacific Carbonated Drinks Market Revenue Share (%), by Country 2025 & 2033
- Figure 82: Asia Pacific Carbonated Drinks Market Volume Share (%), by Country 2025 & 2033
List of Tables
- Table 1: Global Carbonated Drinks Market Revenue Million Forecast, by Soft Drink Type 2020 & 2033
- Table 2: Global Carbonated Drinks Market Volume liter Forecast, by Soft Drink Type 2020 & 2033
- Table 3: Global Carbonated Drinks Market Revenue Million Forecast, by Packaging Type 2020 & 2033
- Table 4: Global Carbonated Drinks Market Volume liter Forecast, by Packaging Type 2020 & 2033
- Table 5: Global Carbonated Drinks Market Revenue Million Forecast, by Distribution Channel 2020 & 2033
- Table 6: Global Carbonated Drinks Market Volume liter Forecast, by Distribution Channel 2020 & 2033
- Table 7: Global Carbonated Drinks Market Revenue Million Forecast, by Region 2020 & 2033
- Table 8: Global Carbonated Drinks Market Volume liter Forecast, by Region 2020 & 2033
- Table 9: Global Carbonated Drinks Market Revenue Million Forecast, by Soft Drink Type 2020 & 2033
- Table 10: Global Carbonated Drinks Market Volume liter Forecast, by Soft Drink Type 2020 & 2033
- Table 11: Global Carbonated Drinks Market Revenue Million Forecast, by Packaging Type 2020 & 2033
- Table 12: Global Carbonated Drinks Market Volume liter Forecast, by Packaging Type 2020 & 2033
- Table 13: Global Carbonated Drinks Market Revenue Million Forecast, by Distribution Channel 2020 & 2033
- Table 14: Global Carbonated Drinks Market Volume liter Forecast, by Distribution Channel 2020 & 2033
- Table 15: Global Carbonated Drinks Market Revenue Million Forecast, by Country 2020 & 2033
- Table 16: Global Carbonated Drinks Market Volume liter Forecast, by Country 2020 & 2033
- Table 17: United States Carbonated Drinks Market Revenue (Million) Forecast, by Application 2020 & 2033
- Table 18: United States Carbonated Drinks Market Volume (liter ) Forecast, by Application 2020 & 2033
- Table 19: Canada Carbonated Drinks Market Revenue (Million) Forecast, by Application 2020 & 2033
- Table 20: Canada Carbonated Drinks Market Volume (liter ) Forecast, by Application 2020 & 2033
- Table 21: Mexico Carbonated Drinks Market Revenue (Million) Forecast, by Application 2020 & 2033
- Table 22: Mexico Carbonated Drinks Market Volume (liter ) Forecast, by Application 2020 & 2033
- Table 23: Global Carbonated Drinks Market Revenue Million Forecast, by Soft Drink Type 2020 & 2033
- Table 24: Global Carbonated Drinks Market Volume liter Forecast, by Soft Drink Type 2020 & 2033
- Table 25: Global Carbonated Drinks Market Revenue Million Forecast, by Packaging Type 2020 & 2033
- Table 26: Global Carbonated Drinks Market Volume liter Forecast, by Packaging Type 2020 & 2033
- Table 27: Global Carbonated Drinks Market Revenue Million Forecast, by Distribution Channel 2020 & 2033
- Table 28: Global Carbonated Drinks Market Volume liter Forecast, by Distribution Channel 2020 & 2033
- Table 29: Global Carbonated Drinks Market Revenue Million Forecast, by Country 2020 & 2033
- Table 30: Global Carbonated Drinks Market Volume liter Forecast, by Country 2020 & 2033
- Table 31: Brazil Carbonated Drinks Market Revenue (Million) Forecast, by Application 2020 & 2033
- Table 32: Brazil Carbonated Drinks Market Volume (liter ) Forecast, by Application 2020 & 2033
- Table 33: Argentina Carbonated Drinks Market Revenue (Million) Forecast, by Application 2020 & 2033
- Table 34: Argentina Carbonated Drinks Market Volume (liter ) Forecast, by Application 2020 & 2033
- Table 35: Rest of South America Carbonated Drinks Market Revenue (Million) Forecast, by Application 2020 & 2033
- Table 36: Rest of South America Carbonated Drinks Market Volume (liter ) Forecast, by Application 2020 & 2033
- Table 37: Global Carbonated Drinks Market Revenue Million Forecast, by Soft Drink Type 2020 & 2033
- Table 38: Global Carbonated Drinks Market Volume liter Forecast, by Soft Drink Type 2020 & 2033
- Table 39: Global Carbonated Drinks Market Revenue Million Forecast, by Packaging Type 2020 & 2033
- Table 40: Global Carbonated Drinks Market Volume liter Forecast, by Packaging Type 2020 & 2033
- Table 41: Global Carbonated Drinks Market Revenue Million Forecast, by Distribution Channel 2020 & 2033
- Table 42: Global Carbonated Drinks Market Volume liter Forecast, by Distribution Channel 2020 & 2033
- Table 43: Global Carbonated Drinks Market Revenue Million Forecast, by Country 2020 & 2033
- Table 44: Global Carbonated Drinks Market Volume liter Forecast, by Country 2020 & 2033
- Table 45: United Kingdom Carbonated Drinks Market Revenue (Million) Forecast, by Application 2020 & 2033
- Table 46: United Kingdom Carbonated Drinks Market Volume (liter ) Forecast, by Application 2020 & 2033
- Table 47: Germany Carbonated Drinks Market Revenue (Million) Forecast, by Application 2020 & 2033
- Table 48: Germany Carbonated Drinks Market Volume (liter ) Forecast, by Application 2020 & 2033
- Table 49: France Carbonated Drinks Market Revenue (Million) Forecast, by Application 2020 & 2033
- Table 50: France Carbonated Drinks Market Volume (liter ) Forecast, by Application 2020 & 2033
- Table 51: Italy Carbonated Drinks Market Revenue (Million) Forecast, by Application 2020 & 2033
- Table 52: Italy Carbonated Drinks Market Volume (liter ) Forecast, by Application 2020 & 2033
- Table 53: Spain Carbonated Drinks Market Revenue (Million) Forecast, by Application 2020 & 2033
- Table 54: Spain Carbonated Drinks Market Volume (liter ) Forecast, by Application 2020 & 2033
- Table 55: Russia Carbonated Drinks Market Revenue (Million) Forecast, by Application 2020 & 2033
- Table 56: Russia Carbonated Drinks Market Volume (liter ) Forecast, by Application 2020 & 2033
- Table 57: Benelux Carbonated Drinks Market Revenue (Million) Forecast, by Application 2020 & 2033
- Table 58: Benelux Carbonated Drinks Market Volume (liter ) Forecast, by Application 2020 & 2033
- Table 59: Nordics Carbonated Drinks Market Revenue (Million) Forecast, by Application 2020 & 2033
- Table 60: Nordics Carbonated Drinks Market Volume (liter ) Forecast, by Application 2020 & 2033
- Table 61: Rest of Europe Carbonated Drinks Market Revenue (Million) Forecast, by Application 2020 & 2033
- Table 62: Rest of Europe Carbonated Drinks Market Volume (liter ) Forecast, by Application 2020 & 2033
- Table 63: Global Carbonated Drinks Market Revenue Million Forecast, by Soft Drink Type 2020 & 2033
- Table 64: Global Carbonated Drinks Market Volume liter Forecast, by Soft Drink Type 2020 & 2033
- Table 65: Global Carbonated Drinks Market Revenue Million Forecast, by Packaging Type 2020 & 2033
- Table 66: Global Carbonated Drinks Market Volume liter Forecast, by Packaging Type 2020 & 2033
- Table 67: Global Carbonated Drinks Market Revenue Million Forecast, by Distribution Channel 2020 & 2033
- Table 68: Global Carbonated Drinks Market Volume liter Forecast, by Distribution Channel 2020 & 2033
- Table 69: Global Carbonated Drinks Market Revenue Million Forecast, by Country 2020 & 2033
- Table 70: Global Carbonated Drinks Market Volume liter Forecast, by Country 2020 & 2033
- Table 71: Turkey Carbonated Drinks Market Revenue (Million) Forecast, by Application 2020 & 2033
- Table 72: Turkey Carbonated Drinks Market Volume (liter ) Forecast, by Application 2020 & 2033
- Table 73: Israel Carbonated Drinks Market Revenue (Million) Forecast, by Application 2020 & 2033
- Table 74: Israel Carbonated Drinks Market Volume (liter ) Forecast, by Application 2020 & 2033
- Table 75: GCC Carbonated Drinks Market Revenue (Million) Forecast, by Application 2020 & 2033
- Table 76: GCC Carbonated Drinks Market Volume (liter ) Forecast, by Application 2020 & 2033
- Table 77: North Africa Carbonated Drinks Market Revenue (Million) Forecast, by Application 2020 & 2033
- Table 78: North Africa Carbonated Drinks Market Volume (liter ) Forecast, by Application 2020 & 2033
- Table 79: South Africa Carbonated Drinks Market Revenue (Million) Forecast, by Application 2020 & 2033
- Table 80: South Africa Carbonated Drinks Market Volume (liter ) Forecast, by Application 2020 & 2033
- Table 81: Rest of Middle East & Africa Carbonated Drinks Market Revenue (Million) Forecast, by Application 2020 & 2033
- Table 82: Rest of Middle East & Africa Carbonated Drinks Market Volume (liter ) Forecast, by Application 2020 & 2033
- Table 83: Global Carbonated Drinks Market Revenue Million Forecast, by Soft Drink Type 2020 & 2033
- Table 84: Global Carbonated Drinks Market Volume liter Forecast, by Soft Drink Type 2020 & 2033
- Table 85: Global Carbonated Drinks Market Revenue Million Forecast, by Packaging Type 2020 & 2033
- Table 86: Global Carbonated Drinks Market Volume liter Forecast, by Packaging Type 2020 & 2033
- Table 87: Global Carbonated Drinks Market Revenue Million Forecast, by Distribution Channel 2020 & 2033
- Table 88: Global Carbonated Drinks Market Volume liter Forecast, by Distribution Channel 2020 & 2033
- Table 89: Global Carbonated Drinks Market Revenue Million Forecast, by Country 2020 & 2033
- Table 90: Global Carbonated Drinks Market Volume liter Forecast, by Country 2020 & 2033
- Table 91: China Carbonated Drinks Market Revenue (Million) Forecast, by Application 2020 & 2033
- Table 92: China Carbonated Drinks Market Volume (liter ) Forecast, by Application 2020 & 2033
- Table 93: India Carbonated Drinks Market Revenue (Million) Forecast, by Application 2020 & 2033
- Table 94: India Carbonated Drinks Market Volume (liter ) Forecast, by Application 2020 & 2033
- Table 95: Japan Carbonated Drinks Market Revenue (Million) Forecast, by Application 2020 & 2033
- Table 96: Japan Carbonated Drinks Market Volume (liter ) Forecast, by Application 2020 & 2033
- Table 97: South Korea Carbonated Drinks Market Revenue (Million) Forecast, by Application 2020 & 2033
- Table 98: South Korea Carbonated Drinks Market Volume (liter ) Forecast, by Application 2020 & 2033
- Table 99: ASEAN Carbonated Drinks Market Revenue (Million) Forecast, by Application 2020 & 2033
- Table 100: ASEAN Carbonated Drinks Market Volume (liter ) Forecast, by Application 2020 & 2033
- Table 101: Oceania Carbonated Drinks Market Revenue (Million) Forecast, by Application 2020 & 2033
- Table 102: Oceania Carbonated Drinks Market Volume (liter ) Forecast, by Application 2020 & 2033
- Table 103: Rest of Asia Pacific Carbonated Drinks Market Revenue (Million) Forecast, by Application 2020 & 2033
- Table 104: Rest of Asia Pacific Carbonated Drinks Market Volume (liter ) Forecast, by Application 2020 & 2033
Frequently Asked Questions
1. What is the projected Compound Annual Growth Rate (CAGR) of the Carbonated Drinks Market?
The projected CAGR is approximately 4.76%.
2. Which companies are prominent players in the Carbonated Drinks Market?
Key companies in the market include Asahi Group Holdings Ltd, PepsiCo Inc, Nongfu Spring Co Ltd, Rauch Fruchtsäfte GmbH & Co OG, PT Anggada Putra Rekso Mulia, Suntory Holdings Limited, Keurig Dr Pepper Inc, National Beverage Corp, Refresco Group BV, The Coca-Cola Company, Hangzhou Wahaha Group Co Ltd, Kirin Holdings Company Limited, Britvic PLC, Tingyi (Cayman Islands) Holding Corporatio, Thai Beverages PCL.
3. What are the main segments of the Carbonated Drinks Market?
The market segments include Soft Drink Type, Packaging Type, Distribution Channel.
4. Can you provide details about the market size?
The market size is estimated to be USD 500260 Million as of 2022.
5. What are some drivers contributing to market growth?
Growing preference for low alcoholic beer by volume (abv) or non-alcoholic beers; Rising number of breweries leading to high prominence of craft beer.
6. What are the notable trends driving market growth?
OTHER KEY INDUSTRY TRENDS COVERED IN THE REPORT.
7. Are there any restraints impacting market growth?
Demand for other alcoholic beverages.
8. Can you provide examples of recent developments in the market?
December 2023: Kirin launched its Tokusei Ginger Ale Sour and sugar-free tea products, including black tea and Hojicha, in response to the growing demand for sugar-free beverages due to heightened health awareness in Japan. Kirin limited the availability of the Kirin Tokusei Ginger Ale Sour and sugar-free tea products to the local Japanese market as of 2023.October 2023: Coca-Cola launched Coca-Cola Y3000, the beverage is created with the help of artificial intelligence. Coca-Cola Y3000 is the latest limited-edition flavor to launch under its Coca-Cola Creations platform.January 2023: PepsiCo Inc. launched Starry, a tasting soda with a Lemon-Lime flavor. This drink is available in regular and zero-sugar versions.
9. What pricing options are available for accessing the report?
Pricing options include single-user, multi-user, and enterprise licenses priced at USD 3800, USD 4500, and USD 5800 respectively.
10. Is the market size provided in terms of value or volume?
The market size is provided in terms of value, measured in Million and volume, measured in liter .
11. Are there any specific market keywords associated with the report?
Yes, the market keyword associated with the report is "Carbonated Drinks Market," which aids in identifying and referencing the specific market segment covered.
12. How do I determine which pricing option suits my needs best?
The pricing options vary based on user requirements and access needs. Individual users may opt for single-user licenses, while businesses requiring broader access may choose multi-user or enterprise licenses for cost-effective access to the report.
13. Are there any additional resources or data provided in the Carbonated Drinks Market report?
While the report offers comprehensive insights, it's advisable to review the specific contents or supplementary materials provided to ascertain if additional resources or data are available.
14. How can I stay updated on further developments or reports in the Carbonated Drinks Market?
To stay informed about further developments, trends, and reports in the Carbonated Drinks Market, consider subscribing to industry newsletters, following relevant companies and organizations, or regularly checking reputable industry news sources and publications.
Methodology
Step 1 - Identification of Relevant Samples Size from Population Database


Step 2 - Approaches for Defining Global Market Size (Value, Volume* & Price*)

Note*: In applicable scenarios
Step 3 - Data Sources
Primary Research
- Web Analytics
- Survey Reports
- Research Institute
- Latest Research Reports
- Opinion Leaders
Secondary Research
- Annual Reports
- White Paper
- Latest Press Release
- Industry Association
- Paid Database
- Investor Presentations

Step 4 - Data Triangulation
Involves using different sources of information in order to increase the validity of a study
These sources are likely to be stakeholders in a program - participants, other researchers, program staff, other community members, and so on.
Then we put all data in single framework & apply various statistical tools to find out the dynamic on the market.
During the analysis stage, feedback from the stakeholder groups would be compared to determine areas of agreement as well as areas of divergence