

Key Insights
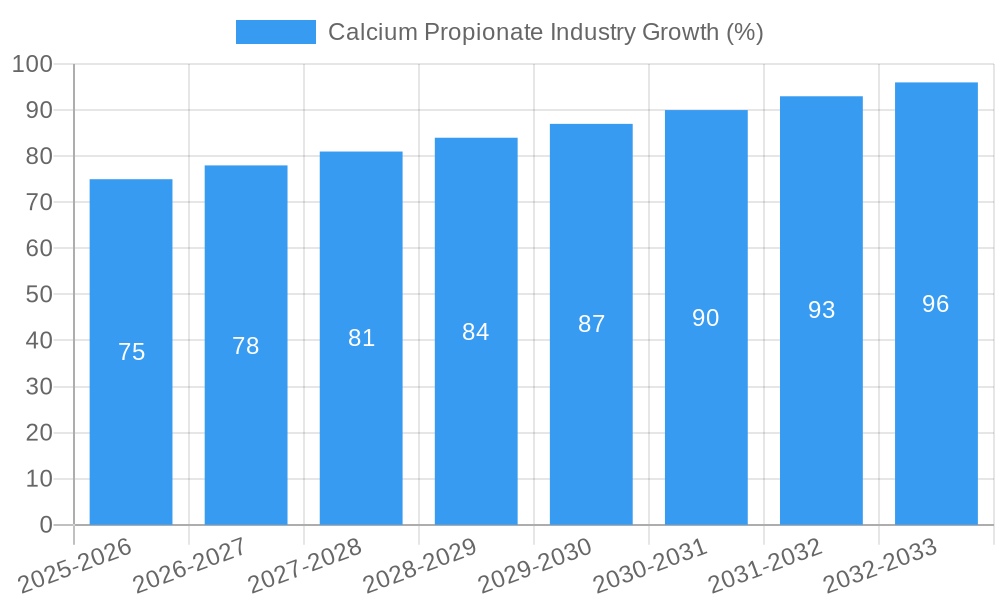
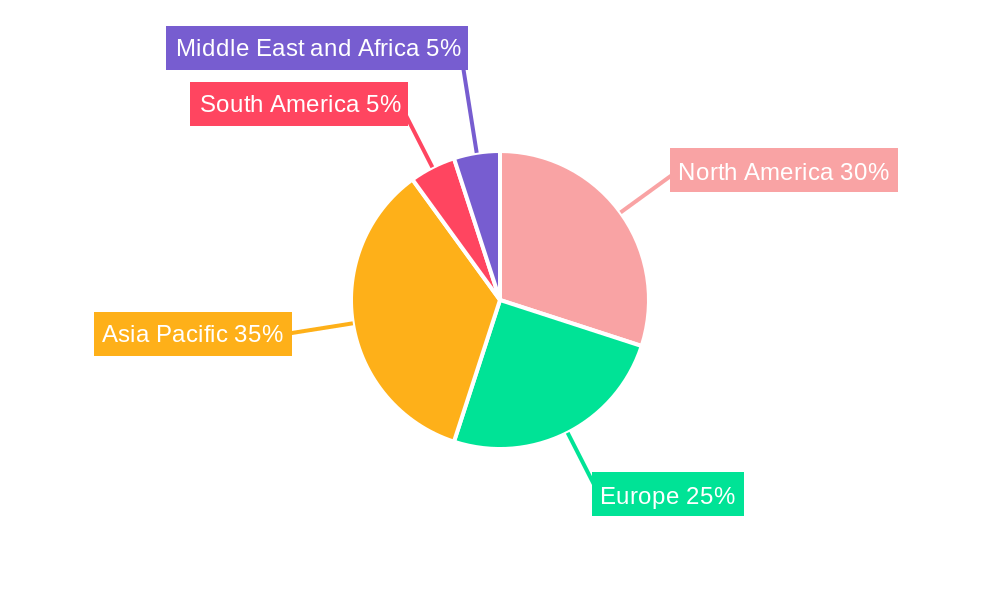
The global calcium propionate market is experiencing robust growth, driven by its widespread application as a preservative in the food and beverage, pharmaceutical, and animal feed industries. The market's Compound Annual Growth Rate (CAGR) exceeding 3.00% from 2019 to 2024 suggests a consistent upward trajectory. This growth is fueled by increasing consumer demand for longer shelf-life products, stringent food safety regulations, and the rising preference for processed foods globally. The pharmaceutical sector contributes significantly to market demand due to calcium propionate's use in various drug formulations. Furthermore, the expanding animal feed industry, particularly in developing economies, presents a significant growth opportunity. While regional variations exist, the Asia-Pacific region, especially China and India, is anticipated to dominate the market due to rapid economic growth, increasing population, and rising consumption of processed foods. However, factors such as fluctuating raw material prices and the potential for consumer preference shifts toward natural preservatives could pose challenges to market expansion. The competitive landscape is characterized by a mix of large multinational corporations and regional players, leading to intense competition and innovation in product offerings.
The segmentation of the calcium propionate market by application reveals the significant contribution of the food and beverage industry. This segment's growth is intricately linked to trends in consumer behavior, including increased demand for convenience foods and ready-to-eat meals. The pharmaceutical and animal feed segments also demonstrate substantial growth potential, driven by factors like the rising prevalence of chronic diseases and the increasing demand for high-quality animal feed. North America and Europe currently hold significant market shares, driven by strong regulatory frameworks and established consumer preferences for preserved foods. However, emerging economies in Asia-Pacific and South America are witnessing rapid growth, presenting considerable investment opportunities. This dynamic market landscape necessitates strategic planning and adaptability for players to capitalize on the growth potential and navigate potential challenges effectively.
Calcium Propionate Industry Market Report: 2019-2033
Dive deep into the comprehensive Calcium Propionate market analysis, covering market dynamics, leading players, and future growth projections. This report provides actionable insights for industry stakeholders, investors, and businesses looking to navigate this dynamic sector.
Study Period: 2019-2033 | Base Year: 2025 | Estimated Year: 2025 | Forecast Period: 2025-2033 | Historical Period: 2019-2024
Calcium Propionate Industry Market Dynamics & Concentration
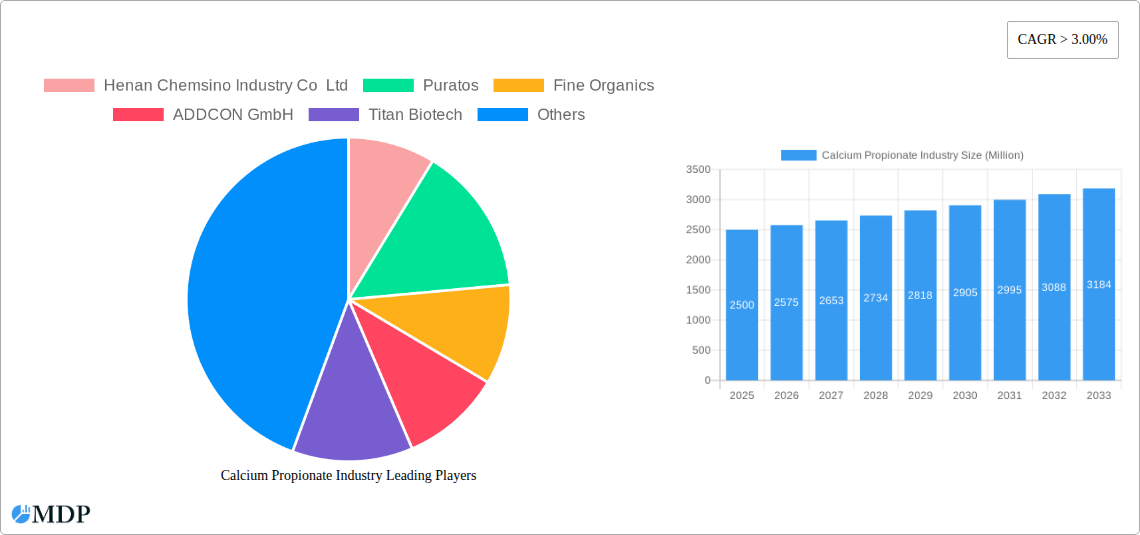
This section analyzes the Calcium Propionate market's competitive landscape, encompassing market concentration, innovation drivers, regulatory frameworks, substitute products, end-user trends, and mergers & acquisitions (M&A) activities. The global Calcium Propionate market is estimated to be worth xx Million in 2025, with a projected Compound Annual Growth Rate (CAGR) of xx% during the forecast period (2025-2033). Market concentration is moderately high, with the top five players holding an estimated xx% market share collectively in 2025.
- Innovation Drivers: The demand for clean-label ingredients and sustainable production methods is driving innovation within the industry. Bio-based calcium propionate alternatives are gaining traction, reflecting a growing emphasis on environmentally friendly solutions.
- Regulatory Frameworks: Stringent food safety regulations and labeling requirements across various regions influence market dynamics. Compliance costs and varying regulations impact profitability and market entry strategies.
- Product Substitutes: Other preservatives, such as sodium propionate and potassium sorbate, compete with calcium propionate, although calcium propionate maintains its dominant position due to its efficacy and cost-effectiveness.
- End-User Trends: The increasing demand for processed foods and animal feed is a primary growth driver. Changes in consumer preferences towards healthier and more natural food products are creating opportunities for innovative calcium propionate solutions.
- M&A Activities: The number of M&A deals in the Calcium Propionate industry has been relatively modest over the past five years, averaging approximately xx deals annually. Consolidation is expected to increase as larger players seek to expand their market share and product portfolios.
Calcium Propionate Industry Industry Trends & Analysis
The Calcium Propionate market is experiencing significant growth, driven by factors such as increasing demand from food and beverage, pharmaceutical, and animal feed industries. The market shows a robust CAGR of xx% from 2019 to 2024, indicating a positive growth trajectory. The rising adoption of calcium propionate as a food preservative and its effectiveness in extending shelf life are key growth catalysts. Technological advancements in production processes are improving efficiency and reducing costs. Consumer demand for extended shelf life in food products and increased awareness of food safety concerns further fuel the market growth. Competitive dynamics are intense, with manufacturers focusing on product differentiation through innovation and cost optimization strategies. Market penetration is relatively high in developed economies, but there's significant potential for growth in emerging markets. The shift toward sustainable practices and the development of bio-based calcium propionate are also shaping the future of this market.
Leading Markets & Segments in Calcium Propionate Industry
The Food and Beverage segment holds the largest market share within the Calcium Propionate industry, accounting for approximately xx% of the total market value in 2025. This dominance is primarily attributed to the widespread use of calcium propionate as a preservative in various food products, extending their shelf life and maintaining quality.
- Key Drivers for Food & Beverage Segment Dominance:
- High demand for processed foods globally.
- Stringent food safety regulations driving preservative usage.
- Extended shelf-life requirements for efficient supply chains.
- Growing awareness of microbial contamination in food products.
The Animal Feed segment is also a significant market segment, accounting for an estimated xx% of the market value, driven by the increasing demand for livestock feed and the need to maintain feed quality and safety. Other applications, such as pharmaceuticals and personal care, contribute to the overall market growth, though at a smaller scale compared to the food and beverage and animal feed segments. Geographic dominance is currently held by [mention dominant region/country – e.g., North America or Europe] due to factors such as well-established food processing industries, advanced infrastructure, and high consumer spending on processed foods. However, emerging markets in Asia-Pacific and Latin America present significant growth opportunities.
Calcium Propionate Industry Product Developments
Recent innovations in calcium propionate production focus on enhancing its sustainability and efficacy. The development of bio-based calcium propionate, as showcased by BioVeritas's clean-label mold inhibitor, represents a significant advancement. This innovation caters to the growing demand for natural and sustainable ingredients in the food and beverage industry. The improved shelf-life extension capabilities of these novel products provide a clear competitive advantage.
Key Drivers of Calcium Propionate Industry Growth
Several factors contribute to the growth of the Calcium Propionate market. Technological advancements leading to more efficient and cost-effective production methods are a key driver. The increasing demand for processed foods and animal feed globally also significantly fuels market expansion. Finally, stringent food safety regulations in many regions mandate the use of preservatives like calcium propionate, ensuring product quality and safety.
Challenges in the Calcium Propionate Industry Market
The Calcium Propionate industry faces challenges such as fluctuating raw material prices which impact profitability. Competition from other preservatives and the rising cost of compliance with stringent regulatory requirements also present obstacles. Supply chain disruptions, particularly impacting raw material sourcing and transportation, can affect production and delivery.
Emerging Opportunities in Calcium Propionate Industry
The development and adoption of bio-based calcium propionate represent a significant growth opportunity. This shift towards more sustainable production methods aligns with consumer preferences for clean-label and environmentally friendly products. Strategic partnerships between producers and food processors can further facilitate market penetration and accelerate growth. Expansion into emerging markets with growing demand for food preservatives also presents significant potential.
Leading Players in the Calcium Propionate Industry Sector
- Henan Chemsino Industry Co Ltd
- Puratos
- Fine Organics
- ADDCON GmbH
- Titan Biotech
- Pestell Nutrition Inc
- Agailenobel
- Perstorp Holding AB
- Jainex Speciality Chemicals
- Impextraco NV
- Kemin Industries Inc
- Niacet A Kerry Company
- Macco Organiques Inc
- BioVeritas
Key Milestones in Calcium Propionate Industry Industry
- April 2022: Perstorp announced plans to increase carboxylic acid production capacity by roughly 70,000 tons/year, significantly boosting calcium propionate production. This expansion signals confidence in future market demand and anticipates increased capacity as early as 2024.
- March 2023: BioVeritas launched a clean-label mold inhibitor using a cultured calcium propionate extract, extending shelf life by nearly 30% compared to traditional petrochemical-derived versions. This innovation highlights the shift towards sustainable and natural preservatives.
Strategic Outlook for Calcium Propionate Industry Market
The Calcium Propionate market is poised for continued growth, driven by increasing demand, innovative product developments, and a focus on sustainability. Strategic opportunities exist in expanding into emerging markets, forging partnerships to leverage distribution networks, and developing specialized calcium propionate solutions for niche applications. The industry’s future success will depend on adapting to evolving consumer preferences, navigating regulatory landscapes, and embracing sustainable production methods.
Calcium Propionate Industry Segmentation
-
1. Application
- 1.1. Pharmaceutical
- 1.2. Food and Beverage
- 1.3. Animal Feed
- 1.4. Personal Care
- 1.5. Other Applications
Calcium Propionate Industry Segmentation By Geography
-
1. Asia Pacific
- 1.1. China
- 1.2. India
- 1.3. Japan
- 1.4. South Korea
- 1.5. Rest of Asia Pacific
-
2. North America
- 2.1. United States
- 2.2. Canada
- 2.3. Mexico
-
3. Europe
- 3.1. Germany
- 3.2. United Kingdom
- 3.3. Italy
- 3.4. France
- 3.5. Rest of Europe
-
4. South America
- 4.1. Brazil
- 4.2. Argentina
- 4.3. Rest of South America
-
5. Middle East and Africa
- 5.1. Saudi Arabia
- 5.2. South Africa
- 5.3. Rest of Middle East and Africa
Calcium Propionate Industry REPORT HIGHLIGHTS
| Aspects | Details |
|---|---|
| Study Period | 2019-2033 |
| Base Year | 2024 |
| Estimated Year | 2025 |
| Forecast Period | 2025-2033 |
| Historical Period | 2019-2024 |
| Growth Rate | CAGR of > 3.00% from 2019-2033 |
| Segmentation |
|
Table of Contents
- 1. Introduction
- 1.1. Research Scope
- 1.2. Market Segmentation
- 1.3. Research Methodology
- 1.4. Definitions and Assumptions
- 2. Executive Summary
- 2.1. Introduction
- 3. Market Dynamics
- 3.1. Introduction
- 3.2. Market Drivers
- 3.2.1. Increasing Demand for Food Additives; Other Drivers
- 3.3. Market Restrains
- 3.3.1. Growing Demand for Preservative-less Food Products; Other Restraints
- 3.4. Market Trends
- 3.4.1. Increasing Demand from the Food and Beverage Sector
- 4. Market Factor Analysis
- 4.1. Porters Five Forces
- 4.2. Supply/Value Chain
- 4.3. PESTEL analysis
- 4.4. Market Entropy
- 4.5. Patent/Trademark Analysis
- 5. Global Calcium Propionate Industry Analysis, Insights and Forecast, 2019-2031
- 5.1. Market Analysis, Insights and Forecast - by Application
- 5.1.1. Pharmaceutical
- 5.1.2. Food and Beverage
- 5.1.3. Animal Feed
- 5.1.4. Personal Care
- 5.1.5. Other Applications
- 5.2. Market Analysis, Insights and Forecast - by Region
- 5.2.1. Asia Pacific
- 5.2.2. North America
- 5.2.3. Europe
- 5.2.4. South America
- 5.2.5. Middle East and Africa
- 5.1. Market Analysis, Insights and Forecast - by Application
- 6. Asia Pacific Calcium Propionate Industry Analysis, Insights and Forecast, 2019-2031
- 6.1. Market Analysis, Insights and Forecast - by Application
- 6.1.1. Pharmaceutical
- 6.1.2. Food and Beverage
- 6.1.3. Animal Feed
- 6.1.4. Personal Care
- 6.1.5. Other Applications
- 6.1. Market Analysis, Insights and Forecast - by Application
- 7. North America Calcium Propionate Industry Analysis, Insights and Forecast, 2019-2031
- 7.1. Market Analysis, Insights and Forecast - by Application
- 7.1.1. Pharmaceutical
- 7.1.2. Food and Beverage
- 7.1.3. Animal Feed
- 7.1.4. Personal Care
- 7.1.5. Other Applications
- 7.1. Market Analysis, Insights and Forecast - by Application
- 8. Europe Calcium Propionate Industry Analysis, Insights and Forecast, 2019-2031
- 8.1. Market Analysis, Insights and Forecast - by Application
- 8.1.1. Pharmaceutical
- 8.1.2. Food and Beverage
- 8.1.3. Animal Feed
- 8.1.4. Personal Care
- 8.1.5. Other Applications
- 8.1. Market Analysis, Insights and Forecast - by Application
- 9. South America Calcium Propionate Industry Analysis, Insights and Forecast, 2019-2031
- 9.1. Market Analysis, Insights and Forecast - by Application
- 9.1.1. Pharmaceutical
- 9.1.2. Food and Beverage
- 9.1.3. Animal Feed
- 9.1.4. Personal Care
- 9.1.5. Other Applications
- 9.1. Market Analysis, Insights and Forecast - by Application
- 10. Middle East and Africa Calcium Propionate Industry Analysis, Insights and Forecast, 2019-2031
- 10.1. Market Analysis, Insights and Forecast - by Application
- 10.1.1. Pharmaceutical
- 10.1.2. Food and Beverage
- 10.1.3. Animal Feed
- 10.1.4. Personal Care
- 10.1.5. Other Applications
- 10.1. Market Analysis, Insights and Forecast - by Application
- 11. Asia Pacific Calcium Propionate Industry Analysis, Insights and Forecast, 2019-2031
- 11.1. Market Analysis, Insights and Forecast - By Country/Sub-region
- 11.1.1 China
- 11.1.2 India
- 11.1.3 Japan
- 11.1.4 South Korea
- 11.1.5 Rest of Asia Pacific
- 12. North America Calcium Propionate Industry Analysis, Insights and Forecast, 2019-2031
- 12.1. Market Analysis, Insights and Forecast - By Country/Sub-region
- 12.1.1 United States
- 12.1.2 Canada
- 12.1.3 Mexico
- 13. Europe Calcium Propionate Industry Analysis, Insights and Forecast, 2019-2031
- 13.1. Market Analysis, Insights and Forecast - By Country/Sub-region
- 13.1.1 Germany
- 13.1.2 United Kingdom
- 13.1.3 Italy
- 13.1.4 France
- 13.1.5 Rest of Europe
- 14. South America Calcium Propionate Industry Analysis, Insights and Forecast, 2019-2031
- 14.1. Market Analysis, Insights and Forecast - By Country/Sub-region
- 14.1.1 Brazil
- 14.1.2 Argentina
- 14.1.3 Rest of South America
- 15. Middle East and Africa Calcium Propionate Industry Analysis, Insights and Forecast, 2019-2031
- 15.1. Market Analysis, Insights and Forecast - By Country/Sub-region
- 15.1.1 Saudi Arabia
- 15.1.2 South Africa
- 15.1.3 Rest of Middle East and Africa
- 16. Competitive Analysis
- 16.1. Global Market Share Analysis 2024
- 16.2. Company Profiles
- 16.2.1 Henan Chemsino Industry Co Ltd
- 16.2.1.1. Overview
- 16.2.1.2. Products
- 16.2.1.3. SWOT Analysis
- 16.2.1.4. Recent Developments
- 16.2.1.5. Financials (Based on Availability)
- 16.2.2 Puratos
- 16.2.2.1. Overview
- 16.2.2.2. Products
- 16.2.2.3. SWOT Analysis
- 16.2.2.4. Recent Developments
- 16.2.2.5. Financials (Based on Availability)
- 16.2.3 Fine Organics
- 16.2.3.1. Overview
- 16.2.3.2. Products
- 16.2.3.3. SWOT Analysis
- 16.2.3.4. Recent Developments
- 16.2.3.5. Financials (Based on Availability)
- 16.2.4 ADDCON GmbH
- 16.2.4.1. Overview
- 16.2.4.2. Products
- 16.2.4.3. SWOT Analysis
- 16.2.4.4. Recent Developments
- 16.2.4.5. Financials (Based on Availability)
- 16.2.5 Titan Biotech
- 16.2.5.1. Overview
- 16.2.5.2. Products
- 16.2.5.3. SWOT Analysis
- 16.2.5.4. Recent Developments
- 16.2.5.5. Financials (Based on Availability)
- 16.2.6 Pestell Nutrition Inc
- 16.2.6.1. Overview
- 16.2.6.2. Products
- 16.2.6.3. SWOT Analysis
- 16.2.6.4. Recent Developments
- 16.2.6.5. Financials (Based on Availability)
- 16.2.7 Agailenobel
- 16.2.7.1. Overview
- 16.2.7.2. Products
- 16.2.7.3. SWOT Analysis
- 16.2.7.4. Recent Developments
- 16.2.7.5. Financials (Based on Availability)
- 16.2.8 Perstorp Holding AB
- 16.2.8.1. Overview
- 16.2.8.2. Products
- 16.2.8.3. SWOT Analysis
- 16.2.8.4. Recent Developments
- 16.2.8.5. Financials (Based on Availability)
- 16.2.9 Jainex Speciality Chemicals
- 16.2.9.1. Overview
- 16.2.9.2. Products
- 16.2.9.3. SWOT Analysis
- 16.2.9.4. Recent Developments
- 16.2.9.5. Financials (Based on Availability)
- 16.2.10 Impextraco NV
- 16.2.10.1. Overview
- 16.2.10.2. Products
- 16.2.10.3. SWOT Analysis
- 16.2.10.4. Recent Developments
- 16.2.10.5. Financials (Based on Availability)
- 16.2.11 Kemin Industries Inc
- 16.2.11.1. Overview
- 16.2.11.2. Products
- 16.2.11.3. SWOT Analysis
- 16.2.11.4. Recent Developments
- 16.2.11.5. Financials (Based on Availability)
- 16.2.12 Niacet A Kerry Company
- 16.2.12.1. Overview
- 16.2.12.2. Products
- 16.2.12.3. SWOT Analysis
- 16.2.12.4. Recent Developments
- 16.2.12.5. Financials (Based on Availability)
- 16.2.13 Macco Organiques Inc
- 16.2.13.1. Overview
- 16.2.13.2. Products
- 16.2.13.3. SWOT Analysis
- 16.2.13.4. Recent Developments
- 16.2.13.5. Financials (Based on Availability)
- 16.2.14 BioVeritas*List Not Exhaustive
- 16.2.14.1. Overview
- 16.2.14.2. Products
- 16.2.14.3. SWOT Analysis
- 16.2.14.4. Recent Developments
- 16.2.14.5. Financials (Based on Availability)
- 16.2.1 Henan Chemsino Industry Co Ltd
List of Figures
- Figure 1: Global Calcium Propionate Industry Revenue Breakdown (Million, %) by Region 2024 & 2032
- Figure 2: Asia Pacific Calcium Propionate Industry Revenue (Million), by Country 2024 & 2032
- Figure 3: Asia Pacific Calcium Propionate Industry Revenue Share (%), by Country 2024 & 2032
- Figure 4: North America Calcium Propionate Industry Revenue (Million), by Country 2024 & 2032
- Figure 5: North America Calcium Propionate Industry Revenue Share (%), by Country 2024 & 2032
- Figure 6: Europe Calcium Propionate Industry Revenue (Million), by Country 2024 & 2032
- Figure 7: Europe Calcium Propionate Industry Revenue Share (%), by Country 2024 & 2032
- Figure 8: South America Calcium Propionate Industry Revenue (Million), by Country 2024 & 2032
- Figure 9: South America Calcium Propionate Industry Revenue Share (%), by Country 2024 & 2032
- Figure 10: Middle East and Africa Calcium Propionate Industry Revenue (Million), by Country 2024 & 2032
- Figure 11: Middle East and Africa Calcium Propionate Industry Revenue Share (%), by Country 2024 & 2032
- Figure 12: Asia Pacific Calcium Propionate Industry Revenue (Million), by Application 2024 & 2032
- Figure 13: Asia Pacific Calcium Propionate Industry Revenue Share (%), by Application 2024 & 2032
- Figure 14: Asia Pacific Calcium Propionate Industry Revenue (Million), by Country 2024 & 2032
- Figure 15: Asia Pacific Calcium Propionate Industry Revenue Share (%), by Country 2024 & 2032
- Figure 16: North America Calcium Propionate Industry Revenue (Million), by Application 2024 & 2032
- Figure 17: North America Calcium Propionate Industry Revenue Share (%), by Application 2024 & 2032
- Figure 18: North America Calcium Propionate Industry Revenue (Million), by Country 2024 & 2032
- Figure 19: North America Calcium Propionate Industry Revenue Share (%), by Country 2024 & 2032
- Figure 20: Europe Calcium Propionate Industry Revenue (Million), by Application 2024 & 2032
- Figure 21: Europe Calcium Propionate Industry Revenue Share (%), by Application 2024 & 2032
- Figure 22: Europe Calcium Propionate Industry Revenue (Million), by Country 2024 & 2032
- Figure 23: Europe Calcium Propionate Industry Revenue Share (%), by Country 2024 & 2032
- Figure 24: South America Calcium Propionate Industry Revenue (Million), by Application 2024 & 2032
- Figure 25: South America Calcium Propionate Industry Revenue Share (%), by Application 2024 & 2032
- Figure 26: South America Calcium Propionate Industry Revenue (Million), by Country 2024 & 2032
- Figure 27: South America Calcium Propionate Industry Revenue Share (%), by Country 2024 & 2032
- Figure 28: Middle East and Africa Calcium Propionate Industry Revenue (Million), by Application 2024 & 2032
- Figure 29: Middle East and Africa Calcium Propionate Industry Revenue Share (%), by Application 2024 & 2032
- Figure 30: Middle East and Africa Calcium Propionate Industry Revenue (Million), by Country 2024 & 2032
- Figure 31: Middle East and Africa Calcium Propionate Industry Revenue Share (%), by Country 2024 & 2032
List of Tables
- Table 1: Global Calcium Propionate Industry Revenue Million Forecast, by Region 2019 & 2032
- Table 2: Global Calcium Propionate Industry Revenue Million Forecast, by Application 2019 & 2032
- Table 3: Global Calcium Propionate Industry Revenue Million Forecast, by Region 2019 & 2032
- Table 4: Global Calcium Propionate Industry Revenue Million Forecast, by Country 2019 & 2032
- Table 5: China Calcium Propionate Industry Revenue (Million) Forecast, by Application 2019 & 2032
- Table 6: India Calcium Propionate Industry Revenue (Million) Forecast, by Application 2019 & 2032
- Table 7: Japan Calcium Propionate Industry Revenue (Million) Forecast, by Application 2019 & 2032
- Table 8: South Korea Calcium Propionate Industry Revenue (Million) Forecast, by Application 2019 & 2032
- Table 9: Rest of Asia Pacific Calcium Propionate Industry Revenue (Million) Forecast, by Application 2019 & 2032
- Table 10: Global Calcium Propionate Industry Revenue Million Forecast, by Country 2019 & 2032
- Table 11: United States Calcium Propionate Industry Revenue (Million) Forecast, by Application 2019 & 2032
- Table 12: Canada Calcium Propionate Industry Revenue (Million) Forecast, by Application 2019 & 2032
- Table 13: Mexico Calcium Propionate Industry Revenue (Million) Forecast, by Application 2019 & 2032
- Table 14: Global Calcium Propionate Industry Revenue Million Forecast, by Country 2019 & 2032
- Table 15: Germany Calcium Propionate Industry Revenue (Million) Forecast, by Application 2019 & 2032
- Table 16: United Kingdom Calcium Propionate Industry Revenue (Million) Forecast, by Application 2019 & 2032
- Table 17: Italy Calcium Propionate Industry Revenue (Million) Forecast, by Application 2019 & 2032
- Table 18: France Calcium Propionate Industry Revenue (Million) Forecast, by Application 2019 & 2032
- Table 19: Rest of Europe Calcium Propionate Industry Revenue (Million) Forecast, by Application 2019 & 2032
- Table 20: Global Calcium Propionate Industry Revenue Million Forecast, by Country 2019 & 2032
- Table 21: Brazil Calcium Propionate Industry Revenue (Million) Forecast, by Application 2019 & 2032
- Table 22: Argentina Calcium Propionate Industry Revenue (Million) Forecast, by Application 2019 & 2032
- Table 23: Rest of South America Calcium Propionate Industry Revenue (Million) Forecast, by Application 2019 & 2032
- Table 24: Global Calcium Propionate Industry Revenue Million Forecast, by Country 2019 & 2032
- Table 25: Saudi Arabia Calcium Propionate Industry Revenue (Million) Forecast, by Application 2019 & 2032
- Table 26: South Africa Calcium Propionate Industry Revenue (Million) Forecast, by Application 2019 & 2032
- Table 27: Rest of Middle East and Africa Calcium Propionate Industry Revenue (Million) Forecast, by Application 2019 & 2032
- Table 28: Global Calcium Propionate Industry Revenue Million Forecast, by Application 2019 & 2032
- Table 29: Global Calcium Propionate Industry Revenue Million Forecast, by Country 2019 & 2032
- Table 30: China Calcium Propionate Industry Revenue (Million) Forecast, by Application 2019 & 2032
- Table 31: India Calcium Propionate Industry Revenue (Million) Forecast, by Application 2019 & 2032
- Table 32: Japan Calcium Propionate Industry Revenue (Million) Forecast, by Application 2019 & 2032
- Table 33: South Korea Calcium Propionate Industry Revenue (Million) Forecast, by Application 2019 & 2032
- Table 34: Rest of Asia Pacific Calcium Propionate Industry Revenue (Million) Forecast, by Application 2019 & 2032
- Table 35: Global Calcium Propionate Industry Revenue Million Forecast, by Application 2019 & 2032
- Table 36: Global Calcium Propionate Industry Revenue Million Forecast, by Country 2019 & 2032
- Table 37: United States Calcium Propionate Industry Revenue (Million) Forecast, by Application 2019 & 2032
- Table 38: Canada Calcium Propionate Industry Revenue (Million) Forecast, by Application 2019 & 2032
- Table 39: Mexico Calcium Propionate Industry Revenue (Million) Forecast, by Application 2019 & 2032
- Table 40: Global Calcium Propionate Industry Revenue Million Forecast, by Application 2019 & 2032
- Table 41: Global Calcium Propionate Industry Revenue Million Forecast, by Country 2019 & 2032
- Table 42: Germany Calcium Propionate Industry Revenue (Million) Forecast, by Application 2019 & 2032
- Table 43: United Kingdom Calcium Propionate Industry Revenue (Million) Forecast, by Application 2019 & 2032
- Table 44: Italy Calcium Propionate Industry Revenue (Million) Forecast, by Application 2019 & 2032
- Table 45: France Calcium Propionate Industry Revenue (Million) Forecast, by Application 2019 & 2032
- Table 46: Rest of Europe Calcium Propionate Industry Revenue (Million) Forecast, by Application 2019 & 2032
- Table 47: Global Calcium Propionate Industry Revenue Million Forecast, by Application 2019 & 2032
- Table 48: Global Calcium Propionate Industry Revenue Million Forecast, by Country 2019 & 2032
- Table 49: Brazil Calcium Propionate Industry Revenue (Million) Forecast, by Application 2019 & 2032
- Table 50: Argentina Calcium Propionate Industry Revenue (Million) Forecast, by Application 2019 & 2032
- Table 51: Rest of South America Calcium Propionate Industry Revenue (Million) Forecast, by Application 2019 & 2032
- Table 52: Global Calcium Propionate Industry Revenue Million Forecast, by Application 2019 & 2032
- Table 53: Global Calcium Propionate Industry Revenue Million Forecast, by Country 2019 & 2032
- Table 54: Saudi Arabia Calcium Propionate Industry Revenue (Million) Forecast, by Application 2019 & 2032
- Table 55: South Africa Calcium Propionate Industry Revenue (Million) Forecast, by Application 2019 & 2032
- Table 56: Rest of Middle East and Africa Calcium Propionate Industry Revenue (Million) Forecast, by Application 2019 & 2032
Frequently Asked Questions
1. What is the projected Compound Annual Growth Rate (CAGR) of the Calcium Propionate Industry?
The projected CAGR is approximately > 3.00%.
2. Which companies are prominent players in the Calcium Propionate Industry?
Key companies in the market include Henan Chemsino Industry Co Ltd, Puratos, Fine Organics, ADDCON GmbH, Titan Biotech, Pestell Nutrition Inc, Agailenobel, Perstorp Holding AB, Jainex Speciality Chemicals, Impextraco NV, Kemin Industries Inc, Niacet A Kerry Company, Macco Organiques Inc, BioVeritas*List Not Exhaustive.
3. What are the main segments of the Calcium Propionate Industry?
The market segments include Application.
4. Can you provide details about the market size?
The market size is estimated to be USD XX Million as of 2022.
5. What are some drivers contributing to market growth?
Increasing Demand for Food Additives; Other Drivers.
6. What are the notable trends driving market growth?
Increasing Demand from the Food and Beverage Sector.
7. Are there any restraints impacting market growth?
Growing Demand for Preservative-less Food Products; Other Restraints.
8. Can you provide examples of recent developments in the market?
March 2023: BioVeritas invented a clean-label mold inhibitor created through the BioVeritas Process. The BioVeritas calcium propionate cultured extract extended its shelf life by an average of nearly 30% compared to petrochemical-derived calcium propionate.
9. What pricing options are available for accessing the report?
Pricing options include single-user, multi-user, and enterprise licenses priced at USD 4750, USD 5250, and USD 8750 respectively.
10. Is the market size provided in terms of value or volume?
The market size is provided in terms of value, measured in Million.
11. Are there any specific market keywords associated with the report?
Yes, the market keyword associated with the report is "Calcium Propionate Industry," which aids in identifying and referencing the specific market segment covered.
12. How do I determine which pricing option suits my needs best?
The pricing options vary based on user requirements and access needs. Individual users may opt for single-user licenses, while businesses requiring broader access may choose multi-user or enterprise licenses for cost-effective access to the report.
13. Are there any additional resources or data provided in the Calcium Propionate Industry report?
While the report offers comprehensive insights, it's advisable to review the specific contents or supplementary materials provided to ascertain if additional resources or data are available.
14. How can I stay updated on further developments or reports in the Calcium Propionate Industry?
To stay informed about further developments, trends, and reports in the Calcium Propionate Industry, consider subscribing to industry newsletters, following relevant companies and organizations, or regularly checking reputable industry news sources and publications.
Methodology
Step 1 - Identification of Relevant Samples Size from Population Database


Step 2 - Approaches for Defining Global Market Size (Value, Volume* & Price*)

Note*: In applicable scenarios
Step 3 - Data Sources
Primary Research
- Web Analytics
- Survey Reports
- Research Institute
- Latest Research Reports
- Opinion Leaders
Secondary Research
- Annual Reports
- White Paper
- Latest Press Release
- Industry Association
- Paid Database
- Investor Presentations

Step 4 - Data Triangulation
Involves using different sources of information in order to increase the validity of a study
These sources are likely to be stakeholders in a program - participants, other researchers, program staff, other community members, and so on.
Then we put all data in single framework & apply various statistical tools to find out the dynamic on the market.
During the analysis stage, feedback from the stakeholder groups would be compared to determine areas of agreement as well as areas of divergence
