

Key Insights
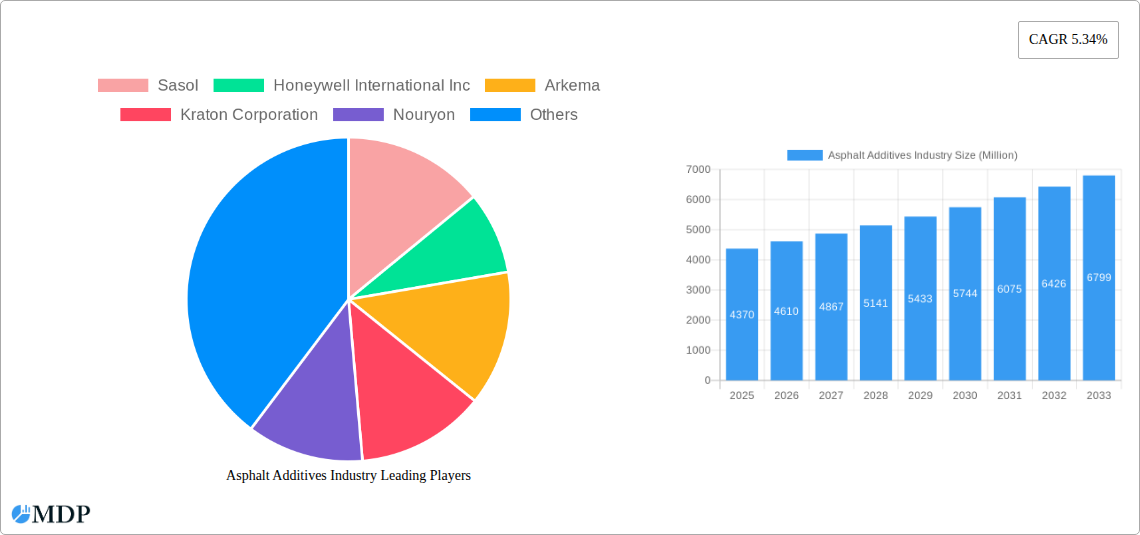
The asphalt additives market, valued at $4.37 billion in 2025, is projected to experience robust growth, driven by increasing infrastructure development globally and a rising demand for high-performance asphalt pavements. The market's Compound Annual Growth Rate (CAGR) of 5.34% from 2019 to 2024 indicates a consistent upward trajectory. Key drivers include the growing need for durable and sustainable road infrastructure, stringent government regulations regarding road safety and environmental concerns, and the increasing adoption of advanced asphalt modification technologies. The expanding construction sector in developing economies, particularly in Asia-Pacific, is fueling significant market expansion. Within the application segment, paving applications dominate, reflecting the widespread use of asphalt in road construction and maintenance. Similarly, chemical modifiers constitute a significant portion of the end-user industry segment due to their effectiveness in enhancing asphalt properties. However, challenges such as fluctuating crude oil prices and environmental concerns related to certain additive components pose restraints to market growth. The competitive landscape is characterized by a mix of multinational corporations and specialized additive manufacturers, with companies like Sasol, Honeywell, and BASF playing significant roles. Future growth will be influenced by advancements in additive technology, focusing on enhanced performance, sustainability, and cost-effectiveness. The market is expected to see further segmentation and specialization, with a rising focus on eco-friendly and recycled asphalt additives.
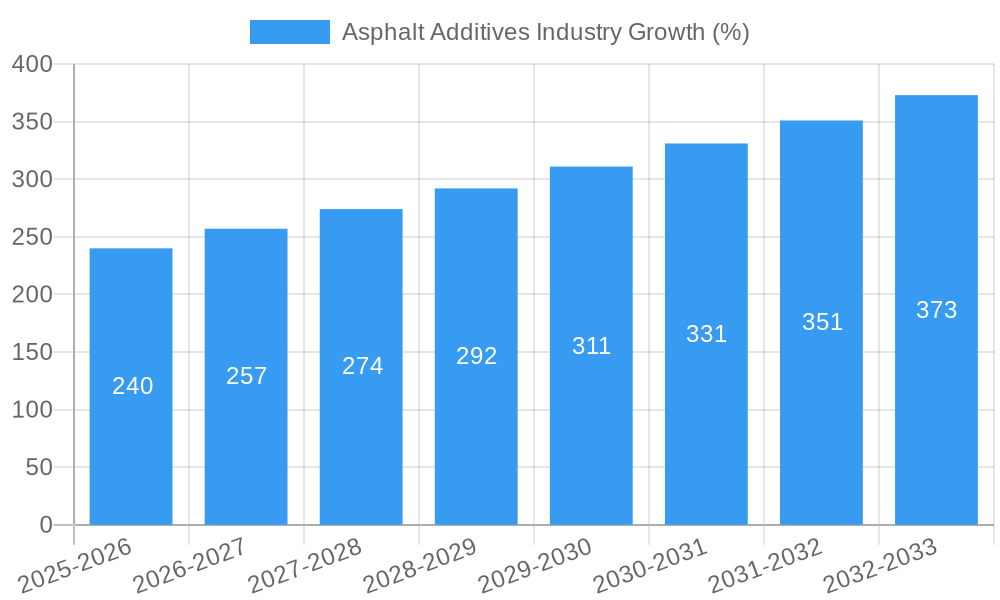
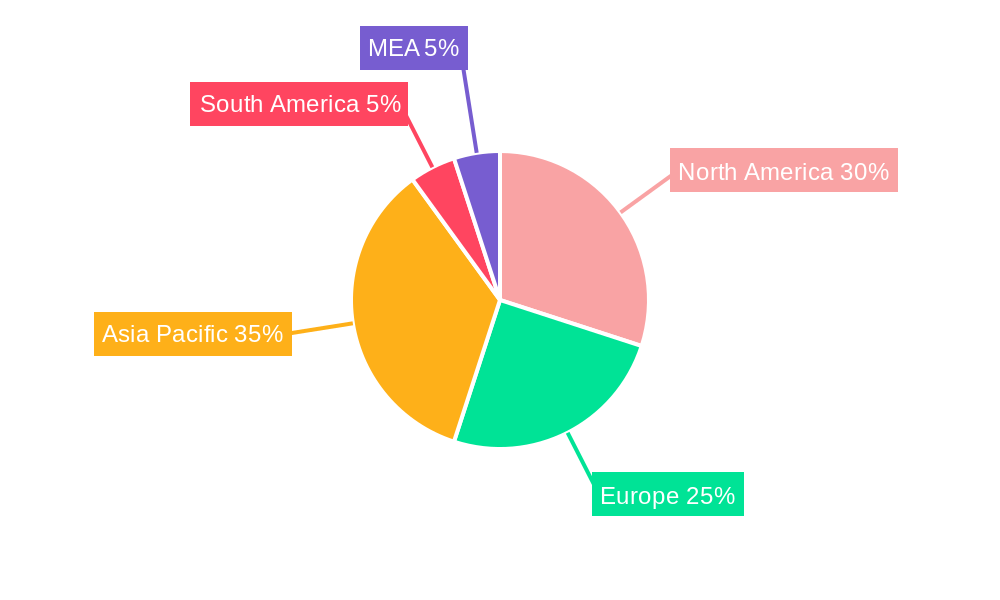
The forecast period (2025-2033) anticipates sustained growth, with a projected market value exceeding $6.5 billion by 2033. This growth will be propelled by continued infrastructure spending, technological innovation, and an increased focus on sustainable infrastructure solutions. Regional growth will vary, with Asia-Pacific showing substantial potential due to its large-scale infrastructure projects. North America and Europe are also expected to maintain healthy growth rates due to ongoing maintenance and upgrade programs for existing road networks. However, economic downturns or disruptions in the supply chain of raw materials could impact the overall market growth. The industry's focus will likely shift towards developing high-performance, environmentally friendly additives to address the growing concerns surrounding sustainability and carbon footprint.
Asphalt Additives Industry: Market Analysis & Forecast 2019-2033
This comprehensive report provides a detailed analysis of the Asphalt Additives industry, offering invaluable insights for stakeholders seeking to navigate this dynamic market. With a study period spanning 2019-2033 (base year 2025, forecast period 2025-2033), this report unveils market trends, competitive landscapes, and future growth projections, covering a market valued at xx Million in 2025.
Asphalt Additives Industry Market Dynamics & Concentration
The Asphalt Additives market is characterized by moderate concentration, with key players like Sasol, Honeywell International Inc, Arkema, Kraton Corporation, and Nouryon holding significant market share. However, the market also features several smaller players, contributing to a competitive landscape. Innovation drives growth, with companies focusing on developing sustainable and high-performance additives. Stringent environmental regulations concerning volatile organic compounds (VOCs) and carbon footprint are impacting the industry, driving the demand for eco-friendly additives. Product substitutes, such as alternative paving materials, pose a challenge, but advancements in asphalt additive technology are mitigating this. M&A activities have been relatively moderate in recent years, with approximately xx deals recorded between 2019 and 2024, indicating consolidation within certain segments.
- Market Share Concentration: xx% held by top 5 players in 2024.
- M&A Deal Count (2019-2024): xx
- Key Innovation Drivers: Sustainability, enhanced performance, and regulatory compliance.
- Major Regulatory Frameworks: Vary by region, focusing on environmental impact and product safety.
Asphalt Additives Industry Industry Trends & Analysis
The Asphalt Additives market exhibits a steady growth trajectory, projected to reach xx Million by 2033, demonstrating a Compound Annual Growth Rate (CAGR) of xx% during the forecast period. Growth is primarily driven by increasing global infrastructure development, particularly in emerging economies. Technological advancements, such as the use of nanotechnology and bio-based additives, are improving the performance and sustainability of asphalt pavements. Consumer preference for durable and long-lasting pavements fuels demand, while competitive dynamics encourage continuous innovation and cost optimization. Market penetration of new additives varies by region and application, with higher penetration rates in developed regions due to established infrastructure and higher adoption of advanced technologies. Key trends influencing the market include the growing demand for environmentally friendly solutions, advancements in polymer modification technology, and rising awareness of lifecycle cost analysis in road infrastructure projects.
Leading Markets & Segments in Asphalt Additives Industry
The Paving segment dominates the application market, driven by extensive road construction and maintenance activities globally. North America and Europe are leading regions due to developed infrastructure and high spending on road maintenance and new construction. Among end-user industries, Physical Modifiers hold a significant share, followed by Chemical Modifiers, as they provide crucial properties like improved durability and resistance to cracking and rutting.
- Leading Region: North America
- Dominant Application: Paving
- Leading End-user Industry: Physical Modifiers
- Key Drivers for North America: Robust infrastructure spending and stringent regulations on pavement quality.
- Key Drivers for Europe: Similar to North America, coupled with emphasis on sustainable infrastructure solutions.
- Key Drivers for Asia-Pacific: Rapid urbanization and infrastructure development in emerging economies.
Asphalt Additives Industry Product Developments
Recent product developments focus on incorporating sustainable materials, such as recycled plastics and bio-based modifiers, into asphalt additives. This addresses growing environmental concerns and promotes the circular economy. Companies are also developing additives with enhanced performance characteristics, including improved durability, resistance to rutting, and reduced water sensitivity. These innovations cater to the growing demand for long-lasting and high-performance pavements.
Key Drivers of Asphalt Additives Industry Growth
The Asphalt Additives market is propelled by robust infrastructure spending globally, particularly in developing nations. Technological advancements resulting in enhanced product performance and sustainability are major growth drivers. Stringent government regulations promoting environmentally friendly construction practices further boost demand for sustainable asphalt additives. The increasing awareness of lifecycle cost benefits associated with using high-quality asphalt additives further supports market expansion.
Challenges in the Asphalt Additives Industry Market
Fluctuations in raw material prices pose a significant challenge, affecting the profitability of manufacturers. The competitive landscape with numerous players often leads to price wars and margin pressures. Stringent environmental regulations requiring continuous adaptation and investment in research and development increase operational costs. Supply chain disruptions, particularly concerning raw materials and specialized chemicals, can also impede production and timely delivery.
Emerging Opportunities in Asphalt Additives Industry
The increasing focus on sustainable infrastructure development opens new opportunities for manufacturers offering eco-friendly asphalt additives. Strategic partnerships with infrastructure developers and government agencies can secure large-scale projects and secure market share. Technological advancements, such as nanotechnology and the use of AI in optimizing pavement design, offer avenues for enhanced performance and cost savings, ultimately driving market growth.
Leading Players in the Asphalt Additives Industry Sector
- Sasol
- Honeywell International Inc
- Arkema
- Kraton Corporation
- Nouryon
- Exxon Mobil Corporation
- Evonik Industries AG
- Cargill
- BASF SE
- DuPont
- Dow
- PQ Corporation
- ArrMaz Products Inc
- Engineered Additives LLC
- Kao Corporation
- McAsphalt Industries Limited
- Genan Holding A/S
Key Milestones in Asphalt Additives Industry Industry
- July 2022: Successful demonstration project using Biorestor, a soybean oil-based asphalt enhancement product, showcasing a potential 40% increase in pavement lifecycle.
- January 2023: Dow's support of "The Road Forward" initiative by NAPA, highlighting the industry's commitment to achieving net-zero carbon emissions.
Strategic Outlook for Asphalt Additives Industry Market
The Asphalt Additives market is poised for continued growth driven by global infrastructure development and technological innovation. Companies focusing on sustainability, advanced product performance, and strategic partnerships will be well-positioned to capitalize on emerging opportunities. Investing in R&D and expanding into new markets will be crucial for long-term success in this competitive yet growth-oriented industry.
Asphalt Additives Industry Segmentation
-
1. Application
- 1.1. Paving
- 1.2. Roofing
- 1.3. Other Applications
-
2. End-user Industry
-
2.1. Physical Modifiers
- 2.1.1. Plastics
- 2.1.2. Rubbers
- 2.1.3. Other Physical Modifiers
- 2.2. Chemical Modifiers
- 2.3. Fibers
- 2.4. Adhesion Improvers
- 2.5. Extenders
- 2.6. Fillers
- 2.7. Antioxidants
- 2.8. Anti-strip Modifiers
- 2.9. Other End-user Industries
-
2.1. Physical Modifiers
Asphalt Additives Industry Segmentation By Geography
-
1. Asia Pacific
- 1.1. China
- 1.2. India
- 1.3. Japan
- 1.4. South Korea
- 1.5. Australia
- 1.6. Rest of Asia Pacific
-
2. North America
- 2.1. United States
- 2.2. Canada
- 2.3. Mexico
-
3. Europe
- 3.1. Germany
- 3.2. United Kingdom
- 3.3. Italy
- 3.4. France
- 3.5. Rest of Europe
-
4. South America
- 4.1. Brazil
- 4.2. Argentina
- 4.3. Colombia
- 4.4. Rest of South America
- 5. Middle East
-
6. Saudi Arabia
- 6.1. South Africa
- 6.2. Qatar
- 6.3. Rest of Middle East
Asphalt Additives Industry REPORT HIGHLIGHTS
| Aspects | Details |
|---|---|
| Study Period | 2019-2033 |
| Base Year | 2024 |
| Estimated Year | 2025 |
| Forecast Period | 2025-2033 |
| Historical Period | 2019-2024 |
| Growth Rate | CAGR of 5.34% from 2019-2033 |
| Segmentation |
|
Table of Contents
- 1. Introduction
- 1.1. Research Scope
- 1.2. Market Segmentation
- 1.3. Research Methodology
- 1.4. Definitions and Assumptions
- 2. Executive Summary
- 2.1. Introduction
- 3. Market Dynamics
- 3.1. Introduction
- 3.2. Market Drivers
- 3.2.1. High Traffic Volume and Heavier Loads; Emphasis on Meeting Super-save Design Specifications; Increased Pavement Work-life and Reduced MRO Cost Advantages
- 3.3. Market Restrains
- 3.3.1. High Initial Cost for Using Modified Asphalt Cement; Occupational Health Hazards Regarding Asphalt
- 3.4. Market Trends
- 3.4.1. Increasing Demand from Paving Application
- 4. Market Factor Analysis
- 4.1. Porters Five Forces
- 4.2. Supply/Value Chain
- 4.3. PESTEL analysis
- 4.4. Market Entropy
- 4.5. Patent/Trademark Analysis
- 5. Global Asphalt Additives Industry Analysis, Insights and Forecast, 2019-2031
- 5.1. Market Analysis, Insights and Forecast - by Application
- 5.1.1. Paving
- 5.1.2. Roofing
- 5.1.3. Other Applications
- 5.2. Market Analysis, Insights and Forecast - by End-user Industry
- 5.2.1. Physical Modifiers
- 5.2.1.1. Plastics
- 5.2.1.2. Rubbers
- 5.2.1.3. Other Physical Modifiers
- 5.2.2. Chemical Modifiers
- 5.2.3. Fibers
- 5.2.4. Adhesion Improvers
- 5.2.5. Extenders
- 5.2.6. Fillers
- 5.2.7. Antioxidants
- 5.2.8. Anti-strip Modifiers
- 5.2.9. Other End-user Industries
- 5.2.1. Physical Modifiers
- 5.3. Market Analysis, Insights and Forecast - by Region
- 5.3.1. Asia Pacific
- 5.3.2. North America
- 5.3.3. Europe
- 5.3.4. South America
- 5.3.5. Middle East
- 5.3.6. Saudi Arabia
- 5.1. Market Analysis, Insights and Forecast - by Application
- 6. Asia Pacific Asphalt Additives Industry Analysis, Insights and Forecast, 2019-2031
- 6.1. Market Analysis, Insights and Forecast - by Application
- 6.1.1. Paving
- 6.1.2. Roofing
- 6.1.3. Other Applications
- 6.2. Market Analysis, Insights and Forecast - by End-user Industry
- 6.2.1. Physical Modifiers
- 6.2.1.1. Plastics
- 6.2.1.2. Rubbers
- 6.2.1.3. Other Physical Modifiers
- 6.2.2. Chemical Modifiers
- 6.2.3. Fibers
- 6.2.4. Adhesion Improvers
- 6.2.5. Extenders
- 6.2.6. Fillers
- 6.2.7. Antioxidants
- 6.2.8. Anti-strip Modifiers
- 6.2.9. Other End-user Industries
- 6.2.1. Physical Modifiers
- 6.1. Market Analysis, Insights and Forecast - by Application
- 7. North America Asphalt Additives Industry Analysis, Insights and Forecast, 2019-2031
- 7.1. Market Analysis, Insights and Forecast - by Application
- 7.1.1. Paving
- 7.1.2. Roofing
- 7.1.3. Other Applications
- 7.2. Market Analysis, Insights and Forecast - by End-user Industry
- 7.2.1. Physical Modifiers
- 7.2.1.1. Plastics
- 7.2.1.2. Rubbers
- 7.2.1.3. Other Physical Modifiers
- 7.2.2. Chemical Modifiers
- 7.2.3. Fibers
- 7.2.4. Adhesion Improvers
- 7.2.5. Extenders
- 7.2.6. Fillers
- 7.2.7. Antioxidants
- 7.2.8. Anti-strip Modifiers
- 7.2.9. Other End-user Industries
- 7.2.1. Physical Modifiers
- 7.1. Market Analysis, Insights and Forecast - by Application
- 8. Europe Asphalt Additives Industry Analysis, Insights and Forecast, 2019-2031
- 8.1. Market Analysis, Insights and Forecast - by Application
- 8.1.1. Paving
- 8.1.2. Roofing
- 8.1.3. Other Applications
- 8.2. Market Analysis, Insights and Forecast - by End-user Industry
- 8.2.1. Physical Modifiers
- 8.2.1.1. Plastics
- 8.2.1.2. Rubbers
- 8.2.1.3. Other Physical Modifiers
- 8.2.2. Chemical Modifiers
- 8.2.3. Fibers
- 8.2.4. Adhesion Improvers
- 8.2.5. Extenders
- 8.2.6. Fillers
- 8.2.7. Antioxidants
- 8.2.8. Anti-strip Modifiers
- 8.2.9. Other End-user Industries
- 8.2.1. Physical Modifiers
- 8.1. Market Analysis, Insights and Forecast - by Application
- 9. South America Asphalt Additives Industry Analysis, Insights and Forecast, 2019-2031
- 9.1. Market Analysis, Insights and Forecast - by Application
- 9.1.1. Paving
- 9.1.2. Roofing
- 9.1.3. Other Applications
- 9.2. Market Analysis, Insights and Forecast - by End-user Industry
- 9.2.1. Physical Modifiers
- 9.2.1.1. Plastics
- 9.2.1.2. Rubbers
- 9.2.1.3. Other Physical Modifiers
- 9.2.2. Chemical Modifiers
- 9.2.3. Fibers
- 9.2.4. Adhesion Improvers
- 9.2.5. Extenders
- 9.2.6. Fillers
- 9.2.7. Antioxidants
- 9.2.8. Anti-strip Modifiers
- 9.2.9. Other End-user Industries
- 9.2.1. Physical Modifiers
- 9.1. Market Analysis, Insights and Forecast - by Application
- 10. Middle East Asphalt Additives Industry Analysis, Insights and Forecast, 2019-2031
- 10.1. Market Analysis, Insights and Forecast - by Application
- 10.1.1. Paving
- 10.1.2. Roofing
- 10.1.3. Other Applications
- 10.2. Market Analysis, Insights and Forecast - by End-user Industry
- 10.2.1. Physical Modifiers
- 10.2.1.1. Plastics
- 10.2.1.2. Rubbers
- 10.2.1.3. Other Physical Modifiers
- 10.2.2. Chemical Modifiers
- 10.2.3. Fibers
- 10.2.4. Adhesion Improvers
- 10.2.5. Extenders
- 10.2.6. Fillers
- 10.2.7. Antioxidants
- 10.2.8. Anti-strip Modifiers
- 10.2.9. Other End-user Industries
- 10.2.1. Physical Modifiers
- 10.1. Market Analysis, Insights and Forecast - by Application
- 11. Saudi Arabia Asphalt Additives Industry Analysis, Insights and Forecast, 2019-2031
- 11.1. Market Analysis, Insights and Forecast - by Application
- 11.1.1. Paving
- 11.1.2. Roofing
- 11.1.3. Other Applications
- 11.2. Market Analysis, Insights and Forecast - by End-user Industry
- 11.2.1. Physical Modifiers
- 11.2.1.1. Plastics
- 11.2.1.2. Rubbers
- 11.2.1.3. Other Physical Modifiers
- 11.2.2. Chemical Modifiers
- 11.2.3. Fibers
- 11.2.4. Adhesion Improvers
- 11.2.5. Extenders
- 11.2.6. Fillers
- 11.2.7. Antioxidants
- 11.2.8. Anti-strip Modifiers
- 11.2.9. Other End-user Industries
- 11.2.1. Physical Modifiers
- 11.1. Market Analysis, Insights and Forecast - by Application
- 12. North America Asphalt Additives Industry Analysis, Insights and Forecast, 2019-2031
- 12.1. Market Analysis, Insights and Forecast - By Country/Sub-region
- 12.1.1 United States
- 12.1.2 Canada
- 12.1.3 Mexico
- 13. North America Asphalt Additives Industry Analysis, Insights and Forecast, 2019-2031
- 13.1. Market Analysis, Insights and Forecast - By Country/Sub-region
- 13.1.1 United States
- 13.1.2 Canada
- 13.1.3 Mexico
- 14. Asia Pacific Asphalt Additives Industry Analysis, Insights and Forecast, 2019-2031
- 14.1. Market Analysis, Insights and Forecast - By Country/Sub-region
- 14.1.1 China
- 14.1.2 Japan
- 14.1.3 India
- 14.1.4 South Korea
- 14.1.5 Taiwan
- 14.1.6 Australia
- 14.1.7 Rest of Asia-Pacific
- 15. South America Asphalt Additives Industry Analysis, Insights and Forecast, 2019-2031
- 15.1. Market Analysis, Insights and Forecast - By Country/Sub-region
- 15.1.1 Brazil
- 15.1.2 Argentina
- 15.1.3 Rest of South America
- 16. MEA Asphalt Additives Industry Analysis, Insights and Forecast, 2019-2031
- 16.1. Market Analysis, Insights and Forecast - By Country/Sub-region
- 16.1.1 Middle East
- 16.1.2 Africa
- 17. Competitive Analysis
- 17.1. Global Market Share Analysis 2024
- 17.2. Company Profiles
- 17.2.1 Sasol
- 17.2.1.1. Overview
- 17.2.1.2. Products
- 17.2.1.3. SWOT Analysis
- 17.2.1.4. Recent Developments
- 17.2.1.5. Financials (Based on Availability)
- 17.2.2 Honeywell International Inc
- 17.2.2.1. Overview
- 17.2.2.2. Products
- 17.2.2.3. SWOT Analysis
- 17.2.2.4. Recent Developments
- 17.2.2.5. Financials (Based on Availability)
- 17.2.3 Arkema
- 17.2.3.1. Overview
- 17.2.3.2. Products
- 17.2.3.3. SWOT Analysis
- 17.2.3.4. Recent Developments
- 17.2.3.5. Financials (Based on Availability)
- 17.2.4 Kraton Corporation
- 17.2.4.1. Overview
- 17.2.4.2. Products
- 17.2.4.3. SWOT Analysis
- 17.2.4.4. Recent Developments
- 17.2.4.5. Financials (Based on Availability)
- 17.2.5 Nouryon
- 17.2.5.1. Overview
- 17.2.5.2. Products
- 17.2.5.3. SWOT Analysis
- 17.2.5.4. Recent Developments
- 17.2.5.5. Financials (Based on Availability)
- 17.2.6 Exxon Mobil Corporation
- 17.2.6.1. Overview
- 17.2.6.2. Products
- 17.2.6.3. SWOT Analysis
- 17.2.6.4. Recent Developments
- 17.2.6.5. Financials (Based on Availability)
- 17.2.7 Evonik Industries AG
- 17.2.7.1. Overview
- 17.2.7.2. Products
- 17.2.7.3. SWOT Analysis
- 17.2.7.4. Recent Developments
- 17.2.7.5. Financials (Based on Availability)
- 17.2.8 Cargill
- 17.2.8.1. Overview
- 17.2.8.2. Products
- 17.2.8.3. SWOT Analysis
- 17.2.8.4. Recent Developments
- 17.2.8.5. Financials (Based on Availability)
- 17.2.9 BASF SE
- 17.2.9.1. Overview
- 17.2.9.2. Products
- 17.2.9.3. SWOT Analysis
- 17.2.9.4. Recent Developments
- 17.2.9.5. Financials (Based on Availability)
- 17.2.10 DuPont
- 17.2.10.1. Overview
- 17.2.10.2. Products
- 17.2.10.3. SWOT Analysis
- 17.2.10.4. Recent Developments
- 17.2.10.5. Financials (Based on Availability)
- 17.2.11 Dow
- 17.2.11.1. Overview
- 17.2.11.2. Products
- 17.2.11.3. SWOT Analysis
- 17.2.11.4. Recent Developments
- 17.2.11.5. Financials (Based on Availability)
- 17.2.12 PQ Corporation
- 17.2.12.1. Overview
- 17.2.12.2. Products
- 17.2.12.3. SWOT Analysis
- 17.2.12.4. Recent Developments
- 17.2.12.5. Financials (Based on Availability)
- 17.2.13 ArrMaz Products Inc
- 17.2.13.1. Overview
- 17.2.13.2. Products
- 17.2.13.3. SWOT Analysis
- 17.2.13.4. Recent Developments
- 17.2.13.5. Financials (Based on Availability)
- 17.2.14 Engineered Additives LLC
- 17.2.14.1. Overview
- 17.2.14.2. Products
- 17.2.14.3. SWOT Analysis
- 17.2.14.4. Recent Developments
- 17.2.14.5. Financials (Based on Availability)
- 17.2.15 Kao Corporation
- 17.2.15.1. Overview
- 17.2.15.2. Products
- 17.2.15.3. SWOT Analysis
- 17.2.15.4. Recent Developments
- 17.2.15.5. Financials (Based on Availability)
- 17.2.16 McAsphalt Industries Limited
- 17.2.16.1. Overview
- 17.2.16.2. Products
- 17.2.16.3. SWOT Analysis
- 17.2.16.4. Recent Developments
- 17.2.16.5. Financials (Based on Availability)
- 17.2.17 Genan Holding A/S
- 17.2.17.1. Overview
- 17.2.17.2. Products
- 17.2.17.3. SWOT Analysis
- 17.2.17.4. Recent Developments
- 17.2.17.5. Financials (Based on Availability)
- 17.2.1 Sasol
List of Figures
- Figure 1: Global Asphalt Additives Industry Revenue Breakdown (Million, %) by Region 2024 & 2032
- Figure 2: Global Asphalt Additives Industry Volume Breakdown (K Tons, %) by Region 2024 & 2032
- Figure 3: North America Asphalt Additives Industry Revenue (Million), by Country 2024 & 2032
- Figure 4: North America Asphalt Additives Industry Volume (K Tons), by Country 2024 & 2032
- Figure 5: North America Asphalt Additives Industry Revenue Share (%), by Country 2024 & 2032
- Figure 6: North America Asphalt Additives Industry Volume Share (%), by Country 2024 & 2032
- Figure 7: North America Asphalt Additives Industry Revenue (Million), by Country 2024 & 2032
- Figure 8: North America Asphalt Additives Industry Volume (K Tons), by Country 2024 & 2032
- Figure 9: North America Asphalt Additives Industry Revenue Share (%), by Country 2024 & 2032
- Figure 10: North America Asphalt Additives Industry Volume Share (%), by Country 2024 & 2032
- Figure 11: Asia Pacific Asphalt Additives Industry Revenue (Million), by Country 2024 & 2032
- Figure 12: Asia Pacific Asphalt Additives Industry Volume (K Tons), by Country 2024 & 2032
- Figure 13: Asia Pacific Asphalt Additives Industry Revenue Share (%), by Country 2024 & 2032
- Figure 14: Asia Pacific Asphalt Additives Industry Volume Share (%), by Country 2024 & 2032
- Figure 15: South America Asphalt Additives Industry Revenue (Million), by Country 2024 & 2032
- Figure 16: South America Asphalt Additives Industry Volume (K Tons), by Country 2024 & 2032
- Figure 17: South America Asphalt Additives Industry Revenue Share (%), by Country 2024 & 2032
- Figure 18: South America Asphalt Additives Industry Volume Share (%), by Country 2024 & 2032
- Figure 19: MEA Asphalt Additives Industry Revenue (Million), by Country 2024 & 2032
- Figure 20: MEA Asphalt Additives Industry Volume (K Tons), by Country 2024 & 2032
- Figure 21: MEA Asphalt Additives Industry Revenue Share (%), by Country 2024 & 2032
- Figure 22: MEA Asphalt Additives Industry Volume Share (%), by Country 2024 & 2032
- Figure 23: Asia Pacific Asphalt Additives Industry Revenue (Million), by Application 2024 & 2032
- Figure 24: Asia Pacific Asphalt Additives Industry Volume (K Tons), by Application 2024 & 2032
- Figure 25: Asia Pacific Asphalt Additives Industry Revenue Share (%), by Application 2024 & 2032
- Figure 26: Asia Pacific Asphalt Additives Industry Volume Share (%), by Application 2024 & 2032
- Figure 27: Asia Pacific Asphalt Additives Industry Revenue (Million), by End-user Industry 2024 & 2032
- Figure 28: Asia Pacific Asphalt Additives Industry Volume (K Tons), by End-user Industry 2024 & 2032
- Figure 29: Asia Pacific Asphalt Additives Industry Revenue Share (%), by End-user Industry 2024 & 2032
- Figure 30: Asia Pacific Asphalt Additives Industry Volume Share (%), by End-user Industry 2024 & 2032
- Figure 31: Asia Pacific Asphalt Additives Industry Revenue (Million), by Country 2024 & 2032
- Figure 32: Asia Pacific Asphalt Additives Industry Volume (K Tons), by Country 2024 & 2032
- Figure 33: Asia Pacific Asphalt Additives Industry Revenue Share (%), by Country 2024 & 2032
- Figure 34: Asia Pacific Asphalt Additives Industry Volume Share (%), by Country 2024 & 2032
- Figure 35: North America Asphalt Additives Industry Revenue (Million), by Application 2024 & 2032
- Figure 36: North America Asphalt Additives Industry Volume (K Tons), by Application 2024 & 2032
- Figure 37: North America Asphalt Additives Industry Revenue Share (%), by Application 2024 & 2032
- Figure 38: North America Asphalt Additives Industry Volume Share (%), by Application 2024 & 2032
- Figure 39: North America Asphalt Additives Industry Revenue (Million), by End-user Industry 2024 & 2032
- Figure 40: North America Asphalt Additives Industry Volume (K Tons), by End-user Industry 2024 & 2032
- Figure 41: North America Asphalt Additives Industry Revenue Share (%), by End-user Industry 2024 & 2032
- Figure 42: North America Asphalt Additives Industry Volume Share (%), by End-user Industry 2024 & 2032
- Figure 43: North America Asphalt Additives Industry Revenue (Million), by Country 2024 & 2032
- Figure 44: North America Asphalt Additives Industry Volume (K Tons), by Country 2024 & 2032
- Figure 45: North America Asphalt Additives Industry Revenue Share (%), by Country 2024 & 2032
- Figure 46: North America Asphalt Additives Industry Volume Share (%), by Country 2024 & 2032
- Figure 47: Europe Asphalt Additives Industry Revenue (Million), by Application 2024 & 2032
- Figure 48: Europe Asphalt Additives Industry Volume (K Tons), by Application 2024 & 2032
- Figure 49: Europe Asphalt Additives Industry Revenue Share (%), by Application 2024 & 2032
- Figure 50: Europe Asphalt Additives Industry Volume Share (%), by Application 2024 & 2032
- Figure 51: Europe Asphalt Additives Industry Revenue (Million), by End-user Industry 2024 & 2032
- Figure 52: Europe Asphalt Additives Industry Volume (K Tons), by End-user Industry 2024 & 2032
- Figure 53: Europe Asphalt Additives Industry Revenue Share (%), by End-user Industry 2024 & 2032
- Figure 54: Europe Asphalt Additives Industry Volume Share (%), by End-user Industry 2024 & 2032
- Figure 55: Europe Asphalt Additives Industry Revenue (Million), by Country 2024 & 2032
- Figure 56: Europe Asphalt Additives Industry Volume (K Tons), by Country 2024 & 2032
- Figure 57: Europe Asphalt Additives Industry Revenue Share (%), by Country 2024 & 2032
- Figure 58: Europe Asphalt Additives Industry Volume Share (%), by Country 2024 & 2032
- Figure 59: South America Asphalt Additives Industry Revenue (Million), by Application 2024 & 2032
- Figure 60: South America Asphalt Additives Industry Volume (K Tons), by Application 2024 & 2032
- Figure 61: South America Asphalt Additives Industry Revenue Share (%), by Application 2024 & 2032
- Figure 62: South America Asphalt Additives Industry Volume Share (%), by Application 2024 & 2032
- Figure 63: South America Asphalt Additives Industry Revenue (Million), by End-user Industry 2024 & 2032
- Figure 64: South America Asphalt Additives Industry Volume (K Tons), by End-user Industry 2024 & 2032
- Figure 65: South America Asphalt Additives Industry Revenue Share (%), by End-user Industry 2024 & 2032
- Figure 66: South America Asphalt Additives Industry Volume Share (%), by End-user Industry 2024 & 2032
- Figure 67: South America Asphalt Additives Industry Revenue (Million), by Country 2024 & 2032
- Figure 68: South America Asphalt Additives Industry Volume (K Tons), by Country 2024 & 2032
- Figure 69: South America Asphalt Additives Industry Revenue Share (%), by Country 2024 & 2032
- Figure 70: South America Asphalt Additives Industry Volume Share (%), by Country 2024 & 2032
- Figure 71: Middle East Asphalt Additives Industry Revenue (Million), by Application 2024 & 2032
- Figure 72: Middle East Asphalt Additives Industry Volume (K Tons), by Application 2024 & 2032
- Figure 73: Middle East Asphalt Additives Industry Revenue Share (%), by Application 2024 & 2032
- Figure 74: Middle East Asphalt Additives Industry Volume Share (%), by Application 2024 & 2032
- Figure 75: Middle East Asphalt Additives Industry Revenue (Million), by End-user Industry 2024 & 2032
- Figure 76: Middle East Asphalt Additives Industry Volume (K Tons), by End-user Industry 2024 & 2032
- Figure 77: Middle East Asphalt Additives Industry Revenue Share (%), by End-user Industry 2024 & 2032
- Figure 78: Middle East Asphalt Additives Industry Volume Share (%), by End-user Industry 2024 & 2032
- Figure 79: Middle East Asphalt Additives Industry Revenue (Million), by Country 2024 & 2032
- Figure 80: Middle East Asphalt Additives Industry Volume (K Tons), by Country 2024 & 2032
- Figure 81: Middle East Asphalt Additives Industry Revenue Share (%), by Country 2024 & 2032
- Figure 82: Middle East Asphalt Additives Industry Volume Share (%), by Country 2024 & 2032
- Figure 83: Saudi Arabia Asphalt Additives Industry Revenue (Million), by Application 2024 & 2032
- Figure 84: Saudi Arabia Asphalt Additives Industry Volume (K Tons), by Application 2024 & 2032
- Figure 85: Saudi Arabia Asphalt Additives Industry Revenue Share (%), by Application 2024 & 2032
- Figure 86: Saudi Arabia Asphalt Additives Industry Volume Share (%), by Application 2024 & 2032
- Figure 87: Saudi Arabia Asphalt Additives Industry Revenue (Million), by End-user Industry 2024 & 2032
- Figure 88: Saudi Arabia Asphalt Additives Industry Volume (K Tons), by End-user Industry 2024 & 2032
- Figure 89: Saudi Arabia Asphalt Additives Industry Revenue Share (%), by End-user Industry 2024 & 2032
- Figure 90: Saudi Arabia Asphalt Additives Industry Volume Share (%), by End-user Industry 2024 & 2032
- Figure 91: Saudi Arabia Asphalt Additives Industry Revenue (Million), by Country 2024 & 2032
- Figure 92: Saudi Arabia Asphalt Additives Industry Volume (K Tons), by Country 2024 & 2032
- Figure 93: Saudi Arabia Asphalt Additives Industry Revenue Share (%), by Country 2024 & 2032
- Figure 94: Saudi Arabia Asphalt Additives Industry Volume Share (%), by Country 2024 & 2032
List of Tables
- Table 1: Global Asphalt Additives Industry Revenue Million Forecast, by Region 2019 & 2032
- Table 2: Global Asphalt Additives Industry Volume K Tons Forecast, by Region 2019 & 2032
- Table 3: Global Asphalt Additives Industry Revenue Million Forecast, by Application 2019 & 2032
- Table 4: Global Asphalt Additives Industry Volume K Tons Forecast, by Application 2019 & 2032
- Table 5: Global Asphalt Additives Industry Revenue Million Forecast, by End-user Industry 2019 & 2032
- Table 6: Global Asphalt Additives Industry Volume K Tons Forecast, by End-user Industry 2019 & 2032
- Table 7: Global Asphalt Additives Industry Revenue Million Forecast, by Region 2019 & 2032
- Table 8: Global Asphalt Additives Industry Volume K Tons Forecast, by Region 2019 & 2032
- Table 9: Global Asphalt Additives Industry Revenue Million Forecast, by Country 2019 & 2032
- Table 10: Global Asphalt Additives Industry Volume K Tons Forecast, by Country 2019 & 2032
- Table 11: United States Asphalt Additives Industry Revenue (Million) Forecast, by Application 2019 & 2032
- Table 12: United States Asphalt Additives Industry Volume (K Tons) Forecast, by Application 2019 & 2032
- Table 13: Canada Asphalt Additives Industry Revenue (Million) Forecast, by Application 2019 & 2032
- Table 14: Canada Asphalt Additives Industry Volume (K Tons) Forecast, by Application 2019 & 2032
- Table 15: Mexico Asphalt Additives Industry Revenue (Million) Forecast, by Application 2019 & 2032
- Table 16: Mexico Asphalt Additives Industry Volume (K Tons) Forecast, by Application 2019 & 2032
- Table 17: Global Asphalt Additives Industry Revenue Million Forecast, by Country 2019 & 2032
- Table 18: Global Asphalt Additives Industry Volume K Tons Forecast, by Country 2019 & 2032
- Table 19: United States Asphalt Additives Industry Revenue (Million) Forecast, by Application 2019 & 2032
- Table 20: United States Asphalt Additives Industry Volume (K Tons) Forecast, by Application 2019 & 2032
- Table 21: Canada Asphalt Additives Industry Revenue (Million) Forecast, by Application 2019 & 2032
- Table 22: Canada Asphalt Additives Industry Volume (K Tons) Forecast, by Application 2019 & 2032
- Table 23: Mexico Asphalt Additives Industry Revenue (Million) Forecast, by Application 2019 & 2032
- Table 24: Mexico Asphalt Additives Industry Volume (K Tons) Forecast, by Application 2019 & 2032
- Table 25: Global Asphalt Additives Industry Revenue Million Forecast, by Country 2019 & 2032
- Table 26: Global Asphalt Additives Industry Volume K Tons Forecast, by Country 2019 & 2032
- Table 27: China Asphalt Additives Industry Revenue (Million) Forecast, by Application 2019 & 2032
- Table 28: China Asphalt Additives Industry Volume (K Tons) Forecast, by Application 2019 & 2032
- Table 29: Japan Asphalt Additives Industry Revenue (Million) Forecast, by Application 2019 & 2032
- Table 30: Japan Asphalt Additives Industry Volume (K Tons) Forecast, by Application 2019 & 2032
- Table 31: India Asphalt Additives Industry Revenue (Million) Forecast, by Application 2019 & 2032
- Table 32: India Asphalt Additives Industry Volume (K Tons) Forecast, by Application 2019 & 2032
- Table 33: South Korea Asphalt Additives Industry Revenue (Million) Forecast, by Application 2019 & 2032
- Table 34: South Korea Asphalt Additives Industry Volume (K Tons) Forecast, by Application 2019 & 2032
- Table 35: Taiwan Asphalt Additives Industry Revenue (Million) Forecast, by Application 2019 & 2032
- Table 36: Taiwan Asphalt Additives Industry Volume (K Tons) Forecast, by Application 2019 & 2032
- Table 37: Australia Asphalt Additives Industry Revenue (Million) Forecast, by Application 2019 & 2032
- Table 38: Australia Asphalt Additives Industry Volume (K Tons) Forecast, by Application 2019 & 2032
- Table 39: Rest of Asia-Pacific Asphalt Additives Industry Revenue (Million) Forecast, by Application 2019 & 2032
- Table 40: Rest of Asia-Pacific Asphalt Additives Industry Volume (K Tons) Forecast, by Application 2019 & 2032
- Table 41: Global Asphalt Additives Industry Revenue Million Forecast, by Country 2019 & 2032
- Table 42: Global Asphalt Additives Industry Volume K Tons Forecast, by Country 2019 & 2032
- Table 43: Brazil Asphalt Additives Industry Revenue (Million) Forecast, by Application 2019 & 2032
- Table 44: Brazil Asphalt Additives Industry Volume (K Tons) Forecast, by Application 2019 & 2032
- Table 45: Argentina Asphalt Additives Industry Revenue (Million) Forecast, by Application 2019 & 2032
- Table 46: Argentina Asphalt Additives Industry Volume (K Tons) Forecast, by Application 2019 & 2032
- Table 47: Rest of South America Asphalt Additives Industry Revenue (Million) Forecast, by Application 2019 & 2032
- Table 48: Rest of South America Asphalt Additives Industry Volume (K Tons) Forecast, by Application 2019 & 2032
- Table 49: Global Asphalt Additives Industry Revenue Million Forecast, by Country 2019 & 2032
- Table 50: Global Asphalt Additives Industry Volume K Tons Forecast, by Country 2019 & 2032
- Table 51: Middle East Asphalt Additives Industry Revenue (Million) Forecast, by Application 2019 & 2032
- Table 52: Middle East Asphalt Additives Industry Volume (K Tons) Forecast, by Application 2019 & 2032
- Table 53: Africa Asphalt Additives Industry Revenue (Million) Forecast, by Application 2019 & 2032
- Table 54: Africa Asphalt Additives Industry Volume (K Tons) Forecast, by Application 2019 & 2032
- Table 55: Global Asphalt Additives Industry Revenue Million Forecast, by Application 2019 & 2032
- Table 56: Global Asphalt Additives Industry Volume K Tons Forecast, by Application 2019 & 2032
- Table 57: Global Asphalt Additives Industry Revenue Million Forecast, by End-user Industry 2019 & 2032
- Table 58: Global Asphalt Additives Industry Volume K Tons Forecast, by End-user Industry 2019 & 2032
- Table 59: Global Asphalt Additives Industry Revenue Million Forecast, by Country 2019 & 2032
- Table 60: Global Asphalt Additives Industry Volume K Tons Forecast, by Country 2019 & 2032
- Table 61: China Asphalt Additives Industry Revenue (Million) Forecast, by Application 2019 & 2032
- Table 62: China Asphalt Additives Industry Volume (K Tons) Forecast, by Application 2019 & 2032
- Table 63: India Asphalt Additives Industry Revenue (Million) Forecast, by Application 2019 & 2032
- Table 64: India Asphalt Additives Industry Volume (K Tons) Forecast, by Application 2019 & 2032
- Table 65: Japan Asphalt Additives Industry Revenue (Million) Forecast, by Application 2019 & 2032
- Table 66: Japan Asphalt Additives Industry Volume (K Tons) Forecast, by Application 2019 & 2032
- Table 67: South Korea Asphalt Additives Industry Revenue (Million) Forecast, by Application 2019 & 2032
- Table 68: South Korea Asphalt Additives Industry Volume (K Tons) Forecast, by Application 2019 & 2032
- Table 69: Australia Asphalt Additives Industry Revenue (Million) Forecast, by Application 2019 & 2032
- Table 70: Australia Asphalt Additives Industry Volume (K Tons) Forecast, by Application 2019 & 2032
- Table 71: Rest of Asia Pacific Asphalt Additives Industry Revenue (Million) Forecast, by Application 2019 & 2032
- Table 72: Rest of Asia Pacific Asphalt Additives Industry Volume (K Tons) Forecast, by Application 2019 & 2032
- Table 73: Global Asphalt Additives Industry Revenue Million Forecast, by Application 2019 & 2032
- Table 74: Global Asphalt Additives Industry Volume K Tons Forecast, by Application 2019 & 2032
- Table 75: Global Asphalt Additives Industry Revenue Million Forecast, by End-user Industry 2019 & 2032
- Table 76: Global Asphalt Additives Industry Volume K Tons Forecast, by End-user Industry 2019 & 2032
- Table 77: Global Asphalt Additives Industry Revenue Million Forecast, by Country 2019 & 2032
- Table 78: Global Asphalt Additives Industry Volume K Tons Forecast, by Country 2019 & 2032
- Table 79: United States Asphalt Additives Industry Revenue (Million) Forecast, by Application 2019 & 2032
- Table 80: United States Asphalt Additives Industry Volume (K Tons) Forecast, by Application 2019 & 2032
- Table 81: Canada Asphalt Additives Industry Revenue (Million) Forecast, by Application 2019 & 2032
- Table 82: Canada Asphalt Additives Industry Volume (K Tons) Forecast, by Application 2019 & 2032
- Table 83: Mexico Asphalt Additives Industry Revenue (Million) Forecast, by Application 2019 & 2032
- Table 84: Mexico Asphalt Additives Industry Volume (K Tons) Forecast, by Application 2019 & 2032
- Table 85: Global Asphalt Additives Industry Revenue Million Forecast, by Application 2019 & 2032
- Table 86: Global Asphalt Additives Industry Volume K Tons Forecast, by Application 2019 & 2032
- Table 87: Global Asphalt Additives Industry Revenue Million Forecast, by End-user Industry 2019 & 2032
- Table 88: Global Asphalt Additives Industry Volume K Tons Forecast, by End-user Industry 2019 & 2032
- Table 89: Global Asphalt Additives Industry Revenue Million Forecast, by Country 2019 & 2032
- Table 90: Global Asphalt Additives Industry Volume K Tons Forecast, by Country 2019 & 2032
- Table 91: Germany Asphalt Additives Industry Revenue (Million) Forecast, by Application 2019 & 2032
- Table 92: Germany Asphalt Additives Industry Volume (K Tons) Forecast, by Application 2019 & 2032
- Table 93: United Kingdom Asphalt Additives Industry Revenue (Million) Forecast, by Application 2019 & 2032
- Table 94: United Kingdom Asphalt Additives Industry Volume (K Tons) Forecast, by Application 2019 & 2032
- Table 95: Italy Asphalt Additives Industry Revenue (Million) Forecast, by Application 2019 & 2032
- Table 96: Italy Asphalt Additives Industry Volume (K Tons) Forecast, by Application 2019 & 2032
- Table 97: France Asphalt Additives Industry Revenue (Million) Forecast, by Application 2019 & 2032
- Table 98: France Asphalt Additives Industry Volume (K Tons) Forecast, by Application 2019 & 2032
- Table 99: Rest of Europe Asphalt Additives Industry Revenue (Million) Forecast, by Application 2019 & 2032
- Table 100: Rest of Europe Asphalt Additives Industry Volume (K Tons) Forecast, by Application 2019 & 2032
- Table 101: Global Asphalt Additives Industry Revenue Million Forecast, by Application 2019 & 2032
- Table 102: Global Asphalt Additives Industry Volume K Tons Forecast, by Application 2019 & 2032
- Table 103: Global Asphalt Additives Industry Revenue Million Forecast, by End-user Industry 2019 & 2032
- Table 104: Global Asphalt Additives Industry Volume K Tons Forecast, by End-user Industry 2019 & 2032
- Table 105: Global Asphalt Additives Industry Revenue Million Forecast, by Country 2019 & 2032
- Table 106: Global Asphalt Additives Industry Volume K Tons Forecast, by Country 2019 & 2032
- Table 107: Brazil Asphalt Additives Industry Revenue (Million) Forecast, by Application 2019 & 2032
- Table 108: Brazil Asphalt Additives Industry Volume (K Tons) Forecast, by Application 2019 & 2032
- Table 109: Argentina Asphalt Additives Industry Revenue (Million) Forecast, by Application 2019 & 2032
- Table 110: Argentina Asphalt Additives Industry Volume (K Tons) Forecast, by Application 2019 & 2032
- Table 111: Colombia Asphalt Additives Industry Revenue (Million) Forecast, by Application 2019 & 2032
- Table 112: Colombia Asphalt Additives Industry Volume (K Tons) Forecast, by Application 2019 & 2032
- Table 113: Rest of South America Asphalt Additives Industry Revenue (Million) Forecast, by Application 2019 & 2032
- Table 114: Rest of South America Asphalt Additives Industry Volume (K Tons) Forecast, by Application 2019 & 2032
- Table 115: Global Asphalt Additives Industry Revenue Million Forecast, by Application 2019 & 2032
- Table 116: Global Asphalt Additives Industry Volume K Tons Forecast, by Application 2019 & 2032
- Table 117: Global Asphalt Additives Industry Revenue Million Forecast, by End-user Industry 2019 & 2032
- Table 118: Global Asphalt Additives Industry Volume K Tons Forecast, by End-user Industry 2019 & 2032
- Table 119: Global Asphalt Additives Industry Revenue Million Forecast, by Country 2019 & 2032
- Table 120: Global Asphalt Additives Industry Volume K Tons Forecast, by Country 2019 & 2032
- Table 121: Global Asphalt Additives Industry Revenue Million Forecast, by Application 2019 & 2032
- Table 122: Global Asphalt Additives Industry Volume K Tons Forecast, by Application 2019 & 2032
- Table 123: Global Asphalt Additives Industry Revenue Million Forecast, by End-user Industry 2019 & 2032
- Table 124: Global Asphalt Additives Industry Volume K Tons Forecast, by End-user Industry 2019 & 2032
- Table 125: Global Asphalt Additives Industry Revenue Million Forecast, by Country 2019 & 2032
- Table 126: Global Asphalt Additives Industry Volume K Tons Forecast, by Country 2019 & 2032
- Table 127: South Africa Asphalt Additives Industry Revenue (Million) Forecast, by Application 2019 & 2032
- Table 128: South Africa Asphalt Additives Industry Volume (K Tons) Forecast, by Application 2019 & 2032
- Table 129: Qatar Asphalt Additives Industry Revenue (Million) Forecast, by Application 2019 & 2032
- Table 130: Qatar Asphalt Additives Industry Volume (K Tons) Forecast, by Application 2019 & 2032
- Table 131: Rest of Middle East Asphalt Additives Industry Revenue (Million) Forecast, by Application 2019 & 2032
- Table 132: Rest of Middle East Asphalt Additives Industry Volume (K Tons) Forecast, by Application 2019 & 2032
Frequently Asked Questions
1. What is the projected Compound Annual Growth Rate (CAGR) of the Asphalt Additives Industry?
The projected CAGR is approximately 5.34%.
2. Which companies are prominent players in the Asphalt Additives Industry?
Key companies in the market include Sasol, Honeywell International Inc, Arkema, Kraton Corporation, Nouryon, Exxon Mobil Corporation, Evonik Industries AG, Cargill, BASF SE, DuPont, Dow, PQ Corporation, ArrMaz Products Inc, Engineered Additives LLC, Kao Corporation, McAsphalt Industries Limited, Genan Holding A/S.
3. What are the main segments of the Asphalt Additives Industry?
The market segments include Application, End-user Industry.
4. Can you provide details about the market size?
The market size is estimated to be USD 4.37 Million as of 2022.
5. What are some drivers contributing to market growth?
High Traffic Volume and Heavier Loads; Emphasis on Meeting Super-save Design Specifications; Increased Pavement Work-life and Reduced MRO Cost Advantages.
6. What are the notable trends driving market growth?
Increasing Demand from Paving Application.
7. Are there any restraints impacting market growth?
High Initial Cost for Using Modified Asphalt Cement; Occupational Health Hazards Regarding Asphalt.
8. Can you provide examples of recent developments in the market?
January 2023: Dow is the supporter of The Road Forward, an initiative by the National Asphalt Pavement Association (NAPA), Greenbelt, Maryland, that aims to achieve net zero carbon emissions for the asphalt pavement industry.
9. What pricing options are available for accessing the report?
Pricing options include single-user, multi-user, and enterprise licenses priced at USD 4750, USD 5250, and USD 8750 respectively.
10. Is the market size provided in terms of value or volume?
The market size is provided in terms of value, measured in Million and volume, measured in K Tons.
11. Are there any specific market keywords associated with the report?
Yes, the market keyword associated with the report is "Asphalt Additives Industry," which aids in identifying and referencing the specific market segment covered.
12. How do I determine which pricing option suits my needs best?
The pricing options vary based on user requirements and access needs. Individual users may opt for single-user licenses, while businesses requiring broader access may choose multi-user or enterprise licenses for cost-effective access to the report.
13. Are there any additional resources or data provided in the Asphalt Additives Industry report?
While the report offers comprehensive insights, it's advisable to review the specific contents or supplementary materials provided to ascertain if additional resources or data are available.
14. How can I stay updated on further developments or reports in the Asphalt Additives Industry?
To stay informed about further developments, trends, and reports in the Asphalt Additives Industry, consider subscribing to industry newsletters, following relevant companies and organizations, or regularly checking reputable industry news sources and publications.
Methodology
Step 1 - Identification of Relevant Samples Size from Population Database


Step 2 - Approaches for Defining Global Market Size (Value, Volume* & Price*)

Note*: In applicable scenarios
Step 3 - Data Sources
Primary Research
- Web Analytics
- Survey Reports
- Research Institute
- Latest Research Reports
- Opinion Leaders
Secondary Research
- Annual Reports
- White Paper
- Latest Press Release
- Industry Association
- Paid Database
- Investor Presentations

Step 4 - Data Triangulation
Involves using different sources of information in order to increase the validity of a study
These sources are likely to be stakeholders in a program - participants, other researchers, program staff, other community members, and so on.
Then we put all data in single framework & apply various statistical tools to find out the dynamic on the market.
During the analysis stage, feedback from the stakeholder groups would be compared to determine areas of agreement as well as areas of divergence
