

Key Insights
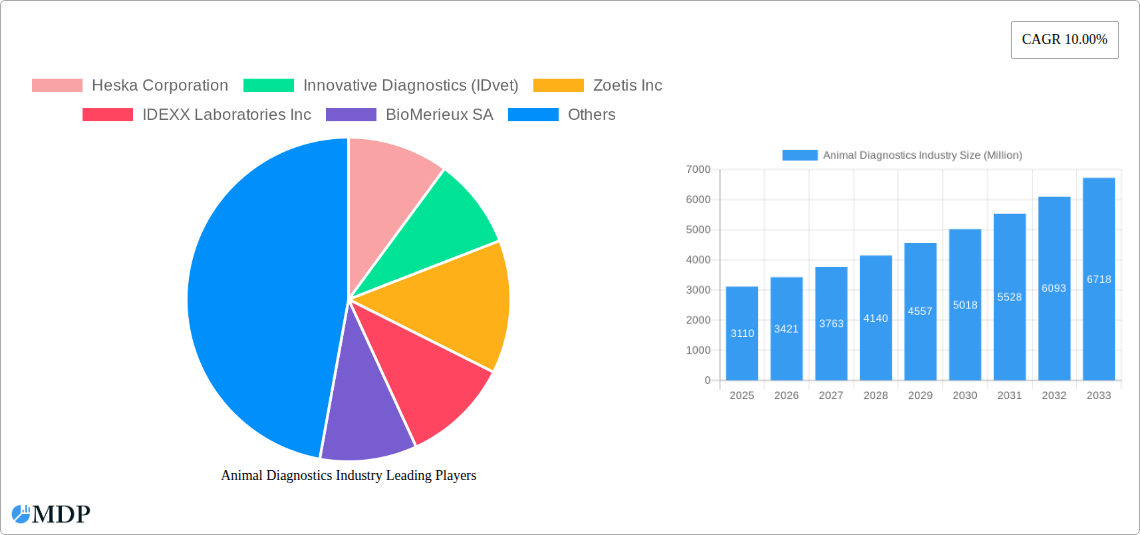
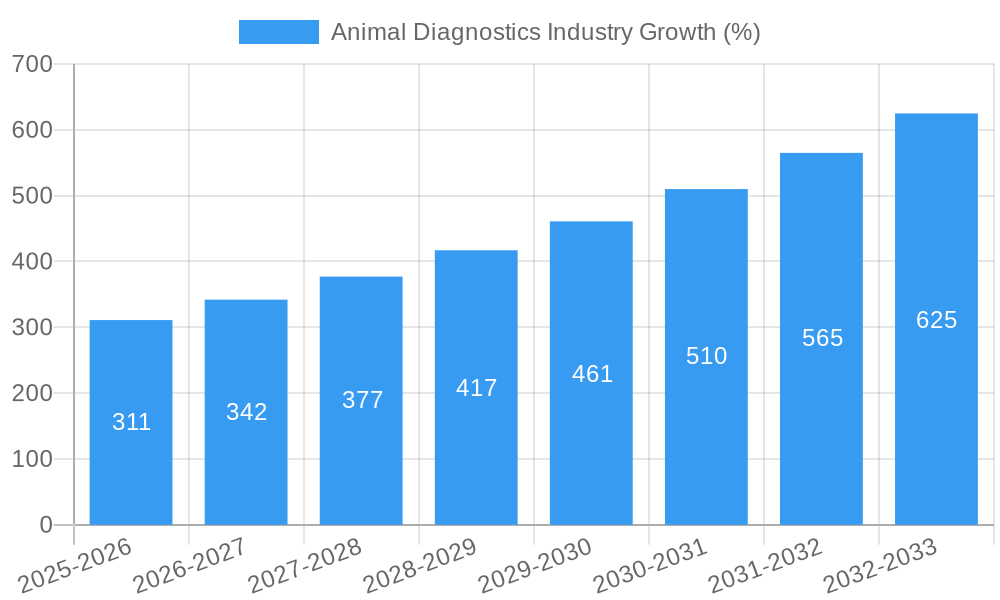
The global animal diagnostics market, valued at approximately $3.11 billion in 2025, is projected to experience robust growth, driven by several key factors. Increasing pet ownership worldwide, coupled with rising pet humanization leading to greater investment in animal health, significantly fuels market expansion. Advances in diagnostic technologies, particularly in immunodiagnostics and molecular diagnostics, are offering faster, more accurate, and sensitive diagnostic capabilities, enhancing disease detection and treatment efficacy. The expanding veterinary profession and the establishment of specialized veterinary clinics and hospitals also contribute to increased demand for advanced diagnostic tools. Furthermore, the growing prevalence of zoonotic diseases—diseases transmissible from animals to humans—is prompting greater investment in animal diagnostics to mitigate public health risks. The market is segmented by animal type (cats, dogs, other animals), application (bacteriology, parasitology, clinical pathology, other applications), and technology (immunodiagnostic tests, molecular diagnostics, diagnostic imaging, other diagnostics), each presenting unique growth opportunities.
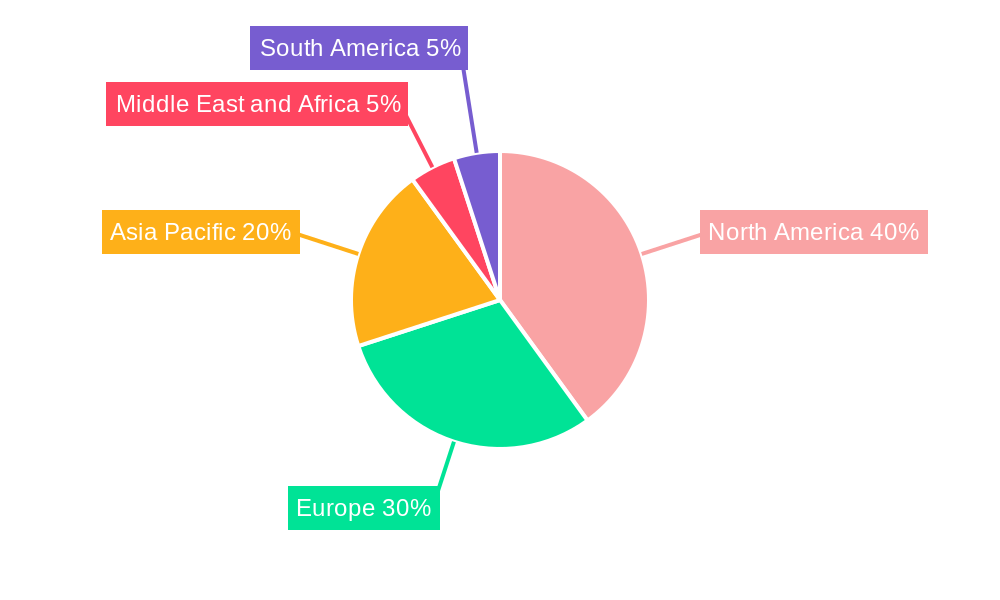
Market segmentation reveals significant variations in growth rates. The canine and feline segments are likely to dominate due to high pet ownership and the associated healthcare expenditure. Immunodiagnostic tests, due to their established market presence and relatively lower cost, currently hold a larger share than molecular diagnostics, but the latter's segment is experiencing faster growth, driven by increasing sophistication and sensitivity. Geographically, North America and Europe currently command the largest market shares, owing to advanced veterinary infrastructure and high pet ownership rates. However, the Asia-Pacific region is predicted to witness substantial growth in the forecast period (2025-2033), driven by rising pet ownership, economic development, and increasing veterinary awareness in emerging economies. Competitive dynamics are shaped by established players like IDEXX Laboratories, Zoetis, and Heska Corporation, alongside emerging companies offering innovative diagnostic solutions. The consistent 10% CAGR indicates sustained, strong growth over the forecast period.
Animal Diagnostics Industry Market Report: 2019-2033
Dive deep into the booming Animal Diagnostics market with this comprehensive report, projecting a market value of $XX Million by 2033. This in-depth analysis covers market dynamics, leading players, technological advancements, and future growth opportunities across various animal segments (cats, dogs, other animals), applications (bacteriology, parasitology, clinical pathology, etc.), and diagnostic technologies (immunodiagnostic tests, molecular diagnostics, etc.). The report utilizes data from the historical period (2019-2024), the base year (2025), and forecasts to 2033, providing crucial insights for stakeholders in this rapidly evolving industry.
Animal Diagnostics Industry Market Dynamics & Concentration
The global animal diagnostics market, valued at $XX Million in 2024, is characterized by a moderately consolidated structure with key players holding significant market share. While IDEXX Laboratories Inc. and Zoetis Inc. currently dominate, the market exhibits strong competitive intensity, fueled by ongoing innovation and strategic acquisitions. The market is driven by increasing pet ownership, rising pet healthcare expenditure, advancements in diagnostic technologies, and stringent regulatory frameworks promoting animal health and welfare. Several factors influence market concentration, including:
- Innovation Drivers: Continuous development of advanced diagnostic tools like molecular diagnostics and immunodiagnostic tests, driving market expansion and competitive advantage.
- Regulatory Frameworks: Stringent regulations regarding animal health and disease surveillance push the adoption of advanced diagnostics, impacting market growth and player strategies.
- Product Substitutes: The presence of alternative diagnostic methods, albeit limited, influences pricing and adoption rates within specific segments.
- End-User Trends: Growing demand for faster, more accurate, and point-of-care diagnostics shapes market growth. The shift towards personalized pet healthcare also fuels market expansion.
- M&A Activities: A significant number of mergers and acquisitions (xx deals in the last 5 years) have reshaped the market landscape, impacting both market concentration and technological advancements. For example, the acquisition of [mention specific example if available, otherwise use "Company A by Company B"] significantly expanded the market share of [Company B]. Key players are actively pursuing strategic partnerships and acquisitions to enhance their product portfolios and expand their geographic reach.
Animal Diagnostics Industry Industry Trends & Analysis
The animal diagnostics market is experiencing robust growth, driven by several key factors. The CAGR for the period 2025-2033 is estimated to be XX%, reflecting a substantial increase in market size. This growth is fueled by:
- Rising Pet Ownership & Humanization of Pets: Increased pet ownership globally, coupled with the growing trend of treating pets as family members, significantly boosts demand for advanced diagnostic services. This is particularly pronounced in developed regions with higher disposable incomes.
- Technological Disruptions: The introduction of innovative technologies, including point-of-care diagnostics, advanced molecular techniques, and AI-powered image analysis, is transforming the industry, enhancing accuracy, speed, and efficiency.
- Consumer Preferences: Pet owners are increasingly demanding faster and more accurate diagnostic tests, leading to a higher adoption rate of advanced diagnostic tools. The preference for minimally invasive procedures also contributes to market growth.
- Competitive Dynamics: The presence of both established multinational corporations and innovative smaller players fosters healthy competition, leading to continuous improvement in the quality and affordability of animal diagnostics. Market penetration of advanced technologies is accelerating due to this competition, pushing for increased efficiency and improved outcomes. Market penetration for molecular diagnostics is projected to reach XX% by 2033.
Leading Markets & Segments in Animal Diagnostics Industry
The North American region currently dominates the animal diagnostics market, driven by factors including high pet ownership rates, advanced healthcare infrastructure, and substantial investment in research and development. However, Asia-Pacific is anticipated to witness significant growth during the forecast period, fueled by increasing pet ownership and rising disposable incomes.
Key Drivers:
- Economic Policies: Government initiatives supporting animal health and welfare, along with investments in veterinary infrastructure, are fostering market growth.
- Infrastructure: The availability of advanced veterinary clinics and diagnostic laboratories significantly impacts market adoption and expansion.
Dominance Analysis:
- Animals: Dogs and cats comprise the largest market segments, driven by higher pet ownership and spending on pet health. However, the "other animals" segment is projected to show strong growth, driven by increased focus on livestock health and disease management.
- Applications: Clinical pathology holds the largest market share, owing to its routine use in veterinary practices. However, molecular diagnostics is experiencing the fastest growth, driven by its ability to detect a wide range of pathogens.
- Technology: Immunodiagnostic tests currently dominate the market, but molecular diagnostics and diagnostic imaging are witnessing rapid adoption due to their improved accuracy and capabilities.
Animal Diagnostics Industry Product Developments
Recent product developments highlight a significant shift towards faster, more accurate, and user-friendly diagnostic tools. This includes advancements in point-of-care testing, automated analyzers, and integrated software solutions that streamline workflows for veterinary professionals. The integration of artificial intelligence and machine learning is also improving diagnostic accuracy and efficiency. These innovations are tailored to address the increasing demands for personalized veterinary care and improved disease management.
Key Drivers of Animal Diagnostics Industry Growth
Several factors contribute to the growth of the animal diagnostics industry:
- Technological Advancements: The development of faster, more accurate, and portable diagnostic tools, including point-of-care tests and molecular diagnostics, is a major driver.
- Economic Factors: Increasing pet ownership and rising disposable incomes in developing economies are expanding the market.
- Regulatory Changes: Government regulations promoting animal health and welfare are driving the adoption of advanced diagnostic technologies. For example, the implementation of stricter regulations on the import/export of animals may necessitate broader use of diagnostic testing.
Challenges in the Animal Diagnostics Industry Market
The animal diagnostics industry faces challenges including:
- Regulatory Hurdles: Navigating complex regulatory requirements for new diagnostic products can delay market entry and increase development costs.
- Supply Chain Issues: Disruptions in the supply chain can lead to shortages of essential reagents and diagnostic components, affecting the availability of tests.
- Competitive Pressures: Intense competition among established players and emerging companies puts downward pressure on prices and profit margins. The competitive landscape impacts pricing strategies and market share. This pressure is estimated to affect profitability by an average of XX% annually over the forecast period.
Emerging Opportunities in Animal Diagnostics Industry
Significant opportunities exist for growth, driven by several factors:
- Technological Breakthroughs: Advancements in artificial intelligence, big data analytics, and personalized medicine are poised to revolutionize the industry.
- Strategic Partnerships: Collaborations between diagnostic companies and veterinary practices can foster innovation and improve access to advanced diagnostic services.
- Market Expansion: Expanding into emerging markets with growing pet ownership and improving veterinary infrastructure presents significant growth potential.
Leading Players in the Animal Diagnostics Industry Sector
- Heska Corporation
- Innovative Diagnostics (IDvet)
- Zoetis Inc
- IDEXX Laboratories Inc
- BioMerieux SA
- Randox Laboratories Ltd
- Chembio Diagnostic Systems Inc
- Thermo Fisher Scientific Inc
- Indical Bioscience GmbH
- Creative Diagnostics
- Agrolabo SpA
- Virbac
- Neogen Corporation
Key Milestones in Animal Diagnostics Industry Industry
- January 2022: IDEXX Laboratories, Inc. launched several product and service enhancements, including the IDEXX 4Dx Plus Test, VetConnectPLUS Mobile App, SediVue Dx Urine Sediment Analyzer, and a new Catalyst SDMA Test, improving veterinary practice efficiency.
- August 2022: PepiPets launched a new mobile diagnostic testing service, bringing diagnostic testing directly to pet owners' homes. This service disrupted traditional veterinary testing workflows and expanded access to diagnostics.
Strategic Outlook for Animal Diagnostics Industry Market
The animal diagnostics market holds immense future potential, driven by continuous technological innovation, expanding pet ownership, and increasing demand for personalized veterinary care. Strategic partnerships, focused research and development, and expansion into emerging markets will be critical for success in this dynamic industry. The focus on point-of-care diagnostics and integration with telehealth platforms will shape the future of animal diagnostics, promising more convenient and accessible testing for pet owners globally.
Animal Diagnostics Industry Segmentation
-
1. Animals
- 1.1. Cats
- 1.2. Dogs
- 1.3. Other Animals
-
2. Application
- 2.1. Bacteriology
- 2.2. Parasitology
- 2.3. Clinical Pathology
- 2.4. Other Applications
-
3. Technology
- 3.1. Immunodiagnostic Tests
- 3.2. Molecular Diagnostics
- 3.3. Diagnostic Imaging
- 3.4. Other Diagnostics
Animal Diagnostics Industry Segmentation By Geography
-
1. North America
- 1.1. United States
- 1.2. Canada
- 1.3. Mexico
-
2. Europe
- 2.1. Germany
- 2.2. United Kingdom
- 2.3. France
- 2.4. Italy
- 2.5. Spain
- 2.6. Rest of Europe
-
3. Asia Pacific
- 3.1. China
- 3.2. Japan
- 3.3. India
- 3.4. Australia
- 3.5. South Korea
- 3.6. Rest of Asia Pacific
-
4. Middle East and Africa
- 4.1. GCC
- 4.2. South Africa
- 4.3. Rest of Middle East and Africa
-
5. South America
- 5.1. Brazil
- 5.2. Argentina
- 5.3. Rest of South America
Animal Diagnostics Industry REPORT HIGHLIGHTS
| Aspects | Details |
|---|---|
| Study Period | 2019-2033 |
| Base Year | 2024 |
| Estimated Year | 2025 |
| Forecast Period | 2025-2033 |
| Historical Period | 2019-2024 |
| Growth Rate | CAGR of 10.00% from 2019-2033 |
| Segmentation |
|
Table of Contents
- 1. Introduction
- 1.1. Research Scope
- 1.2. Market Segmentation
- 1.3. Research Methodology
- 1.4. Definitions and Assumptions
- 2. Executive Summary
- 2.1. Introduction
- 3. Market Dynamics
- 3.1. Introduction
- 3.2. Market Drivers
- 3.2.1. Rising Demand for Pet Insurance; Growth in the Companion Animal Population; Increasing Number of Veterinary Practitioners in Developed Economies
- 3.3. Market Restrains
- 3.3.1. Rising Burden of the Pet Care Cost
- 3.4. Market Trends
- 3.4.1. Molecular Diagnostics is Expected to Witness Growth Over the Forecast Period
- 4. Market Factor Analysis
- 4.1. Porters Five Forces
- 4.2. Supply/Value Chain
- 4.3. PESTEL analysis
- 4.4. Market Entropy
- 4.5. Patent/Trademark Analysis
- 5. Global Animal Diagnostics Industry Analysis, Insights and Forecast, 2019-2031
- 5.1. Market Analysis, Insights and Forecast - by Animals
- 5.1.1. Cats
- 5.1.2. Dogs
- 5.1.3. Other Animals
- 5.2. Market Analysis, Insights and Forecast - by Application
- 5.2.1. Bacteriology
- 5.2.2. Parasitology
- 5.2.3. Clinical Pathology
- 5.2.4. Other Applications
- 5.3. Market Analysis, Insights and Forecast - by Technology
- 5.3.1. Immunodiagnostic Tests
- 5.3.2. Molecular Diagnostics
- 5.3.3. Diagnostic Imaging
- 5.3.4. Other Diagnostics
- 5.4. Market Analysis, Insights and Forecast - by Region
- 5.4.1. North America
- 5.4.2. Europe
- 5.4.3. Asia Pacific
- 5.4.4. Middle East and Africa
- 5.4.5. South America
- 5.1. Market Analysis, Insights and Forecast - by Animals
- 6. North America Animal Diagnostics Industry Analysis, Insights and Forecast, 2019-2031
- 6.1. Market Analysis, Insights and Forecast - by Animals
- 6.1.1. Cats
- 6.1.2. Dogs
- 6.1.3. Other Animals
- 6.2. Market Analysis, Insights and Forecast - by Application
- 6.2.1. Bacteriology
- 6.2.2. Parasitology
- 6.2.3. Clinical Pathology
- 6.2.4. Other Applications
- 6.3. Market Analysis, Insights and Forecast - by Technology
- 6.3.1. Immunodiagnostic Tests
- 6.3.2. Molecular Diagnostics
- 6.3.3. Diagnostic Imaging
- 6.3.4. Other Diagnostics
- 6.1. Market Analysis, Insights and Forecast - by Animals
- 7. Europe Animal Diagnostics Industry Analysis, Insights and Forecast, 2019-2031
- 7.1. Market Analysis, Insights and Forecast - by Animals
- 7.1.1. Cats
- 7.1.2. Dogs
- 7.1.3. Other Animals
- 7.2. Market Analysis, Insights and Forecast - by Application
- 7.2.1. Bacteriology
- 7.2.2. Parasitology
- 7.2.3. Clinical Pathology
- 7.2.4. Other Applications
- 7.3. Market Analysis, Insights and Forecast - by Technology
- 7.3.1. Immunodiagnostic Tests
- 7.3.2. Molecular Diagnostics
- 7.3.3. Diagnostic Imaging
- 7.3.4. Other Diagnostics
- 7.1. Market Analysis, Insights and Forecast - by Animals
- 8. Asia Pacific Animal Diagnostics Industry Analysis, Insights and Forecast, 2019-2031
- 8.1. Market Analysis, Insights and Forecast - by Animals
- 8.1.1. Cats
- 8.1.2. Dogs
- 8.1.3. Other Animals
- 8.2. Market Analysis, Insights and Forecast - by Application
- 8.2.1. Bacteriology
- 8.2.2. Parasitology
- 8.2.3. Clinical Pathology
- 8.2.4. Other Applications
- 8.3. Market Analysis, Insights and Forecast - by Technology
- 8.3.1. Immunodiagnostic Tests
- 8.3.2. Molecular Diagnostics
- 8.3.3. Diagnostic Imaging
- 8.3.4. Other Diagnostics
- 8.1. Market Analysis, Insights and Forecast - by Animals
- 9. Middle East and Africa Animal Diagnostics Industry Analysis, Insights and Forecast, 2019-2031
- 9.1. Market Analysis, Insights and Forecast - by Animals
- 9.1.1. Cats
- 9.1.2. Dogs
- 9.1.3. Other Animals
- 9.2. Market Analysis, Insights and Forecast - by Application
- 9.2.1. Bacteriology
- 9.2.2. Parasitology
- 9.2.3. Clinical Pathology
- 9.2.4. Other Applications
- 9.3. Market Analysis, Insights and Forecast - by Technology
- 9.3.1. Immunodiagnostic Tests
- 9.3.2. Molecular Diagnostics
- 9.3.3. Diagnostic Imaging
- 9.3.4. Other Diagnostics
- 9.1. Market Analysis, Insights and Forecast - by Animals
- 10. South America Animal Diagnostics Industry Analysis, Insights and Forecast, 2019-2031
- 10.1. Market Analysis, Insights and Forecast - by Animals
- 10.1.1. Cats
- 10.1.2. Dogs
- 10.1.3. Other Animals
- 10.2. Market Analysis, Insights and Forecast - by Application
- 10.2.1. Bacteriology
- 10.2.2. Parasitology
- 10.2.3. Clinical Pathology
- 10.2.4. Other Applications
- 10.3. Market Analysis, Insights and Forecast - by Technology
- 10.3.1. Immunodiagnostic Tests
- 10.3.2. Molecular Diagnostics
- 10.3.3. Diagnostic Imaging
- 10.3.4. Other Diagnostics
- 10.1. Market Analysis, Insights and Forecast - by Animals
- 11. North America Animal Diagnostics Industry Analysis, Insights and Forecast, 2019-2031
- 11.1. Market Analysis, Insights and Forecast - By Country/Sub-region
- 11.1.1 United States
- 11.1.2 Canada
- 11.1.3 Mexico
- 12. Europe Animal Diagnostics Industry Analysis, Insights and Forecast, 2019-2031
- 12.1. Market Analysis, Insights and Forecast - By Country/Sub-region
- 12.1.1 Germany
- 12.1.2 United Kingdom
- 12.1.3 France
- 12.1.4 Italy
- 12.1.5 Spain
- 12.1.6 Rest of Europe
- 13. Asia Pacific Animal Diagnostics Industry Analysis, Insights and Forecast, 2019-2031
- 13.1. Market Analysis, Insights and Forecast - By Country/Sub-region
- 13.1.1 China
- 13.1.2 Japan
- 13.1.3 India
- 13.1.4 Australia
- 13.1.5 South Korea
- 13.1.6 Rest of Asia Pacific
- 14. Middle East and Africa Animal Diagnostics Industry Analysis, Insights and Forecast, 2019-2031
- 14.1. Market Analysis, Insights and Forecast - By Country/Sub-region
- 14.1.1 GCC
- 14.1.2 South Africa
- 14.1.3 Rest of Middle East and Africa
- 15. South America Animal Diagnostics Industry Analysis, Insights and Forecast, 2019-2031
- 15.1. Market Analysis, Insights and Forecast - By Country/Sub-region
- 15.1.1 Brazil
- 15.1.2 Argentina
- 15.1.3 Rest of South America
- 16. Competitive Analysis
- 16.1. Global Market Share Analysis 2024
- 16.2. Company Profiles
- 16.2.1 Heska Corporation
- 16.2.1.1. Overview
- 16.2.1.2. Products
- 16.2.1.3. SWOT Analysis
- 16.2.1.4. Recent Developments
- 16.2.1.5. Financials (Based on Availability)
- 16.2.2 Innovative Diagnostics (IDvet)
- 16.2.2.1. Overview
- 16.2.2.2. Products
- 16.2.2.3. SWOT Analysis
- 16.2.2.4. Recent Developments
- 16.2.2.5. Financials (Based on Availability)
- 16.2.3 Zoetis Inc
- 16.2.3.1. Overview
- 16.2.3.2. Products
- 16.2.3.3. SWOT Analysis
- 16.2.3.4. Recent Developments
- 16.2.3.5. Financials (Based on Availability)
- 16.2.4 IDEXX Laboratories Inc
- 16.2.4.1. Overview
- 16.2.4.2. Products
- 16.2.4.3. SWOT Analysis
- 16.2.4.4. Recent Developments
- 16.2.4.5. Financials (Based on Availability)
- 16.2.5 BioMerieux SA
- 16.2.5.1. Overview
- 16.2.5.2. Products
- 16.2.5.3. SWOT Analysis
- 16.2.5.4. Recent Developments
- 16.2.5.5. Financials (Based on Availability)
- 16.2.6 Randox Laboratories Ltd
- 16.2.6.1. Overview
- 16.2.6.2. Products
- 16.2.6.3. SWOT Analysis
- 16.2.6.4. Recent Developments
- 16.2.6.5. Financials (Based on Availability)
- 16.2.7 Chembio Diagnostic Systems Inc
- 16.2.7.1. Overview
- 16.2.7.2. Products
- 16.2.7.3. SWOT Analysis
- 16.2.7.4. Recent Developments
- 16.2.7.5. Financials (Based on Availability)
- 16.2.8 Thermo Fisher Scientific Inc
- 16.2.8.1. Overview
- 16.2.8.2. Products
- 16.2.8.3. SWOT Analysis
- 16.2.8.4. Recent Developments
- 16.2.8.5. Financials (Based on Availability)
- 16.2.9 Indical Bioscience GmbH
- 16.2.9.1. Overview
- 16.2.9.2. Products
- 16.2.9.3. SWOT Analysis
- 16.2.9.4. Recent Developments
- 16.2.9.5. Financials (Based on Availability)
- 16.2.10 Creative Diagnostics
- 16.2.10.1. Overview
- 16.2.10.2. Products
- 16.2.10.3. SWOT Analysis
- 16.2.10.4. Recent Developments
- 16.2.10.5. Financials (Based on Availability)
- 16.2.11 Agrolabo SpA
- 16.2.11.1. Overview
- 16.2.11.2. Products
- 16.2.11.3. SWOT Analysis
- 16.2.11.4. Recent Developments
- 16.2.11.5. Financials (Based on Availability)
- 16.2.12 Virbac
- 16.2.12.1. Overview
- 16.2.12.2. Products
- 16.2.12.3. SWOT Analysis
- 16.2.12.4. Recent Developments
- 16.2.12.5. Financials (Based on Availability)
- 16.2.13 Neogen Corporation
- 16.2.13.1. Overview
- 16.2.13.2. Products
- 16.2.13.3. SWOT Analysis
- 16.2.13.4. Recent Developments
- 16.2.13.5. Financials (Based on Availability)
- 16.2.1 Heska Corporation
List of Figures
- Figure 1: Global Animal Diagnostics Industry Revenue Breakdown (Million, %) by Region 2024 & 2032
- Figure 2: Global Animal Diagnostics Industry Volume Breakdown (K Unit, %) by Region 2024 & 2032
- Figure 3: North America Animal Diagnostics Industry Revenue (Million), by Country 2024 & 2032
- Figure 4: North America Animal Diagnostics Industry Volume (K Unit), by Country 2024 & 2032
- Figure 5: North America Animal Diagnostics Industry Revenue Share (%), by Country 2024 & 2032
- Figure 6: North America Animal Diagnostics Industry Volume Share (%), by Country 2024 & 2032
- Figure 7: Europe Animal Diagnostics Industry Revenue (Million), by Country 2024 & 2032
- Figure 8: Europe Animal Diagnostics Industry Volume (K Unit), by Country 2024 & 2032
- Figure 9: Europe Animal Diagnostics Industry Revenue Share (%), by Country 2024 & 2032
- Figure 10: Europe Animal Diagnostics Industry Volume Share (%), by Country 2024 & 2032
- Figure 11: Asia Pacific Animal Diagnostics Industry Revenue (Million), by Country 2024 & 2032
- Figure 12: Asia Pacific Animal Diagnostics Industry Volume (K Unit), by Country 2024 & 2032
- Figure 13: Asia Pacific Animal Diagnostics Industry Revenue Share (%), by Country 2024 & 2032
- Figure 14: Asia Pacific Animal Diagnostics Industry Volume Share (%), by Country 2024 & 2032
- Figure 15: Middle East and Africa Animal Diagnostics Industry Revenue (Million), by Country 2024 & 2032
- Figure 16: Middle East and Africa Animal Diagnostics Industry Volume (K Unit), by Country 2024 & 2032
- Figure 17: Middle East and Africa Animal Diagnostics Industry Revenue Share (%), by Country 2024 & 2032
- Figure 18: Middle East and Africa Animal Diagnostics Industry Volume Share (%), by Country 2024 & 2032
- Figure 19: South America Animal Diagnostics Industry Revenue (Million), by Country 2024 & 2032
- Figure 20: South America Animal Diagnostics Industry Volume (K Unit), by Country 2024 & 2032
- Figure 21: South America Animal Diagnostics Industry Revenue Share (%), by Country 2024 & 2032
- Figure 22: South America Animal Diagnostics Industry Volume Share (%), by Country 2024 & 2032
- Figure 23: North America Animal Diagnostics Industry Revenue (Million), by Animals 2024 & 2032
- Figure 24: North America Animal Diagnostics Industry Volume (K Unit), by Animals 2024 & 2032
- Figure 25: North America Animal Diagnostics Industry Revenue Share (%), by Animals 2024 & 2032
- Figure 26: North America Animal Diagnostics Industry Volume Share (%), by Animals 2024 & 2032
- Figure 27: North America Animal Diagnostics Industry Revenue (Million), by Application 2024 & 2032
- Figure 28: North America Animal Diagnostics Industry Volume (K Unit), by Application 2024 & 2032
- Figure 29: North America Animal Diagnostics Industry Revenue Share (%), by Application 2024 & 2032
- Figure 30: North America Animal Diagnostics Industry Volume Share (%), by Application 2024 & 2032
- Figure 31: North America Animal Diagnostics Industry Revenue (Million), by Technology 2024 & 2032
- Figure 32: North America Animal Diagnostics Industry Volume (K Unit), by Technology 2024 & 2032
- Figure 33: North America Animal Diagnostics Industry Revenue Share (%), by Technology 2024 & 2032
- Figure 34: North America Animal Diagnostics Industry Volume Share (%), by Technology 2024 & 2032
- Figure 35: North America Animal Diagnostics Industry Revenue (Million), by Country 2024 & 2032
- Figure 36: North America Animal Diagnostics Industry Volume (K Unit), by Country 2024 & 2032
- Figure 37: North America Animal Diagnostics Industry Revenue Share (%), by Country 2024 & 2032
- Figure 38: North America Animal Diagnostics Industry Volume Share (%), by Country 2024 & 2032
- Figure 39: Europe Animal Diagnostics Industry Revenue (Million), by Animals 2024 & 2032
- Figure 40: Europe Animal Diagnostics Industry Volume (K Unit), by Animals 2024 & 2032
- Figure 41: Europe Animal Diagnostics Industry Revenue Share (%), by Animals 2024 & 2032
- Figure 42: Europe Animal Diagnostics Industry Volume Share (%), by Animals 2024 & 2032
- Figure 43: Europe Animal Diagnostics Industry Revenue (Million), by Application 2024 & 2032
- Figure 44: Europe Animal Diagnostics Industry Volume (K Unit), by Application 2024 & 2032
- Figure 45: Europe Animal Diagnostics Industry Revenue Share (%), by Application 2024 & 2032
- Figure 46: Europe Animal Diagnostics Industry Volume Share (%), by Application 2024 & 2032
- Figure 47: Europe Animal Diagnostics Industry Revenue (Million), by Technology 2024 & 2032
- Figure 48: Europe Animal Diagnostics Industry Volume (K Unit), by Technology 2024 & 2032
- Figure 49: Europe Animal Diagnostics Industry Revenue Share (%), by Technology 2024 & 2032
- Figure 50: Europe Animal Diagnostics Industry Volume Share (%), by Technology 2024 & 2032
- Figure 51: Europe Animal Diagnostics Industry Revenue (Million), by Country 2024 & 2032
- Figure 52: Europe Animal Diagnostics Industry Volume (K Unit), by Country 2024 & 2032
- Figure 53: Europe Animal Diagnostics Industry Revenue Share (%), by Country 2024 & 2032
- Figure 54: Europe Animal Diagnostics Industry Volume Share (%), by Country 2024 & 2032
- Figure 55: Asia Pacific Animal Diagnostics Industry Revenue (Million), by Animals 2024 & 2032
- Figure 56: Asia Pacific Animal Diagnostics Industry Volume (K Unit), by Animals 2024 & 2032
- Figure 57: Asia Pacific Animal Diagnostics Industry Revenue Share (%), by Animals 2024 & 2032
- Figure 58: Asia Pacific Animal Diagnostics Industry Volume Share (%), by Animals 2024 & 2032
- Figure 59: Asia Pacific Animal Diagnostics Industry Revenue (Million), by Application 2024 & 2032
- Figure 60: Asia Pacific Animal Diagnostics Industry Volume (K Unit), by Application 2024 & 2032
- Figure 61: Asia Pacific Animal Diagnostics Industry Revenue Share (%), by Application 2024 & 2032
- Figure 62: Asia Pacific Animal Diagnostics Industry Volume Share (%), by Application 2024 & 2032
- Figure 63: Asia Pacific Animal Diagnostics Industry Revenue (Million), by Technology 2024 & 2032
- Figure 64: Asia Pacific Animal Diagnostics Industry Volume (K Unit), by Technology 2024 & 2032
- Figure 65: Asia Pacific Animal Diagnostics Industry Revenue Share (%), by Technology 2024 & 2032
- Figure 66: Asia Pacific Animal Diagnostics Industry Volume Share (%), by Technology 2024 & 2032
- Figure 67: Asia Pacific Animal Diagnostics Industry Revenue (Million), by Country 2024 & 2032
- Figure 68: Asia Pacific Animal Diagnostics Industry Volume (K Unit), by Country 2024 & 2032
- Figure 69: Asia Pacific Animal Diagnostics Industry Revenue Share (%), by Country 2024 & 2032
- Figure 70: Asia Pacific Animal Diagnostics Industry Volume Share (%), by Country 2024 & 2032
- Figure 71: Middle East and Africa Animal Diagnostics Industry Revenue (Million), by Animals 2024 & 2032
- Figure 72: Middle East and Africa Animal Diagnostics Industry Volume (K Unit), by Animals 2024 & 2032
- Figure 73: Middle East and Africa Animal Diagnostics Industry Revenue Share (%), by Animals 2024 & 2032
- Figure 74: Middle East and Africa Animal Diagnostics Industry Volume Share (%), by Animals 2024 & 2032
- Figure 75: Middle East and Africa Animal Diagnostics Industry Revenue (Million), by Application 2024 & 2032
- Figure 76: Middle East and Africa Animal Diagnostics Industry Volume (K Unit), by Application 2024 & 2032
- Figure 77: Middle East and Africa Animal Diagnostics Industry Revenue Share (%), by Application 2024 & 2032
- Figure 78: Middle East and Africa Animal Diagnostics Industry Volume Share (%), by Application 2024 & 2032
- Figure 79: Middle East and Africa Animal Diagnostics Industry Revenue (Million), by Technology 2024 & 2032
- Figure 80: Middle East and Africa Animal Diagnostics Industry Volume (K Unit), by Technology 2024 & 2032
- Figure 81: Middle East and Africa Animal Diagnostics Industry Revenue Share (%), by Technology 2024 & 2032
- Figure 82: Middle East and Africa Animal Diagnostics Industry Volume Share (%), by Technology 2024 & 2032
- Figure 83: Middle East and Africa Animal Diagnostics Industry Revenue (Million), by Country 2024 & 2032
- Figure 84: Middle East and Africa Animal Diagnostics Industry Volume (K Unit), by Country 2024 & 2032
- Figure 85: Middle East and Africa Animal Diagnostics Industry Revenue Share (%), by Country 2024 & 2032
- Figure 86: Middle East and Africa Animal Diagnostics Industry Volume Share (%), by Country 2024 & 2032
- Figure 87: South America Animal Diagnostics Industry Revenue (Million), by Animals 2024 & 2032
- Figure 88: South America Animal Diagnostics Industry Volume (K Unit), by Animals 2024 & 2032
- Figure 89: South America Animal Diagnostics Industry Revenue Share (%), by Animals 2024 & 2032
- Figure 90: South America Animal Diagnostics Industry Volume Share (%), by Animals 2024 & 2032
- Figure 91: South America Animal Diagnostics Industry Revenue (Million), by Application 2024 & 2032
- Figure 92: South America Animal Diagnostics Industry Volume (K Unit), by Application 2024 & 2032
- Figure 93: South America Animal Diagnostics Industry Revenue Share (%), by Application 2024 & 2032
- Figure 94: South America Animal Diagnostics Industry Volume Share (%), by Application 2024 & 2032
- Figure 95: South America Animal Diagnostics Industry Revenue (Million), by Technology 2024 & 2032
- Figure 96: South America Animal Diagnostics Industry Volume (K Unit), by Technology 2024 & 2032
- Figure 97: South America Animal Diagnostics Industry Revenue Share (%), by Technology 2024 & 2032
- Figure 98: South America Animal Diagnostics Industry Volume Share (%), by Technology 2024 & 2032
- Figure 99: South America Animal Diagnostics Industry Revenue (Million), by Country 2024 & 2032
- Figure 100: South America Animal Diagnostics Industry Volume (K Unit), by Country 2024 & 2032
- Figure 101: South America Animal Diagnostics Industry Revenue Share (%), by Country 2024 & 2032
- Figure 102: South America Animal Diagnostics Industry Volume Share (%), by Country 2024 & 2032
List of Tables
- Table 1: Global Animal Diagnostics Industry Revenue Million Forecast, by Region 2019 & 2032
- Table 2: Global Animal Diagnostics Industry Volume K Unit Forecast, by Region 2019 & 2032
- Table 3: Global Animal Diagnostics Industry Revenue Million Forecast, by Animals 2019 & 2032
- Table 4: Global Animal Diagnostics Industry Volume K Unit Forecast, by Animals 2019 & 2032
- Table 5: Global Animal Diagnostics Industry Revenue Million Forecast, by Application 2019 & 2032
- Table 6: Global Animal Diagnostics Industry Volume K Unit Forecast, by Application 2019 & 2032
- Table 7: Global Animal Diagnostics Industry Revenue Million Forecast, by Technology 2019 & 2032
- Table 8: Global Animal Diagnostics Industry Volume K Unit Forecast, by Technology 2019 & 2032
- Table 9: Global Animal Diagnostics Industry Revenue Million Forecast, by Region 2019 & 2032
- Table 10: Global Animal Diagnostics Industry Volume K Unit Forecast, by Region 2019 & 2032
- Table 11: Global Animal Diagnostics Industry Revenue Million Forecast, by Country 2019 & 2032
- Table 12: Global Animal Diagnostics Industry Volume K Unit Forecast, by Country 2019 & 2032
- Table 13: United States Animal Diagnostics Industry Revenue (Million) Forecast, by Application 2019 & 2032
- Table 14: United States Animal Diagnostics Industry Volume (K Unit) Forecast, by Application 2019 & 2032
- Table 15: Canada Animal Diagnostics Industry Revenue (Million) Forecast, by Application 2019 & 2032
- Table 16: Canada Animal Diagnostics Industry Volume (K Unit) Forecast, by Application 2019 & 2032
- Table 17: Mexico Animal Diagnostics Industry Revenue (Million) Forecast, by Application 2019 & 2032
- Table 18: Mexico Animal Diagnostics Industry Volume (K Unit) Forecast, by Application 2019 & 2032
- Table 19: Global Animal Diagnostics Industry Revenue Million Forecast, by Country 2019 & 2032
- Table 20: Global Animal Diagnostics Industry Volume K Unit Forecast, by Country 2019 & 2032
- Table 21: Germany Animal Diagnostics Industry Revenue (Million) Forecast, by Application 2019 & 2032
- Table 22: Germany Animal Diagnostics Industry Volume (K Unit) Forecast, by Application 2019 & 2032
- Table 23: United Kingdom Animal Diagnostics Industry Revenue (Million) Forecast, by Application 2019 & 2032
- Table 24: United Kingdom Animal Diagnostics Industry Volume (K Unit) Forecast, by Application 2019 & 2032
- Table 25: France Animal Diagnostics Industry Revenue (Million) Forecast, by Application 2019 & 2032
- Table 26: France Animal Diagnostics Industry Volume (K Unit) Forecast, by Application 2019 & 2032
- Table 27: Italy Animal Diagnostics Industry Revenue (Million) Forecast, by Application 2019 & 2032
- Table 28: Italy Animal Diagnostics Industry Volume (K Unit) Forecast, by Application 2019 & 2032
- Table 29: Spain Animal Diagnostics Industry Revenue (Million) Forecast, by Application 2019 & 2032
- Table 30: Spain Animal Diagnostics Industry Volume (K Unit) Forecast, by Application 2019 & 2032
- Table 31: Rest of Europe Animal Diagnostics Industry Revenue (Million) Forecast, by Application 2019 & 2032
- Table 32: Rest of Europe Animal Diagnostics Industry Volume (K Unit) Forecast, by Application 2019 & 2032
- Table 33: Global Animal Diagnostics Industry Revenue Million Forecast, by Country 2019 & 2032
- Table 34: Global Animal Diagnostics Industry Volume K Unit Forecast, by Country 2019 & 2032
- Table 35: China Animal Diagnostics Industry Revenue (Million) Forecast, by Application 2019 & 2032
- Table 36: China Animal Diagnostics Industry Volume (K Unit) Forecast, by Application 2019 & 2032
- Table 37: Japan Animal Diagnostics Industry Revenue (Million) Forecast, by Application 2019 & 2032
- Table 38: Japan Animal Diagnostics Industry Volume (K Unit) Forecast, by Application 2019 & 2032
- Table 39: India Animal Diagnostics Industry Revenue (Million) Forecast, by Application 2019 & 2032
- Table 40: India Animal Diagnostics Industry Volume (K Unit) Forecast, by Application 2019 & 2032
- Table 41: Australia Animal Diagnostics Industry Revenue (Million) Forecast, by Application 2019 & 2032
- Table 42: Australia Animal Diagnostics Industry Volume (K Unit) Forecast, by Application 2019 & 2032
- Table 43: South Korea Animal Diagnostics Industry Revenue (Million) Forecast, by Application 2019 & 2032
- Table 44: South Korea Animal Diagnostics Industry Volume (K Unit) Forecast, by Application 2019 & 2032
- Table 45: Rest of Asia Pacific Animal Diagnostics Industry Revenue (Million) Forecast, by Application 2019 & 2032
- Table 46: Rest of Asia Pacific Animal Diagnostics Industry Volume (K Unit) Forecast, by Application 2019 & 2032
- Table 47: Global Animal Diagnostics Industry Revenue Million Forecast, by Country 2019 & 2032
- Table 48: Global Animal Diagnostics Industry Volume K Unit Forecast, by Country 2019 & 2032
- Table 49: GCC Animal Diagnostics Industry Revenue (Million) Forecast, by Application 2019 & 2032
- Table 50: GCC Animal Diagnostics Industry Volume (K Unit) Forecast, by Application 2019 & 2032
- Table 51: South Africa Animal Diagnostics Industry Revenue (Million) Forecast, by Application 2019 & 2032
- Table 52: South Africa Animal Diagnostics Industry Volume (K Unit) Forecast, by Application 2019 & 2032
- Table 53: Rest of Middle East and Africa Animal Diagnostics Industry Revenue (Million) Forecast, by Application 2019 & 2032
- Table 54: Rest of Middle East and Africa Animal Diagnostics Industry Volume (K Unit) Forecast, by Application 2019 & 2032
- Table 55: Global Animal Diagnostics Industry Revenue Million Forecast, by Country 2019 & 2032
- Table 56: Global Animal Diagnostics Industry Volume K Unit Forecast, by Country 2019 & 2032
- Table 57: Brazil Animal Diagnostics Industry Revenue (Million) Forecast, by Application 2019 & 2032
- Table 58: Brazil Animal Diagnostics Industry Volume (K Unit) Forecast, by Application 2019 & 2032
- Table 59: Argentina Animal Diagnostics Industry Revenue (Million) Forecast, by Application 2019 & 2032
- Table 60: Argentina Animal Diagnostics Industry Volume (K Unit) Forecast, by Application 2019 & 2032
- Table 61: Rest of South America Animal Diagnostics Industry Revenue (Million) Forecast, by Application 2019 & 2032
- Table 62: Rest of South America Animal Diagnostics Industry Volume (K Unit) Forecast, by Application 2019 & 2032
- Table 63: Global Animal Diagnostics Industry Revenue Million Forecast, by Animals 2019 & 2032
- Table 64: Global Animal Diagnostics Industry Volume K Unit Forecast, by Animals 2019 & 2032
- Table 65: Global Animal Diagnostics Industry Revenue Million Forecast, by Application 2019 & 2032
- Table 66: Global Animal Diagnostics Industry Volume K Unit Forecast, by Application 2019 & 2032
- Table 67: Global Animal Diagnostics Industry Revenue Million Forecast, by Technology 2019 & 2032
- Table 68: Global Animal Diagnostics Industry Volume K Unit Forecast, by Technology 2019 & 2032
- Table 69: Global Animal Diagnostics Industry Revenue Million Forecast, by Country 2019 & 2032
- Table 70: Global Animal Diagnostics Industry Volume K Unit Forecast, by Country 2019 & 2032
- Table 71: United States Animal Diagnostics Industry Revenue (Million) Forecast, by Application 2019 & 2032
- Table 72: United States Animal Diagnostics Industry Volume (K Unit) Forecast, by Application 2019 & 2032
- Table 73: Canada Animal Diagnostics Industry Revenue (Million) Forecast, by Application 2019 & 2032
- Table 74: Canada Animal Diagnostics Industry Volume (K Unit) Forecast, by Application 2019 & 2032
- Table 75: Mexico Animal Diagnostics Industry Revenue (Million) Forecast, by Application 2019 & 2032
- Table 76: Mexico Animal Diagnostics Industry Volume (K Unit) Forecast, by Application 2019 & 2032
- Table 77: Global Animal Diagnostics Industry Revenue Million Forecast, by Animals 2019 & 2032
- Table 78: Global Animal Diagnostics Industry Volume K Unit Forecast, by Animals 2019 & 2032
- Table 79: Global Animal Diagnostics Industry Revenue Million Forecast, by Application 2019 & 2032
- Table 80: Global Animal Diagnostics Industry Volume K Unit Forecast, by Application 2019 & 2032
- Table 81: Global Animal Diagnostics Industry Revenue Million Forecast, by Technology 2019 & 2032
- Table 82: Global Animal Diagnostics Industry Volume K Unit Forecast, by Technology 2019 & 2032
- Table 83: Global Animal Diagnostics Industry Revenue Million Forecast, by Country 2019 & 2032
- Table 84: Global Animal Diagnostics Industry Volume K Unit Forecast, by Country 2019 & 2032
- Table 85: Germany Animal Diagnostics Industry Revenue (Million) Forecast, by Application 2019 & 2032
- Table 86: Germany Animal Diagnostics Industry Volume (K Unit) Forecast, by Application 2019 & 2032
- Table 87: United Kingdom Animal Diagnostics Industry Revenue (Million) Forecast, by Application 2019 & 2032
- Table 88: United Kingdom Animal Diagnostics Industry Volume (K Unit) Forecast, by Application 2019 & 2032
- Table 89: France Animal Diagnostics Industry Revenue (Million) Forecast, by Application 2019 & 2032
- Table 90: France Animal Diagnostics Industry Volume (K Unit) Forecast, by Application 2019 & 2032
- Table 91: Italy Animal Diagnostics Industry Revenue (Million) Forecast, by Application 2019 & 2032
- Table 92: Italy Animal Diagnostics Industry Volume (K Unit) Forecast, by Application 2019 & 2032
- Table 93: Spain Animal Diagnostics Industry Revenue (Million) Forecast, by Application 2019 & 2032
- Table 94: Spain Animal Diagnostics Industry Volume (K Unit) Forecast, by Application 2019 & 2032
- Table 95: Rest of Europe Animal Diagnostics Industry Revenue (Million) Forecast, by Application 2019 & 2032
- Table 96: Rest of Europe Animal Diagnostics Industry Volume (K Unit) Forecast, by Application 2019 & 2032
- Table 97: Global Animal Diagnostics Industry Revenue Million Forecast, by Animals 2019 & 2032
- Table 98: Global Animal Diagnostics Industry Volume K Unit Forecast, by Animals 2019 & 2032
- Table 99: Global Animal Diagnostics Industry Revenue Million Forecast, by Application 2019 & 2032
- Table 100: Global Animal Diagnostics Industry Volume K Unit Forecast, by Application 2019 & 2032
- Table 101: Global Animal Diagnostics Industry Revenue Million Forecast, by Technology 2019 & 2032
- Table 102: Global Animal Diagnostics Industry Volume K Unit Forecast, by Technology 2019 & 2032
- Table 103: Global Animal Diagnostics Industry Revenue Million Forecast, by Country 2019 & 2032
- Table 104: Global Animal Diagnostics Industry Volume K Unit Forecast, by Country 2019 & 2032
- Table 105: China Animal Diagnostics Industry Revenue (Million) Forecast, by Application 2019 & 2032
- Table 106: China Animal Diagnostics Industry Volume (K Unit) Forecast, by Application 2019 & 2032
- Table 107: Japan Animal Diagnostics Industry Revenue (Million) Forecast, by Application 2019 & 2032
- Table 108: Japan Animal Diagnostics Industry Volume (K Unit) Forecast, by Application 2019 & 2032
- Table 109: India Animal Diagnostics Industry Revenue (Million) Forecast, by Application 2019 & 2032
- Table 110: India Animal Diagnostics Industry Volume (K Unit) Forecast, by Application 2019 & 2032
- Table 111: Australia Animal Diagnostics Industry Revenue (Million) Forecast, by Application 2019 & 2032
- Table 112: Australia Animal Diagnostics Industry Volume (K Unit) Forecast, by Application 2019 & 2032
- Table 113: South Korea Animal Diagnostics Industry Revenue (Million) Forecast, by Application 2019 & 2032
- Table 114: South Korea Animal Diagnostics Industry Volume (K Unit) Forecast, by Application 2019 & 2032
- Table 115: Rest of Asia Pacific Animal Diagnostics Industry Revenue (Million) Forecast, by Application 2019 & 2032
- Table 116: Rest of Asia Pacific Animal Diagnostics Industry Volume (K Unit) Forecast, by Application 2019 & 2032
- Table 117: Global Animal Diagnostics Industry Revenue Million Forecast, by Animals 2019 & 2032
- Table 118: Global Animal Diagnostics Industry Volume K Unit Forecast, by Animals 2019 & 2032
- Table 119: Global Animal Diagnostics Industry Revenue Million Forecast, by Application 2019 & 2032
- Table 120: Global Animal Diagnostics Industry Volume K Unit Forecast, by Application 2019 & 2032
- Table 121: Global Animal Diagnostics Industry Revenue Million Forecast, by Technology 2019 & 2032
- Table 122: Global Animal Diagnostics Industry Volume K Unit Forecast, by Technology 2019 & 2032
- Table 123: Global Animal Diagnostics Industry Revenue Million Forecast, by Country 2019 & 2032
- Table 124: Global Animal Diagnostics Industry Volume K Unit Forecast, by Country 2019 & 2032
- Table 125: GCC Animal Diagnostics Industry Revenue (Million) Forecast, by Application 2019 & 2032
- Table 126: GCC Animal Diagnostics Industry Volume (K Unit) Forecast, by Application 2019 & 2032
- Table 127: South Africa Animal Diagnostics Industry Revenue (Million) Forecast, by Application 2019 & 2032
- Table 128: South Africa Animal Diagnostics Industry Volume (K Unit) Forecast, by Application 2019 & 2032
- Table 129: Rest of Middle East and Africa Animal Diagnostics Industry Revenue (Million) Forecast, by Application 2019 & 2032
- Table 130: Rest of Middle East and Africa Animal Diagnostics Industry Volume (K Unit) Forecast, by Application 2019 & 2032
- Table 131: Global Animal Diagnostics Industry Revenue Million Forecast, by Animals 2019 & 2032
- Table 132: Global Animal Diagnostics Industry Volume K Unit Forecast, by Animals 2019 & 2032
- Table 133: Global Animal Diagnostics Industry Revenue Million Forecast, by Application 2019 & 2032
- Table 134: Global Animal Diagnostics Industry Volume K Unit Forecast, by Application 2019 & 2032
- Table 135: Global Animal Diagnostics Industry Revenue Million Forecast, by Technology 2019 & 2032
- Table 136: Global Animal Diagnostics Industry Volume K Unit Forecast, by Technology 2019 & 2032
- Table 137: Global Animal Diagnostics Industry Revenue Million Forecast, by Country 2019 & 2032
- Table 138: Global Animal Diagnostics Industry Volume K Unit Forecast, by Country 2019 & 2032
- Table 139: Brazil Animal Diagnostics Industry Revenue (Million) Forecast, by Application 2019 & 2032
- Table 140: Brazil Animal Diagnostics Industry Volume (K Unit) Forecast, by Application 2019 & 2032
- Table 141: Argentina Animal Diagnostics Industry Revenue (Million) Forecast, by Application 2019 & 2032
- Table 142: Argentina Animal Diagnostics Industry Volume (K Unit) Forecast, by Application 2019 & 2032
- Table 143: Rest of South America Animal Diagnostics Industry Revenue (Million) Forecast, by Application 2019 & 2032
- Table 144: Rest of South America Animal Diagnostics Industry Volume (K Unit) Forecast, by Application 2019 & 2032
Frequently Asked Questions
1. What is the projected Compound Annual Growth Rate (CAGR) of the Animal Diagnostics Industry?
The projected CAGR is approximately 10.00%.
2. Which companies are prominent players in the Animal Diagnostics Industry?
Key companies in the market include Heska Corporation, Innovative Diagnostics (IDvet), Zoetis Inc , IDEXX Laboratories Inc, BioMerieux SA, Randox Laboratories Ltd, Chembio Diagnostic Systems Inc, Thermo Fisher Scientific Inc, Indical Bioscience GmbH, Creative Diagnostics, Agrolabo SpA, Virbac, Neogen Corporation.
3. What are the main segments of the Animal Diagnostics Industry?
The market segments include Animals, Application, Technology.
4. Can you provide details about the market size?
The market size is estimated to be USD 3.11 Million as of 2022.
5. What are some drivers contributing to market growth?
Rising Demand for Pet Insurance; Growth in the Companion Animal Population; Increasing Number of Veterinary Practitioners in Developed Economies.
6. What are the notable trends driving market growth?
Molecular Diagnostics is Expected to Witness Growth Over the Forecast Period.
7. Are there any restraints impacting market growth?
Rising Burden of the Pet Care Cost.
8. Can you provide examples of recent developments in the market?
August 2022: PepiPets launched a new mobile diagnostic testing service allowing clients to receive diagnostic testing at home for their pets.
9. What pricing options are available for accessing the report?
Pricing options include single-user, multi-user, and enterprise licenses priced at USD 4750, USD 5250, and USD 8750 respectively.
10. Is the market size provided in terms of value or volume?
The market size is provided in terms of value, measured in Million and volume, measured in K Unit.
11. Are there any specific market keywords associated with the report?
Yes, the market keyword associated with the report is "Animal Diagnostics Industry," which aids in identifying and referencing the specific market segment covered.
12. How do I determine which pricing option suits my needs best?
The pricing options vary based on user requirements and access needs. Individual users may opt for single-user licenses, while businesses requiring broader access may choose multi-user or enterprise licenses for cost-effective access to the report.
13. Are there any additional resources or data provided in the Animal Diagnostics Industry report?
While the report offers comprehensive insights, it's advisable to review the specific contents or supplementary materials provided to ascertain if additional resources or data are available.
14. How can I stay updated on further developments or reports in the Animal Diagnostics Industry?
To stay informed about further developments, trends, and reports in the Animal Diagnostics Industry, consider subscribing to industry newsletters, following relevant companies and organizations, or regularly checking reputable industry news sources and publications.
Methodology
Step 1 - Identification of Relevant Samples Size from Population Database


Step 2 - Approaches for Defining Global Market Size (Value, Volume* & Price*)

Note*: In applicable scenarios
Step 3 - Data Sources
Primary Research
- Web Analytics
- Survey Reports
- Research Institute
- Latest Research Reports
- Opinion Leaders
Secondary Research
- Annual Reports
- White Paper
- Latest Press Release
- Industry Association
- Paid Database
- Investor Presentations

Step 4 - Data Triangulation
Involves using different sources of information in order to increase the validity of a study
These sources are likely to be stakeholders in a program - participants, other researchers, program staff, other community members, and so on.
Then we put all data in single framework & apply various statistical tools to find out the dynamic on the market.
During the analysis stage, feedback from the stakeholder groups would be compared to determine areas of agreement as well as areas of divergence
