

Key Insights
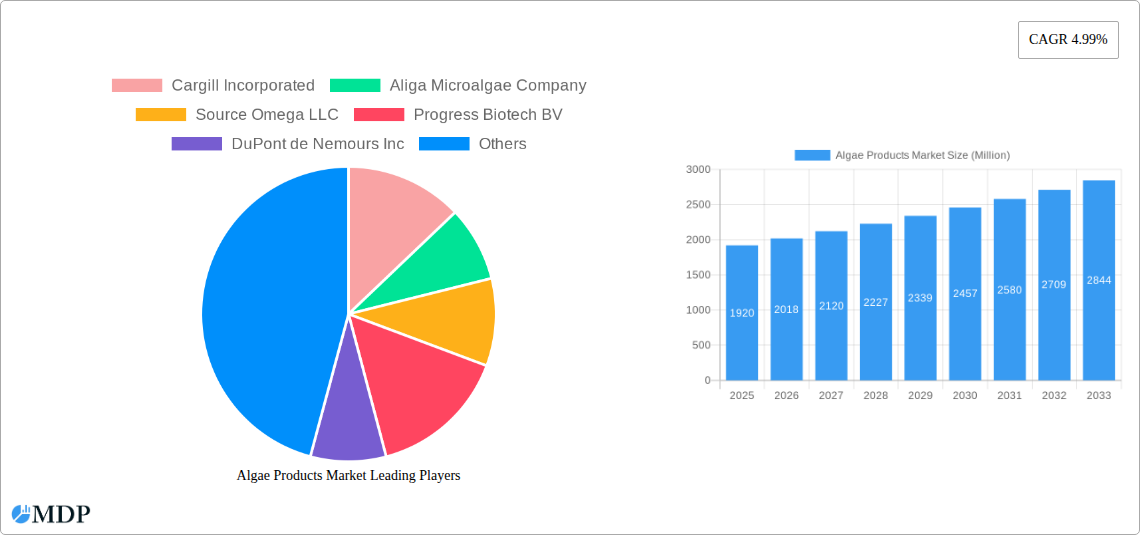
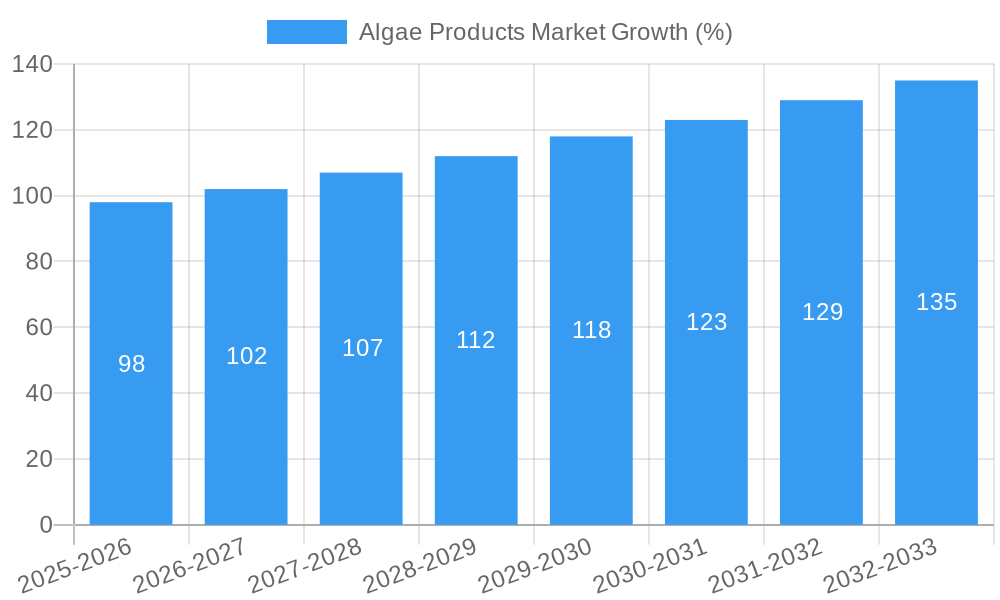
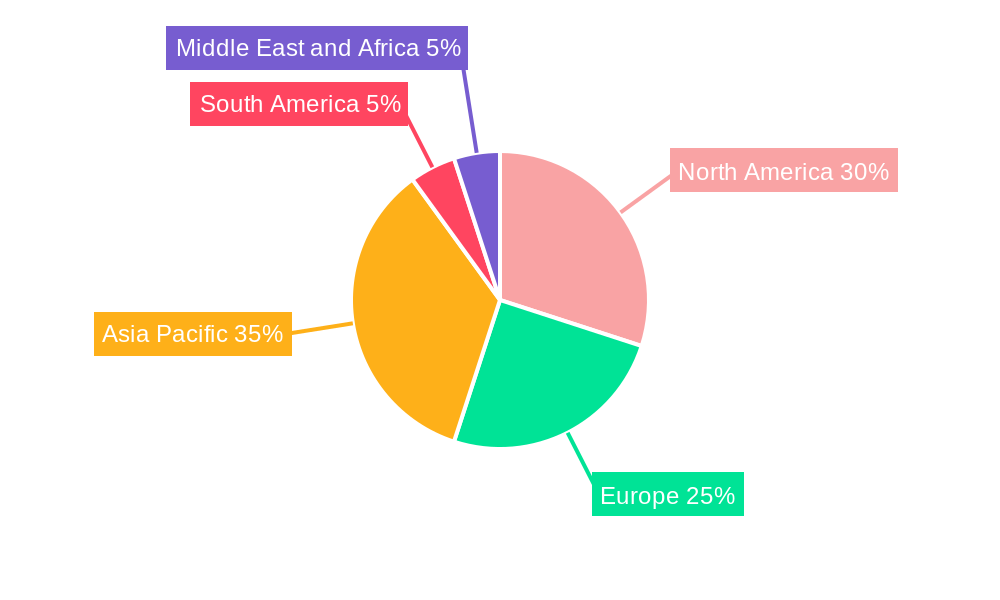
The global algae products market, valued at $1.92 billion in 2025, is projected to experience robust growth, driven by increasing consumer demand for sustainable and healthy food and personal care products. The market's Compound Annual Growth Rate (CAGR) of 4.99% from 2025 to 2033 indicates a significant expansion over the forecast period. This growth is fueled by several key factors. The rising popularity of vegan and vegetarian diets is boosting demand for algal protein as a sustainable alternative protein source. Furthermore, the escalating awareness of the health benefits associated with algal-derived products, such as carotenoids and omega-3 fatty acids, is driving consumption in dietary supplements and functional foods. The burgeoning personal care industry is also contributing significantly, with algae extracts utilized for their moisturizing and anti-aging properties. Specific segments like algal protein, carrageenan (a gelling agent), and alginate (used as a thickener) demonstrate particularly high growth potential. Geographical expansion is also a key driver, with Asia-Pacific expected to lead the market due to increasing production and consumption in countries like China and India. However, challenges remain, such as the high cost of algae cultivation and the need for improved scalability of production methods to meet growing global demand.
Despite these challenges, the algae products market is poised for substantial growth. The increasing investment in research and development of advanced cultivation technologies will likely contribute to cost reduction and efficiency improvements. The ongoing exploration of novel applications of algae in pharmaceuticals and biofuels also presents significant future opportunities. Companies such as Cargill, DuPont, and DSM are strategically investing in this sector, indicating a strong belief in its long-term prospects. The market’s fragmentation, however, presents both opportunities and challenges for smaller players, necessitating a focus on innovation and niche market penetration. The market's future success hinges on the effective balance between meeting the growing demand sustainably and overcoming the existing technological and economic barriers.
Algae Products Market: A Comprehensive Report (2019-2033)
This comprehensive report provides a detailed analysis of the Algae Products Market, offering invaluable insights for stakeholders across the industry value chain. The study period covers 2019-2033, with a base year of 2025 and a forecast period from 2025-2033. Expect in-depth coverage of market dynamics, trends, leading segments, key players, and future opportunities within this rapidly expanding sector. The market is projected to reach xx Million by 2033, showcasing significant growth potential.
Algae Products Market Market Dynamics & Concentration
The Algae Products Market is characterized by a moderately concentrated landscape, with key players such as Cargill Incorporated, Aliga Microalgae Company, and DSM actively shaping market dynamics. Innovation in algae cultivation techniques, extraction methods, and product applications is a major driver. Stringent regulatory frameworks governing food safety and environmental impact influence market growth. Product substitutes, such as traditional sources of omega-3 fatty acids or alternative protein sources, pose a competitive challenge. End-user trends towards sustainable and healthy products, however, favor market expansion. The historical period (2019-2024) witnessed xx M&A deals, indicating a consolidated market. Market share is currently dominated by a few large players, with the top 5 companies holding approximately xx% of the market.
- Market Concentration: Moderately concentrated, with major players holding significant market share.
- Innovation Drivers: Advances in cultivation, extraction, and product development.
- Regulatory Frameworks: Stringent food safety and environmental regulations.
- Product Substitutes: Traditional sources of nutrients and alternative protein sources.
- End-User Trends: Growing demand for sustainable and health-conscious products.
- M&A Activities: xx deals in the historical period (2019-2024), suggesting consolidation.
Algae Products Market Industry Trends & Analysis
The Algae Products Market exhibits robust growth, driven by rising consumer demand for sustainable and health-conscious products. Technological advancements in algae cultivation (e.g., photobioreactors) and downstream processing significantly enhance efficiency and reduce costs. Consumer preference shifts towards plant-based alternatives and functional foods fuel market expansion, particularly within the food and beverage, dietary supplements, and personal care sectors. The market witnesses increasing competition, with both established players and emerging companies vying for market share. The CAGR for the forecast period (2025-2033) is estimated at xx%, while market penetration in key applications like dietary supplements is projected to reach xx% by 2033.
Leading Markets & Segments in Algae Products Market
The Algae Products Market is geographically diverse, with North America and Europe currently leading in terms of market size and adoption. However, the Asia-Pacific region is experiencing rapid growth due to increasing consumer awareness and expanding applications in food and feed. Amongst the algae sources, Brown Algae holds the largest market share due to its versatile applications and established production capacity. In terms of product type, Algal Protein and Alginate are prominent segments, while Carotenoids and Lipids are experiencing significant growth due to their high value in nutraceuticals and personal care. The Food and Beverage segment dominates market applications, followed by Dietary Supplements and Personal Care.
- Key Drivers (North America): Strong regulatory framework, high consumer awareness, advanced infrastructure.
- Key Drivers (Asia-Pacific): Rising disposable incomes, increasing health consciousness, expanding food processing sector.
- Dominant Source: Brown Algae (due to versatility and established production).
- Dominant Product Type: Algal Protein and Alginate (established markets with diverse applications).
- Dominant Application: Food and Beverage (high volume and diverse applications).
Algae Products Market Product Developments
Recent years have witnessed significant innovation in algae product development, focusing on enhanced extraction techniques to improve yields and purity, and on novel product formulations to cater to specific consumer needs. The development of algae-based ingredients for functional foods and cosmetics is a key trend. Companies are focusing on developing sustainable and cost-effective production processes, utilizing advanced technologies such as photobioreactors and closed-loop systems to minimize environmental impact. This trend ensures a strong market fit by addressing consumer concerns regarding sustainability and ethical sourcing.
Key Drivers of Algae Products Market Growth
The Algae Products Market's growth is driven by a confluence of factors. Technological advancements in cultivation and processing have reduced production costs and improved product quality. The rising global demand for sustainable and healthy food and nutrition solutions is a major catalyst. Favorable government policies and initiatives promoting sustainable agriculture and bio-based products also contribute significantly. For example, increasing investment in research & development is expanding the applications for algae-based products.
Challenges in the Algae Products Market Market
Challenges facing the Algae Products Market include the relatively high cost of production compared to conventional alternatives, scalability issues with current production technologies, and the need for further research to fully understand the long-term health benefits of algae-derived products. Variability in algae quality and inconsistent supply chains also pose obstacles to wider adoption. Moreover, regulatory hurdles in certain markets can delay product launches and increase market entry barriers. For example, the time and costs associated with regulatory approvals may hinder the timely commercialization of new products and technologies.
Emerging Opportunities in Algae Products Market
The Algae Products Market holds significant potential for growth. Technological breakthroughs, such as closed system cultivation, will reduce production costs and increase efficiency. Strategic partnerships between algae producers and food/personal care companies can drive market penetration. Expansion into new markets with growing health awareness and environmental consciousness will unlock further opportunities. The development of novel applications in pharmaceuticals and biofuels represents a significant long-term growth potential.
Leading Players in the Algae Products Market Sector
- Cargill Incorporated https://www.cargill.com/
- Aliga Microalgae Company
- Source Omega LLC
- Progress Biotech BV
- DuPont de Nemours Inc https://www.dupont.com/
- Archer Daniels Midland Company https://www.adm.com/
- BASF SE https://www.basf.com/
- Koninklijke DSM N.V. https://www.dsm.com/
- Algenol Biotech LLC
- Yemoja Ltd
- ACCEL Carrageenan Corporation
Key Milestones in Algae Products Market Industry
- September 2022: Aliga Microalgae acquires a large chlorella algae facility in the Netherlands, expanding its production capacity.
- April 2022: Koninklijke DSM N.V. expands its algal-sourced omega-3 product line, offering a sustainable alternative to fish oil.
- September 2021: AAK partners with Progress Biotech to supply algae-based DHA for infant formula, strengthening the supply chain for high-quality ingredients.
Strategic Outlook for Algae Products Market Market
The Algae Products Market is poised for substantial growth, driven by increasing consumer demand for sustainable and healthy products, technological advancements, and favorable government policies. Strategic partnerships, expansion into new markets, and continuous innovation in product development will be crucial for success. Focus on efficient and sustainable production methods will be essential for cost reduction and improved market competitiveness. The market's long-term potential hinges on addressing current challenges, such as high production costs and scalability issues, while continuing to capitalize on emerging applications in various sectors.
Algae Products Market Segmentation
-
1. Source
- 1.1. Brown Algae
- 1.2. Red Algae
- 1.3. Green Algae
- 1.4. Blue-green Algae
-
2. Product Type
- 2.1. Algal Protein
- 2.2. Alginate
- 2.3. Carrageenan
- 2.4. Carotenoids
- 2.5. Lipids
- 2.6. Other Product Types
-
3. Application
- 3.1. Personal Care
- 3.2. Food and Beverage
- 3.3. Dietary Supplements
- 3.4. Pharmaceuticals
- 3.5. Animal Feed
- 3.6. Other Applications
Algae Products Market Segmentation By Geography
-
1. North America
- 1.1. United States
- 1.2. Canada
- 1.3. Mexico
- 1.4. Rest of North America
-
2. Europe
- 2.1. Spain
- 2.2. United Kingdom
- 2.3. Germany
- 2.4. France
- 2.5. Italy
- 2.6. Russia
- 2.7. Rest of Europe
-
3. Asia Pacific
- 3.1. China
- 3.2. Japan
- 3.3. India
- 3.4. Australia
- 3.5. Rest of Asia Pacific
-
4. South America
- 4.1. Brazil
- 4.2. Argentina
- 4.3. Rest of South America
-
5. Middle East and Africa
- 5.1. South Africa
- 5.2. United Arab Emirates
- 5.3. Rest of Middle East and Africa
Algae Products Market REPORT HIGHLIGHTS
| Aspects | Details |
|---|---|
| Study Period | 2019-2033 |
| Base Year | 2024 |
| Estimated Year | 2025 |
| Forecast Period | 2025-2033 |
| Historical Period | 2019-2024 |
| Growth Rate | CAGR of 4.99% from 2019-2033 |
| Segmentation |
|
Table of Contents
- 1. Introduction
- 1.1. Research Scope
- 1.2. Market Segmentation
- 1.3. Research Methodology
- 1.4. Definitions and Assumptions
- 2. Executive Summary
- 2.1. Introduction
- 3. Market Dynamics
- 3.1. Introduction
- 3.2. Market Drivers
- 3.2.1. Increasing Demand for Processed Food Products; Technological Advancements Supporting Market Growth
- 3.3. Market Restrains
- 3.3.1. Increasing Cost of Production Due to Rise in Energy and Labor Cost
- 3.4. Market Trends
- 3.4.1. Health Benefits Associated With Algae Products' Consumption
- 4. Market Factor Analysis
- 4.1. Porters Five Forces
- 4.2. Supply/Value Chain
- 4.3. PESTEL analysis
- 4.4. Market Entropy
- 4.5. Patent/Trademark Analysis
- 5. Global Algae Products Market Analysis, Insights and Forecast, 2019-2031
- 5.1. Market Analysis, Insights and Forecast - by Source
- 5.1.1. Brown Algae
- 5.1.2. Red Algae
- 5.1.3. Green Algae
- 5.1.4. Blue-green Algae
- 5.2. Market Analysis, Insights and Forecast - by Product Type
- 5.2.1. Algal Protein
- 5.2.2. Alginate
- 5.2.3. Carrageenan
- 5.2.4. Carotenoids
- 5.2.5. Lipids
- 5.2.6. Other Product Types
- 5.3. Market Analysis, Insights and Forecast - by Application
- 5.3.1. Personal Care
- 5.3.2. Food and Beverage
- 5.3.3. Dietary Supplements
- 5.3.4. Pharmaceuticals
- 5.3.5. Animal Feed
- 5.3.6. Other Applications
- 5.4. Market Analysis, Insights and Forecast - by Region
- 5.4.1. North America
- 5.4.2. Europe
- 5.4.3. Asia Pacific
- 5.4.4. South America
- 5.4.5. Middle East and Africa
- 5.1. Market Analysis, Insights and Forecast - by Source
- 6. North America Algae Products Market Analysis, Insights and Forecast, 2019-2031
- 6.1. Market Analysis, Insights and Forecast - by Source
- 6.1.1. Brown Algae
- 6.1.2. Red Algae
- 6.1.3. Green Algae
- 6.1.4. Blue-green Algae
- 6.2. Market Analysis, Insights and Forecast - by Product Type
- 6.2.1. Algal Protein
- 6.2.2. Alginate
- 6.2.3. Carrageenan
- 6.2.4. Carotenoids
- 6.2.5. Lipids
- 6.2.6. Other Product Types
- 6.3. Market Analysis, Insights and Forecast - by Application
- 6.3.1. Personal Care
- 6.3.2. Food and Beverage
- 6.3.3. Dietary Supplements
- 6.3.4. Pharmaceuticals
- 6.3.5. Animal Feed
- 6.3.6. Other Applications
- 6.1. Market Analysis, Insights and Forecast - by Source
- 7. Europe Algae Products Market Analysis, Insights and Forecast, 2019-2031
- 7.1. Market Analysis, Insights and Forecast - by Source
- 7.1.1. Brown Algae
- 7.1.2. Red Algae
- 7.1.3. Green Algae
- 7.1.4. Blue-green Algae
- 7.2. Market Analysis, Insights and Forecast - by Product Type
- 7.2.1. Algal Protein
- 7.2.2. Alginate
- 7.2.3. Carrageenan
- 7.2.4. Carotenoids
- 7.2.5. Lipids
- 7.2.6. Other Product Types
- 7.3. Market Analysis, Insights and Forecast - by Application
- 7.3.1. Personal Care
- 7.3.2. Food and Beverage
- 7.3.3. Dietary Supplements
- 7.3.4. Pharmaceuticals
- 7.3.5. Animal Feed
- 7.3.6. Other Applications
- 7.1. Market Analysis, Insights and Forecast - by Source
- 8. Asia Pacific Algae Products Market Analysis, Insights and Forecast, 2019-2031
- 8.1. Market Analysis, Insights and Forecast - by Source
- 8.1.1. Brown Algae
- 8.1.2. Red Algae
- 8.1.3. Green Algae
- 8.1.4. Blue-green Algae
- 8.2. Market Analysis, Insights and Forecast - by Product Type
- 8.2.1. Algal Protein
- 8.2.2. Alginate
- 8.2.3. Carrageenan
- 8.2.4. Carotenoids
- 8.2.5. Lipids
- 8.2.6. Other Product Types
- 8.3. Market Analysis, Insights and Forecast - by Application
- 8.3.1. Personal Care
- 8.3.2. Food and Beverage
- 8.3.3. Dietary Supplements
- 8.3.4. Pharmaceuticals
- 8.3.5. Animal Feed
- 8.3.6. Other Applications
- 8.1. Market Analysis, Insights and Forecast - by Source
- 9. South America Algae Products Market Analysis, Insights and Forecast, 2019-2031
- 9.1. Market Analysis, Insights and Forecast - by Source
- 9.1.1. Brown Algae
- 9.1.2. Red Algae
- 9.1.3. Green Algae
- 9.1.4. Blue-green Algae
- 9.2. Market Analysis, Insights and Forecast - by Product Type
- 9.2.1. Algal Protein
- 9.2.2. Alginate
- 9.2.3. Carrageenan
- 9.2.4. Carotenoids
- 9.2.5. Lipids
- 9.2.6. Other Product Types
- 9.3. Market Analysis, Insights and Forecast - by Application
- 9.3.1. Personal Care
- 9.3.2. Food and Beverage
- 9.3.3. Dietary Supplements
- 9.3.4. Pharmaceuticals
- 9.3.5. Animal Feed
- 9.3.6. Other Applications
- 9.1. Market Analysis, Insights and Forecast - by Source
- 10. Middle East and Africa Algae Products Market Analysis, Insights and Forecast, 2019-2031
- 10.1. Market Analysis, Insights and Forecast - by Source
- 10.1.1. Brown Algae
- 10.1.2. Red Algae
- 10.1.3. Green Algae
- 10.1.4. Blue-green Algae
- 10.2. Market Analysis, Insights and Forecast - by Product Type
- 10.2.1. Algal Protein
- 10.2.2. Alginate
- 10.2.3. Carrageenan
- 10.2.4. Carotenoids
- 10.2.5. Lipids
- 10.2.6. Other Product Types
- 10.3. Market Analysis, Insights and Forecast - by Application
- 10.3.1. Personal Care
- 10.3.2. Food and Beverage
- 10.3.3. Dietary Supplements
- 10.3.4. Pharmaceuticals
- 10.3.5. Animal Feed
- 10.3.6. Other Applications
- 10.1. Market Analysis, Insights and Forecast - by Source
- 11. North America Algae Products Market Analysis, Insights and Forecast, 2019-2031
- 11.1. Market Analysis, Insights and Forecast - By Country/Sub-region
- 11.1.1 United States
- 11.1.2 Canada
- 11.1.3 Mexico
- 11.1.4 Rest of North America
- 12. Europe Algae Products Market Analysis, Insights and Forecast, 2019-2031
- 12.1. Market Analysis, Insights and Forecast - By Country/Sub-region
- 12.1.1 Spain
- 12.1.2 United Kingdom
- 12.1.3 Germany
- 12.1.4 France
- 12.1.5 Italy
- 12.1.6 Russia
- 12.1.7 Rest of Europe
- 13. Asia Pacific Algae Products Market Analysis, Insights and Forecast, 2019-2031
- 13.1. Market Analysis, Insights and Forecast - By Country/Sub-region
- 13.1.1 China
- 13.1.2 Japan
- 13.1.3 India
- 13.1.4 Australia
- 13.1.5 Rest of Asia Pacific
- 14. South America Algae Products Market Analysis, Insights and Forecast, 2019-2031
- 14.1. Market Analysis, Insights and Forecast - By Country/Sub-region
- 14.1.1 Brazil
- 14.1.2 Argentina
- 14.1.3 Rest of South America
- 15. Middle East and Africa Algae Products Market Analysis, Insights and Forecast, 2019-2031
- 15.1. Market Analysis, Insights and Forecast - By Country/Sub-region
- 15.1.1 South Africa
- 15.1.2 United Arab Emirates
- 15.1.3 Rest of Middle East and Africa
- 16. Competitive Analysis
- 16.1. Global Market Share Analysis 2024
- 16.2. Company Profiles
- 16.2.1 Cargill Incorporated
- 16.2.1.1. Overview
- 16.2.1.2. Products
- 16.2.1.3. SWOT Analysis
- 16.2.1.4. Recent Developments
- 16.2.1.5. Financials (Based on Availability)
- 16.2.2 Aliga Microalgae Company
- 16.2.2.1. Overview
- 16.2.2.2. Products
- 16.2.2.3. SWOT Analysis
- 16.2.2.4. Recent Developments
- 16.2.2.5. Financials (Based on Availability)
- 16.2.3 Source Omega LLC
- 16.2.3.1. Overview
- 16.2.3.2. Products
- 16.2.3.3. SWOT Analysis
- 16.2.3.4. Recent Developments
- 16.2.3.5. Financials (Based on Availability)
- 16.2.4 Progress Biotech BV
- 16.2.4.1. Overview
- 16.2.4.2. Products
- 16.2.4.3. SWOT Analysis
- 16.2.4.4. Recent Developments
- 16.2.4.5. Financials (Based on Availability)
- 16.2.5 DuPont de Nemours Inc
- 16.2.5.1. Overview
- 16.2.5.2. Products
- 16.2.5.3. SWOT Analysis
- 16.2.5.4. Recent Developments
- 16.2.5.5. Financials (Based on Availability)
- 16.2.6 Archer Daniels Midland Company
- 16.2.6.1. Overview
- 16.2.6.2. Products
- 16.2.6.3. SWOT Analysis
- 16.2.6.4. Recent Developments
- 16.2.6.5. Financials (Based on Availability)
- 16.2.7 BASF SE
- 16.2.7.1. Overview
- 16.2.7.2. Products
- 16.2.7.3. SWOT Analysis
- 16.2.7.4. Recent Developments
- 16.2.7.5. Financials (Based on Availability)
- 16.2.8 Koninklijke DSM N V
- 16.2.8.1. Overview
- 16.2.8.2. Products
- 16.2.8.3. SWOT Analysis
- 16.2.8.4. Recent Developments
- 16.2.8.5. Financials (Based on Availability)
- 16.2.9 Algenol Biotech LLC*List Not Exhaustive
- 16.2.9.1. Overview
- 16.2.9.2. Products
- 16.2.9.3. SWOT Analysis
- 16.2.9.4. Recent Developments
- 16.2.9.5. Financials (Based on Availability)
- 16.2.10 Yemoja Ltd
- 16.2.10.1. Overview
- 16.2.10.2. Products
- 16.2.10.3. SWOT Analysis
- 16.2.10.4. Recent Developments
- 16.2.10.5. Financials (Based on Availability)
- 16.2.11 ACCEL Carrageenan Corporation
- 16.2.11.1. Overview
- 16.2.11.2. Products
- 16.2.11.3. SWOT Analysis
- 16.2.11.4. Recent Developments
- 16.2.11.5. Financials (Based on Availability)
- 16.2.1 Cargill Incorporated
List of Figures
- Figure 1: Global Algae Products Market Revenue Breakdown (Million, %) by Region 2024 & 2032
- Figure 2: Global Algae Products Market Volume Breakdown (k Tons, %) by Region 2024 & 2032
- Figure 3: North America Algae Products Market Revenue (Million), by Country 2024 & 2032
- Figure 4: North America Algae Products Market Volume (k Tons), by Country 2024 & 2032
- Figure 5: North America Algae Products Market Revenue Share (%), by Country 2024 & 2032
- Figure 6: North America Algae Products Market Volume Share (%), by Country 2024 & 2032
- Figure 7: Europe Algae Products Market Revenue (Million), by Country 2024 & 2032
- Figure 8: Europe Algae Products Market Volume (k Tons), by Country 2024 & 2032
- Figure 9: Europe Algae Products Market Revenue Share (%), by Country 2024 & 2032
- Figure 10: Europe Algae Products Market Volume Share (%), by Country 2024 & 2032
- Figure 11: Asia Pacific Algae Products Market Revenue (Million), by Country 2024 & 2032
- Figure 12: Asia Pacific Algae Products Market Volume (k Tons), by Country 2024 & 2032
- Figure 13: Asia Pacific Algae Products Market Revenue Share (%), by Country 2024 & 2032
- Figure 14: Asia Pacific Algae Products Market Volume Share (%), by Country 2024 & 2032
- Figure 15: South America Algae Products Market Revenue (Million), by Country 2024 & 2032
- Figure 16: South America Algae Products Market Volume (k Tons), by Country 2024 & 2032
- Figure 17: South America Algae Products Market Revenue Share (%), by Country 2024 & 2032
- Figure 18: South America Algae Products Market Volume Share (%), by Country 2024 & 2032
- Figure 19: Middle East and Africa Algae Products Market Revenue (Million), by Country 2024 & 2032
- Figure 20: Middle East and Africa Algae Products Market Volume (k Tons), by Country 2024 & 2032
- Figure 21: Middle East and Africa Algae Products Market Revenue Share (%), by Country 2024 & 2032
- Figure 22: Middle East and Africa Algae Products Market Volume Share (%), by Country 2024 & 2032
- Figure 23: North America Algae Products Market Revenue (Million), by Source 2024 & 2032
- Figure 24: North America Algae Products Market Volume (k Tons), by Source 2024 & 2032
- Figure 25: North America Algae Products Market Revenue Share (%), by Source 2024 & 2032
- Figure 26: North America Algae Products Market Volume Share (%), by Source 2024 & 2032
- Figure 27: North America Algae Products Market Revenue (Million), by Product Type 2024 & 2032
- Figure 28: North America Algae Products Market Volume (k Tons), by Product Type 2024 & 2032
- Figure 29: North America Algae Products Market Revenue Share (%), by Product Type 2024 & 2032
- Figure 30: North America Algae Products Market Volume Share (%), by Product Type 2024 & 2032
- Figure 31: North America Algae Products Market Revenue (Million), by Application 2024 & 2032
- Figure 32: North America Algae Products Market Volume (k Tons), by Application 2024 & 2032
- Figure 33: North America Algae Products Market Revenue Share (%), by Application 2024 & 2032
- Figure 34: North America Algae Products Market Volume Share (%), by Application 2024 & 2032
- Figure 35: North America Algae Products Market Revenue (Million), by Country 2024 & 2032
- Figure 36: North America Algae Products Market Volume (k Tons), by Country 2024 & 2032
- Figure 37: North America Algae Products Market Revenue Share (%), by Country 2024 & 2032
- Figure 38: North America Algae Products Market Volume Share (%), by Country 2024 & 2032
- Figure 39: Europe Algae Products Market Revenue (Million), by Source 2024 & 2032
- Figure 40: Europe Algae Products Market Volume (k Tons), by Source 2024 & 2032
- Figure 41: Europe Algae Products Market Revenue Share (%), by Source 2024 & 2032
- Figure 42: Europe Algae Products Market Volume Share (%), by Source 2024 & 2032
- Figure 43: Europe Algae Products Market Revenue (Million), by Product Type 2024 & 2032
- Figure 44: Europe Algae Products Market Volume (k Tons), by Product Type 2024 & 2032
- Figure 45: Europe Algae Products Market Revenue Share (%), by Product Type 2024 & 2032
- Figure 46: Europe Algae Products Market Volume Share (%), by Product Type 2024 & 2032
- Figure 47: Europe Algae Products Market Revenue (Million), by Application 2024 & 2032
- Figure 48: Europe Algae Products Market Volume (k Tons), by Application 2024 & 2032
- Figure 49: Europe Algae Products Market Revenue Share (%), by Application 2024 & 2032
- Figure 50: Europe Algae Products Market Volume Share (%), by Application 2024 & 2032
- Figure 51: Europe Algae Products Market Revenue (Million), by Country 2024 & 2032
- Figure 52: Europe Algae Products Market Volume (k Tons), by Country 2024 & 2032
- Figure 53: Europe Algae Products Market Revenue Share (%), by Country 2024 & 2032
- Figure 54: Europe Algae Products Market Volume Share (%), by Country 2024 & 2032
- Figure 55: Asia Pacific Algae Products Market Revenue (Million), by Source 2024 & 2032
- Figure 56: Asia Pacific Algae Products Market Volume (k Tons), by Source 2024 & 2032
- Figure 57: Asia Pacific Algae Products Market Revenue Share (%), by Source 2024 & 2032
- Figure 58: Asia Pacific Algae Products Market Volume Share (%), by Source 2024 & 2032
- Figure 59: Asia Pacific Algae Products Market Revenue (Million), by Product Type 2024 & 2032
- Figure 60: Asia Pacific Algae Products Market Volume (k Tons), by Product Type 2024 & 2032
- Figure 61: Asia Pacific Algae Products Market Revenue Share (%), by Product Type 2024 & 2032
- Figure 62: Asia Pacific Algae Products Market Volume Share (%), by Product Type 2024 & 2032
- Figure 63: Asia Pacific Algae Products Market Revenue (Million), by Application 2024 & 2032
- Figure 64: Asia Pacific Algae Products Market Volume (k Tons), by Application 2024 & 2032
- Figure 65: Asia Pacific Algae Products Market Revenue Share (%), by Application 2024 & 2032
- Figure 66: Asia Pacific Algae Products Market Volume Share (%), by Application 2024 & 2032
- Figure 67: Asia Pacific Algae Products Market Revenue (Million), by Country 2024 & 2032
- Figure 68: Asia Pacific Algae Products Market Volume (k Tons), by Country 2024 & 2032
- Figure 69: Asia Pacific Algae Products Market Revenue Share (%), by Country 2024 & 2032
- Figure 70: Asia Pacific Algae Products Market Volume Share (%), by Country 2024 & 2032
- Figure 71: South America Algae Products Market Revenue (Million), by Source 2024 & 2032
- Figure 72: South America Algae Products Market Volume (k Tons), by Source 2024 & 2032
- Figure 73: South America Algae Products Market Revenue Share (%), by Source 2024 & 2032
- Figure 74: South America Algae Products Market Volume Share (%), by Source 2024 & 2032
- Figure 75: South America Algae Products Market Revenue (Million), by Product Type 2024 & 2032
- Figure 76: South America Algae Products Market Volume (k Tons), by Product Type 2024 & 2032
- Figure 77: South America Algae Products Market Revenue Share (%), by Product Type 2024 & 2032
- Figure 78: South America Algae Products Market Volume Share (%), by Product Type 2024 & 2032
- Figure 79: South America Algae Products Market Revenue (Million), by Application 2024 & 2032
- Figure 80: South America Algae Products Market Volume (k Tons), by Application 2024 & 2032
- Figure 81: South America Algae Products Market Revenue Share (%), by Application 2024 & 2032
- Figure 82: South America Algae Products Market Volume Share (%), by Application 2024 & 2032
- Figure 83: South America Algae Products Market Revenue (Million), by Country 2024 & 2032
- Figure 84: South America Algae Products Market Volume (k Tons), by Country 2024 & 2032
- Figure 85: South America Algae Products Market Revenue Share (%), by Country 2024 & 2032
- Figure 86: South America Algae Products Market Volume Share (%), by Country 2024 & 2032
- Figure 87: Middle East and Africa Algae Products Market Revenue (Million), by Source 2024 & 2032
- Figure 88: Middle East and Africa Algae Products Market Volume (k Tons), by Source 2024 & 2032
- Figure 89: Middle East and Africa Algae Products Market Revenue Share (%), by Source 2024 & 2032
- Figure 90: Middle East and Africa Algae Products Market Volume Share (%), by Source 2024 & 2032
- Figure 91: Middle East and Africa Algae Products Market Revenue (Million), by Product Type 2024 & 2032
- Figure 92: Middle East and Africa Algae Products Market Volume (k Tons), by Product Type 2024 & 2032
- Figure 93: Middle East and Africa Algae Products Market Revenue Share (%), by Product Type 2024 & 2032
- Figure 94: Middle East and Africa Algae Products Market Volume Share (%), by Product Type 2024 & 2032
- Figure 95: Middle East and Africa Algae Products Market Revenue (Million), by Application 2024 & 2032
- Figure 96: Middle East and Africa Algae Products Market Volume (k Tons), by Application 2024 & 2032
- Figure 97: Middle East and Africa Algae Products Market Revenue Share (%), by Application 2024 & 2032
- Figure 98: Middle East and Africa Algae Products Market Volume Share (%), by Application 2024 & 2032
- Figure 99: Middle East and Africa Algae Products Market Revenue (Million), by Country 2024 & 2032
- Figure 100: Middle East and Africa Algae Products Market Volume (k Tons), by Country 2024 & 2032
- Figure 101: Middle East and Africa Algae Products Market Revenue Share (%), by Country 2024 & 2032
- Figure 102: Middle East and Africa Algae Products Market Volume Share (%), by Country 2024 & 2032
List of Tables
- Table 1: Global Algae Products Market Revenue Million Forecast, by Region 2019 & 2032
- Table 2: Global Algae Products Market Volume k Tons Forecast, by Region 2019 & 2032
- Table 3: Global Algae Products Market Revenue Million Forecast, by Source 2019 & 2032
- Table 4: Global Algae Products Market Volume k Tons Forecast, by Source 2019 & 2032
- Table 5: Global Algae Products Market Revenue Million Forecast, by Product Type 2019 & 2032
- Table 6: Global Algae Products Market Volume k Tons Forecast, by Product Type 2019 & 2032
- Table 7: Global Algae Products Market Revenue Million Forecast, by Application 2019 & 2032
- Table 8: Global Algae Products Market Volume k Tons Forecast, by Application 2019 & 2032
- Table 9: Global Algae Products Market Revenue Million Forecast, by Region 2019 & 2032
- Table 10: Global Algae Products Market Volume k Tons Forecast, by Region 2019 & 2032
- Table 11: Global Algae Products Market Revenue Million Forecast, by Country 2019 & 2032
- Table 12: Global Algae Products Market Volume k Tons Forecast, by Country 2019 & 2032
- Table 13: United States Algae Products Market Revenue (Million) Forecast, by Application 2019 & 2032
- Table 14: United States Algae Products Market Volume (k Tons) Forecast, by Application 2019 & 2032
- Table 15: Canada Algae Products Market Revenue (Million) Forecast, by Application 2019 & 2032
- Table 16: Canada Algae Products Market Volume (k Tons) Forecast, by Application 2019 & 2032
- Table 17: Mexico Algae Products Market Revenue (Million) Forecast, by Application 2019 & 2032
- Table 18: Mexico Algae Products Market Volume (k Tons) Forecast, by Application 2019 & 2032
- Table 19: Rest of North America Algae Products Market Revenue (Million) Forecast, by Application 2019 & 2032
- Table 20: Rest of North America Algae Products Market Volume (k Tons) Forecast, by Application 2019 & 2032
- Table 21: Global Algae Products Market Revenue Million Forecast, by Country 2019 & 2032
- Table 22: Global Algae Products Market Volume k Tons Forecast, by Country 2019 & 2032
- Table 23: Spain Algae Products Market Revenue (Million) Forecast, by Application 2019 & 2032
- Table 24: Spain Algae Products Market Volume (k Tons) Forecast, by Application 2019 & 2032
- Table 25: United Kingdom Algae Products Market Revenue (Million) Forecast, by Application 2019 & 2032
- Table 26: United Kingdom Algae Products Market Volume (k Tons) Forecast, by Application 2019 & 2032
- Table 27: Germany Algae Products Market Revenue (Million) Forecast, by Application 2019 & 2032
- Table 28: Germany Algae Products Market Volume (k Tons) Forecast, by Application 2019 & 2032
- Table 29: France Algae Products Market Revenue (Million) Forecast, by Application 2019 & 2032
- Table 30: France Algae Products Market Volume (k Tons) Forecast, by Application 2019 & 2032
- Table 31: Italy Algae Products Market Revenue (Million) Forecast, by Application 2019 & 2032
- Table 32: Italy Algae Products Market Volume (k Tons) Forecast, by Application 2019 & 2032
- Table 33: Russia Algae Products Market Revenue (Million) Forecast, by Application 2019 & 2032
- Table 34: Russia Algae Products Market Volume (k Tons) Forecast, by Application 2019 & 2032
- Table 35: Rest of Europe Algae Products Market Revenue (Million) Forecast, by Application 2019 & 2032
- Table 36: Rest of Europe Algae Products Market Volume (k Tons) Forecast, by Application 2019 & 2032
- Table 37: Global Algae Products Market Revenue Million Forecast, by Country 2019 & 2032
- Table 38: Global Algae Products Market Volume k Tons Forecast, by Country 2019 & 2032
- Table 39: China Algae Products Market Revenue (Million) Forecast, by Application 2019 & 2032
- Table 40: China Algae Products Market Volume (k Tons) Forecast, by Application 2019 & 2032
- Table 41: Japan Algae Products Market Revenue (Million) Forecast, by Application 2019 & 2032
- Table 42: Japan Algae Products Market Volume (k Tons) Forecast, by Application 2019 & 2032
- Table 43: India Algae Products Market Revenue (Million) Forecast, by Application 2019 & 2032
- Table 44: India Algae Products Market Volume (k Tons) Forecast, by Application 2019 & 2032
- Table 45: Australia Algae Products Market Revenue (Million) Forecast, by Application 2019 & 2032
- Table 46: Australia Algae Products Market Volume (k Tons) Forecast, by Application 2019 & 2032
- Table 47: Rest of Asia Pacific Algae Products Market Revenue (Million) Forecast, by Application 2019 & 2032
- Table 48: Rest of Asia Pacific Algae Products Market Volume (k Tons) Forecast, by Application 2019 & 2032
- Table 49: Global Algae Products Market Revenue Million Forecast, by Country 2019 & 2032
- Table 50: Global Algae Products Market Volume k Tons Forecast, by Country 2019 & 2032
- Table 51: Brazil Algae Products Market Revenue (Million) Forecast, by Application 2019 & 2032
- Table 52: Brazil Algae Products Market Volume (k Tons) Forecast, by Application 2019 & 2032
- Table 53: Argentina Algae Products Market Revenue (Million) Forecast, by Application 2019 & 2032
- Table 54: Argentina Algae Products Market Volume (k Tons) Forecast, by Application 2019 & 2032
- Table 55: Rest of South America Algae Products Market Revenue (Million) Forecast, by Application 2019 & 2032
- Table 56: Rest of South America Algae Products Market Volume (k Tons) Forecast, by Application 2019 & 2032
- Table 57: Global Algae Products Market Revenue Million Forecast, by Country 2019 & 2032
- Table 58: Global Algae Products Market Volume k Tons Forecast, by Country 2019 & 2032
- Table 59: South Africa Algae Products Market Revenue (Million) Forecast, by Application 2019 & 2032
- Table 60: South Africa Algae Products Market Volume (k Tons) Forecast, by Application 2019 & 2032
- Table 61: United Arab Emirates Algae Products Market Revenue (Million) Forecast, by Application 2019 & 2032
- Table 62: United Arab Emirates Algae Products Market Volume (k Tons) Forecast, by Application 2019 & 2032
- Table 63: Rest of Middle East and Africa Algae Products Market Revenue (Million) Forecast, by Application 2019 & 2032
- Table 64: Rest of Middle East and Africa Algae Products Market Volume (k Tons) Forecast, by Application 2019 & 2032
- Table 65: Global Algae Products Market Revenue Million Forecast, by Source 2019 & 2032
- Table 66: Global Algae Products Market Volume k Tons Forecast, by Source 2019 & 2032
- Table 67: Global Algae Products Market Revenue Million Forecast, by Product Type 2019 & 2032
- Table 68: Global Algae Products Market Volume k Tons Forecast, by Product Type 2019 & 2032
- Table 69: Global Algae Products Market Revenue Million Forecast, by Application 2019 & 2032
- Table 70: Global Algae Products Market Volume k Tons Forecast, by Application 2019 & 2032
- Table 71: Global Algae Products Market Revenue Million Forecast, by Country 2019 & 2032
- Table 72: Global Algae Products Market Volume k Tons Forecast, by Country 2019 & 2032
- Table 73: United States Algae Products Market Revenue (Million) Forecast, by Application 2019 & 2032
- Table 74: United States Algae Products Market Volume (k Tons) Forecast, by Application 2019 & 2032
- Table 75: Canada Algae Products Market Revenue (Million) Forecast, by Application 2019 & 2032
- Table 76: Canada Algae Products Market Volume (k Tons) Forecast, by Application 2019 & 2032
- Table 77: Mexico Algae Products Market Revenue (Million) Forecast, by Application 2019 & 2032
- Table 78: Mexico Algae Products Market Volume (k Tons) Forecast, by Application 2019 & 2032
- Table 79: Rest of North America Algae Products Market Revenue (Million) Forecast, by Application 2019 & 2032
- Table 80: Rest of North America Algae Products Market Volume (k Tons) Forecast, by Application 2019 & 2032
- Table 81: Global Algae Products Market Revenue Million Forecast, by Source 2019 & 2032
- Table 82: Global Algae Products Market Volume k Tons Forecast, by Source 2019 & 2032
- Table 83: Global Algae Products Market Revenue Million Forecast, by Product Type 2019 & 2032
- Table 84: Global Algae Products Market Volume k Tons Forecast, by Product Type 2019 & 2032
- Table 85: Global Algae Products Market Revenue Million Forecast, by Application 2019 & 2032
- Table 86: Global Algae Products Market Volume k Tons Forecast, by Application 2019 & 2032
- Table 87: Global Algae Products Market Revenue Million Forecast, by Country 2019 & 2032
- Table 88: Global Algae Products Market Volume k Tons Forecast, by Country 2019 & 2032
- Table 89: Spain Algae Products Market Revenue (Million) Forecast, by Application 2019 & 2032
- Table 90: Spain Algae Products Market Volume (k Tons) Forecast, by Application 2019 & 2032
- Table 91: United Kingdom Algae Products Market Revenue (Million) Forecast, by Application 2019 & 2032
- Table 92: United Kingdom Algae Products Market Volume (k Tons) Forecast, by Application 2019 & 2032
- Table 93: Germany Algae Products Market Revenue (Million) Forecast, by Application 2019 & 2032
- Table 94: Germany Algae Products Market Volume (k Tons) Forecast, by Application 2019 & 2032
- Table 95: France Algae Products Market Revenue (Million) Forecast, by Application 2019 & 2032
- Table 96: France Algae Products Market Volume (k Tons) Forecast, by Application 2019 & 2032
- Table 97: Italy Algae Products Market Revenue (Million) Forecast, by Application 2019 & 2032
- Table 98: Italy Algae Products Market Volume (k Tons) Forecast, by Application 2019 & 2032
- Table 99: Russia Algae Products Market Revenue (Million) Forecast, by Application 2019 & 2032
- Table 100: Russia Algae Products Market Volume (k Tons) Forecast, by Application 2019 & 2032
- Table 101: Rest of Europe Algae Products Market Revenue (Million) Forecast, by Application 2019 & 2032
- Table 102: Rest of Europe Algae Products Market Volume (k Tons) Forecast, by Application 2019 & 2032
- Table 103: Global Algae Products Market Revenue Million Forecast, by Source 2019 & 2032
- Table 104: Global Algae Products Market Volume k Tons Forecast, by Source 2019 & 2032
- Table 105: Global Algae Products Market Revenue Million Forecast, by Product Type 2019 & 2032
- Table 106: Global Algae Products Market Volume k Tons Forecast, by Product Type 2019 & 2032
- Table 107: Global Algae Products Market Revenue Million Forecast, by Application 2019 & 2032
- Table 108: Global Algae Products Market Volume k Tons Forecast, by Application 2019 & 2032
- Table 109: Global Algae Products Market Revenue Million Forecast, by Country 2019 & 2032
- Table 110: Global Algae Products Market Volume k Tons Forecast, by Country 2019 & 2032
- Table 111: China Algae Products Market Revenue (Million) Forecast, by Application 2019 & 2032
- Table 112: China Algae Products Market Volume (k Tons) Forecast, by Application 2019 & 2032
- Table 113: Japan Algae Products Market Revenue (Million) Forecast, by Application 2019 & 2032
- Table 114: Japan Algae Products Market Volume (k Tons) Forecast, by Application 2019 & 2032
- Table 115: India Algae Products Market Revenue (Million) Forecast, by Application 2019 & 2032
- Table 116: India Algae Products Market Volume (k Tons) Forecast, by Application 2019 & 2032
- Table 117: Australia Algae Products Market Revenue (Million) Forecast, by Application 2019 & 2032
- Table 118: Australia Algae Products Market Volume (k Tons) Forecast, by Application 2019 & 2032
- Table 119: Rest of Asia Pacific Algae Products Market Revenue (Million) Forecast, by Application 2019 & 2032
- Table 120: Rest of Asia Pacific Algae Products Market Volume (k Tons) Forecast, by Application 2019 & 2032
- Table 121: Global Algae Products Market Revenue Million Forecast, by Source 2019 & 2032
- Table 122: Global Algae Products Market Volume k Tons Forecast, by Source 2019 & 2032
- Table 123: Global Algae Products Market Revenue Million Forecast, by Product Type 2019 & 2032
- Table 124: Global Algae Products Market Volume k Tons Forecast, by Product Type 2019 & 2032
- Table 125: Global Algae Products Market Revenue Million Forecast, by Application 2019 & 2032
- Table 126: Global Algae Products Market Volume k Tons Forecast, by Application 2019 & 2032
- Table 127: Global Algae Products Market Revenue Million Forecast, by Country 2019 & 2032
- Table 128: Global Algae Products Market Volume k Tons Forecast, by Country 2019 & 2032
- Table 129: Brazil Algae Products Market Revenue (Million) Forecast, by Application 2019 & 2032
- Table 130: Brazil Algae Products Market Volume (k Tons) Forecast, by Application 2019 & 2032
- Table 131: Argentina Algae Products Market Revenue (Million) Forecast, by Application 2019 & 2032
- Table 132: Argentina Algae Products Market Volume (k Tons) Forecast, by Application 2019 & 2032
- Table 133: Rest of South America Algae Products Market Revenue (Million) Forecast, by Application 2019 & 2032
- Table 134: Rest of South America Algae Products Market Volume (k Tons) Forecast, by Application 2019 & 2032
- Table 135: Global Algae Products Market Revenue Million Forecast, by Source 2019 & 2032
- Table 136: Global Algae Products Market Volume k Tons Forecast, by Source 2019 & 2032
- Table 137: Global Algae Products Market Revenue Million Forecast, by Product Type 2019 & 2032
- Table 138: Global Algae Products Market Volume k Tons Forecast, by Product Type 2019 & 2032
- Table 139: Global Algae Products Market Revenue Million Forecast, by Application 2019 & 2032
- Table 140: Global Algae Products Market Volume k Tons Forecast, by Application 2019 & 2032
- Table 141: Global Algae Products Market Revenue Million Forecast, by Country 2019 & 2032
- Table 142: Global Algae Products Market Volume k Tons Forecast, by Country 2019 & 2032
- Table 143: South Africa Algae Products Market Revenue (Million) Forecast, by Application 2019 & 2032
- Table 144: South Africa Algae Products Market Volume (k Tons) Forecast, by Application 2019 & 2032
- Table 145: United Arab Emirates Algae Products Market Revenue (Million) Forecast, by Application 2019 & 2032
- Table 146: United Arab Emirates Algae Products Market Volume (k Tons) Forecast, by Application 2019 & 2032
- Table 147: Rest of Middle East and Africa Algae Products Market Revenue (Million) Forecast, by Application 2019 & 2032
- Table 148: Rest of Middle East and Africa Algae Products Market Volume (k Tons) Forecast, by Application 2019 & 2032
Frequently Asked Questions
1. What is the projected Compound Annual Growth Rate (CAGR) of the Algae Products Market?
The projected CAGR is approximately 4.99%.
2. Which companies are prominent players in the Algae Products Market?
Key companies in the market include Cargill Incorporated, Aliga Microalgae Company, Source Omega LLC, Progress Biotech BV, DuPont de Nemours Inc, Archer Daniels Midland Company, BASF SE, Koninklijke DSM N V, Algenol Biotech LLC*List Not Exhaustive, Yemoja Ltd, ACCEL Carrageenan Corporation.
3. What are the main segments of the Algae Products Market?
The market segments include Source, Product Type, Application.
4. Can you provide details about the market size?
The market size is estimated to be USD 1.92 Million as of 2022.
5. What are some drivers contributing to market growth?
Increasing Demand for Processed Food Products; Technological Advancements Supporting Market Growth.
6. What are the notable trends driving market growth?
Health Benefits Associated With Algae Products' Consumption.
7. Are there any restraints impacting market growth?
Increasing Cost of Production Due to Rise in Energy and Labor Cost.
8. Can you provide examples of recent developments in the market?
In September 2022, in the Netherlands, the Danish company Aliga Microalgae (Aliga) acquired a large chlorella algae facility. The company plans to use a modern production facility to commercialize its chlorella algae products.
9. What pricing options are available for accessing the report?
Pricing options include single-user, multi-user, and enterprise licenses priced at USD 4750, USD 5250, and USD 8750 respectively.
10. Is the market size provided in terms of value or volume?
The market size is provided in terms of value, measured in Million and volume, measured in k Tons.
11. Are there any specific market keywords associated with the report?
Yes, the market keyword associated with the report is "Algae Products Market," which aids in identifying and referencing the specific market segment covered.
12. How do I determine which pricing option suits my needs best?
The pricing options vary based on user requirements and access needs. Individual users may opt for single-user licenses, while businesses requiring broader access may choose multi-user or enterprise licenses for cost-effective access to the report.
13. Are there any additional resources or data provided in the Algae Products Market report?
While the report offers comprehensive insights, it's advisable to review the specific contents or supplementary materials provided to ascertain if additional resources or data are available.
14. How can I stay updated on further developments or reports in the Algae Products Market?
To stay informed about further developments, trends, and reports in the Algae Products Market, consider subscribing to industry newsletters, following relevant companies and organizations, or regularly checking reputable industry news sources and publications.
Methodology
Step 1 - Identification of Relevant Samples Size from Population Database


Step 2 - Approaches for Defining Global Market Size (Value, Volume* & Price*)

Note*: In applicable scenarios
Step 3 - Data Sources
Primary Research
- Web Analytics
- Survey Reports
- Research Institute
- Latest Research Reports
- Opinion Leaders
Secondary Research
- Annual Reports
- White Paper
- Latest Press Release
- Industry Association
- Paid Database
- Investor Presentations

Step 4 - Data Triangulation
Involves using different sources of information in order to increase the validity of a study
These sources are likely to be stakeholders in a program - participants, other researchers, program staff, other community members, and so on.
Then we put all data in single framework & apply various statistical tools to find out the dynamic on the market.
During the analysis stage, feedback from the stakeholder groups would be compared to determine areas of agreement as well as areas of divergence
