

Key Insights
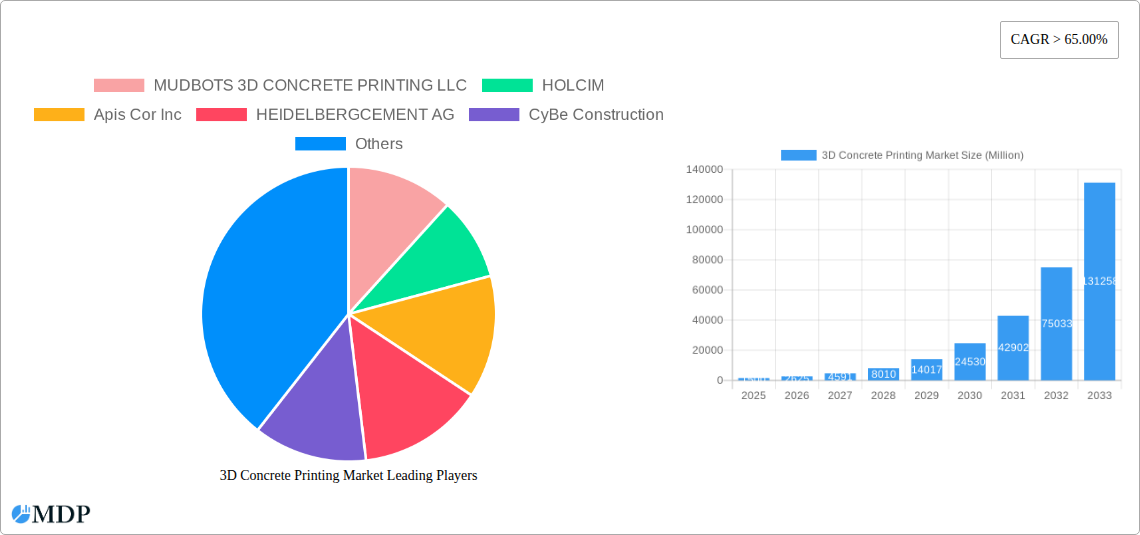
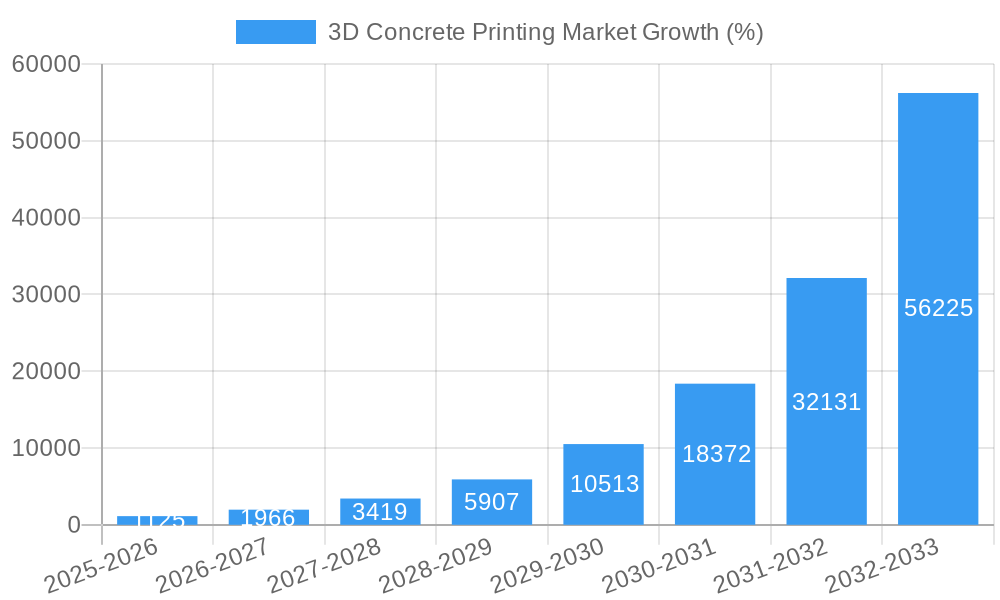
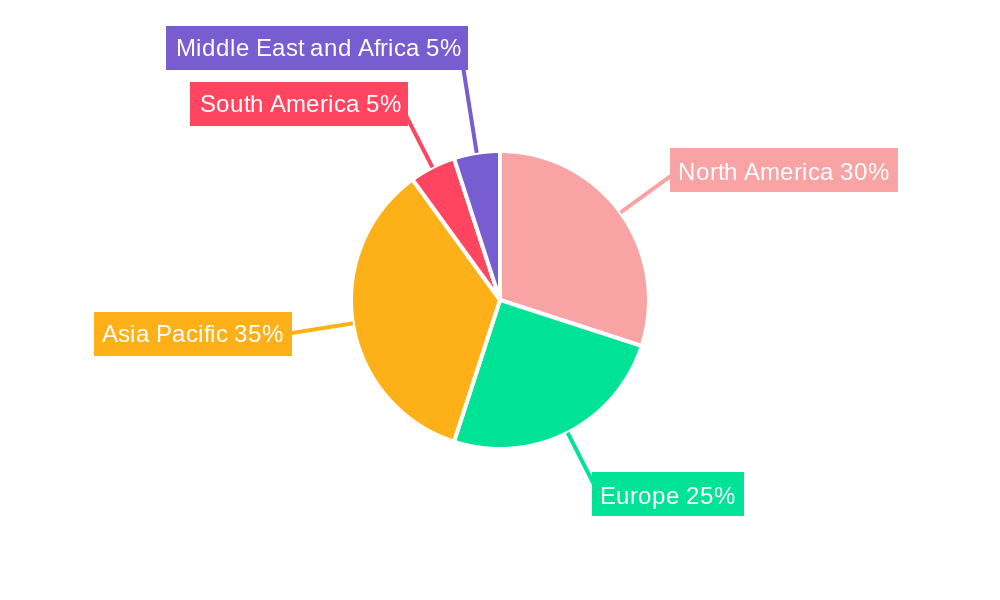
The 3D concrete printing market is experiencing explosive growth, projected to maintain a Compound Annual Growth Rate (CAGR) exceeding 65% from 2025 to 2033. This rapid expansion is driven by several key factors. Firstly, the construction industry's increasing demand for efficient, sustainable, and cost-effective building solutions fuels the adoption of this innovative technology. 3D concrete printing offers significant advantages in terms of reduced labor costs, material waste minimization, and faster construction timelines, making it particularly attractive for large-scale infrastructure projects and complex architectural designs. Furthermore, advancements in printing technologies, including increased precision and material versatility, are continuously expanding the applications of 3D concrete printing, encompassing residential, commercial, and infrastructural projects. The growing availability of high-performance concrete mixes further enhances the structural integrity and durability of 3D-printed structures, fostering wider acceptance across diverse construction sectors. Major players like Holcim, HeidelbergCement, and ICON Technology are actively driving market growth through strategic investments in R&D, expanding partnerships, and the introduction of innovative printing solutions. The geographical distribution of market share is expected to reflect significant growth in Asia-Pacific, driven by substantial infrastructure development in countries like China and India.
However, despite the promising outlook, market penetration faces some challenges. High initial investment costs associated with acquiring 3D printing equipment and specialized software can deter smaller construction firms. The limited availability of skilled labor proficient in operating and maintaining 3D concrete printing systems also poses a constraint. Regulatory hurdles and building codes that haven't fully adapted to this new technology also slow down wider adoption. Furthermore, concerns regarding the long-term durability and performance of 3D-printed concrete structures in various environmental conditions require further research and validation. Overcoming these challenges through industry collaboration, skill development programs, and regulatory harmonization is crucial to unlocking the full potential of this transformative technology. The ongoing innovation in material science and the development of sustainable concrete formulations will further propel the market's expansion in the coming years.
3D Concrete Printing Market Report: 2019-2033
This comprehensive report provides a detailed analysis of the 3D Concrete Printing market, offering actionable insights for stakeholders across the construction and materials industries. Covering the period 2019-2033, with a focus on 2025, this report examines market dynamics, leading players, technological advancements, and future growth opportunities. The market is projected to reach xx Million by 2033, exhibiting a CAGR of xx% during the forecast period (2025-2033).
3D Concrete Printing Market Market Dynamics & Concentration
The 3D concrete printing market is characterized by a dynamic interplay of factors influencing its growth and concentration. Market concentration is currently moderate, with several key players holding significant shares, but a landscape of smaller, innovative companies is also emerging. Innovation is a primary driver, with continuous advancements in printing technologies, materials science, and software solutions. Regulatory frameworks, while still developing in many regions, are increasingly shaping adoption rates and safety standards. The market also faces competition from traditional construction methods, though the advantages of 3D printing in terms of speed, efficiency, and design flexibility are creating a compelling alternative. Mergers and acquisitions (M&A) activity is anticipated to increase, driven by the need for consolidation and access to new technologies and markets.
- Market Share: The top 5 players currently hold approximately xx% of the market share.
- M&A Activity: An estimated xx M&A deals occurred between 2019 and 2024. The forecast for 2025-2033 is xx deals.
- Innovation Drivers: Advancements in robotic systems, material science (high-performance concrete), and software algorithms are key.
- Regulatory Landscape: Varying building codes and safety regulations across different countries present both opportunities and challenges.
- Product Substitutes: Traditional construction methods remain the primary substitute, but the increasing cost-effectiveness of 3D printing is reducing this advantage.
3D Concrete Printing Market Industry Trends & Analysis
The 3D concrete printing market is experiencing rapid growth fueled by several key trends. The increasing demand for affordable housing, coupled with the need for faster construction timelines, is driving significant adoption. Technological advancements, such as improved printing precision and the development of new, high-performance concrete mixes, are enhancing the efficiency and capabilities of 3D printing technology. Consumer preferences are shifting towards sustainable and innovative building methods, aligning well with the environmental benefits of 3D concrete printing, which often reduces material waste. The competitive landscape is characterized by both established construction companies and specialized 3D printing firms, fostering innovation and competition. The market penetration of 3D concrete printing is currently at xx%, with projections of reaching xx% by 2033.
Leading Markets & Segments in 3D Concrete Printing Market
The residential segment currently dominates the 3D concrete printing market, driven by the increasing demand for affordable and rapidly constructed housing. However, significant growth is anticipated in the commercial and infrastructural sectors as well. Geographically, North America and Europe are currently leading markets, but significant opportunities exist in rapidly developing economies in Asia and Africa. The adoption of ready-mix concrete is currently highest due to its widespread availability and cost-effectiveness, although high-performance concrete is increasingly preferred for its enhanced durability and strength.
- End-use Sector Drivers:
- Residential: High demand for affordable housing, faster construction times.
- Commercial: Need for unique designs, efficient space utilization.
- Infrastructural: Potential for large-scale projects, efficient bridge and retaining wall construction.
- Architectural: Allows complex and customized designs.
- Concrete Type Drivers:
- Ready-mix: Wide availability, cost-effectiveness.
- High-Performance: Improved strength, durability, and longevity.
- Precast: Enables off-site manufacturing and faster on-site assembly.
- Shotcrete: Suitable for specific applications like repairing damaged structures or creating complex shapes.
The dominance of North America and Europe is attributed to factors like technological advancements, robust construction industries, and supportive regulatory frameworks. However, the developing economies present significant growth potential, driven by infrastructure development projects.
3D Concrete Printing Market Product Developments
Recent product innovations include advancements in printing materials, which are increasingly focusing on sustainability and strength. New software solutions are improving design capabilities and optimizing printing processes for greater efficiency and cost-effectiveness. These developments are driving wider adoption across various sectors, demonstrating a strong market fit for 3D concrete printing technology. The integration of advanced sensors and AI into printing systems is enhancing precision and overall quality.
Key Drivers of 3D Concrete Printing Market Growth
Several factors are driving the growth of the 3D concrete printing market. Technological advancements leading to increased printing speed, precision, and material efficiency are key drivers. The economic benefits of reduced labor costs and material waste are highly attractive to developers and contractors. Furthermore, supportive government regulations and policies promoting sustainable construction methods are fostering adoption.
Challenges in the 3D Concrete Printing Market Market
Despite its growth potential, the 3D concrete printing market faces challenges such as the relatively high initial investment costs associated with purchasing and implementing 3D printing equipment. Supply chain disruptions can hinder the availability of specialized materials and components. Intense competition from traditional construction methods also impacts market penetration. These factors, alongside inconsistencies in regulatory frameworks across different regions, can hamper growth.
Emerging Opportunities in 3D Concrete Printing Market
The long-term growth of the 3D concrete printing market is driven by emerging opportunities such as increased collaboration between construction companies and technology providers, leading to the development of more efficient and cost-effective solutions. Market expansion into new regions and sectors, particularly in developing economies with significant infrastructure needs, presents substantial opportunities. Advancements in material science, which will allow for the creation of more durable and sustainable concrete, will significantly drive the market.
Leading Players in the 3D Concrete Printing Market Sector
- MUDBOTS 3D CONCRETE PRINTING LLC
- HOLCIM
- Apis Cor Inc
- HEIDELBERGCEMENT AG
- CyBe Construction
- ICON Technology Inc
- WASP Srl - Via Castelletto
- XtreeE
- Sika AG
- Skanska
- Yingchuang Building Technique (Shanghai) Co Ltd (WinSun)
- COBOD
Key Milestones in 3D Concrete Printing Market Industry
- October 2022: Holcim's investment in COBOD International signifies a major step in advancing 3D printing materials and automation, demonstrating the industry's commitment to innovation. Successful collaborations on projects like the 3D-printed windmill tower bases with GE, the world's first 3D-printed school in Malawi, and Africa's largest 3D-printed affordable housing project in Kenya showcase the technology's real-world applications and potential impact on global construction.
- April 2022: ICON's contract with the US Army to build the largest 3D-printed buildings in the West highlights the increasing adoption of the technology in large-scale projects, particularly within the defense sector. The use of ICON's Vulcan printer demonstrates the scalability and reliability of existing technology.
Strategic Outlook for 3D Concrete Printing Market Market
The future of the 3D concrete printing market is bright, with continued growth expected across various sectors and regions. Strategic partnerships between technology providers and construction companies will be key to accelerating innovation and market penetration. A focus on sustainability and the development of high-performance, eco-friendly concrete materials will be critical for long-term success. The potential for significant cost savings, increased construction speed, and unique design possibilities ensures the technology's sustained growth.
3D Concrete Printing Market Segmentation
-
1. Concrete Type
- 1.1. Ready-mix
- 1.2. High Performance
- 1.3. Precast
- 1.4. Shotcrete
-
2. End-use Sector
- 2.1. Residential
- 2.2. Commercial
- 2.3. Infrastructural
- 2.4. Architectural
3D Concrete Printing Market Segmentation By Geography
-
1. Asia Pacific
- 1.1. China
- 1.2. India
- 1.3. Japan
- 1.4. South Korea
- 1.5. ASEAN Countries
- 1.6. Rest of Asia Pacific
-
2. North America
- 2.1. United States
- 2.2. Canada
- 2.3. Mexico
-
3. Europe
- 3.1. Germany
- 3.2. United Kingdom
- 3.3. France
- 3.4. Nordic Countries
- 3.5. The Netherlands
- 3.6. Rest of Europe
-
4. South America
- 4.1. Brazil
- 4.2. Argentina
- 4.3. Rest of South America
-
5. Middle East and Africa
- 5.1. GCC Countries
- 5.2. South Africa
- 5.3. Rest of Middle East and Africa
3D Concrete Printing Market REPORT HIGHLIGHTS
| Aspects | Details |
|---|---|
| Study Period | 2019-2033 |
| Base Year | 2024 |
| Estimated Year | 2025 |
| Forecast Period | 2025-2033 |
| Historical Period | 2019-2024 |
| Growth Rate | CAGR of > 65.00% from 2019-2033 |
| Segmentation |
|
Table of Contents
- 1. Introduction
- 1.1. Research Scope
- 1.2. Market Segmentation
- 1.3. Research Methodology
- 1.4. Definitions and Assumptions
- 2. Executive Summary
- 2.1. Introduction
- 3. Market Dynamics
- 3.1. Introduction
- 3.2. Market Drivers
- 3.2.1. Increasing Demand for Customized and Money Efficient Constructions; Increasing Investments in Infrastructure due to Rapid Urbanization and Industrialization; Increasing Focus on Eco-friendly and Smart Constructions
- 3.3. Market Restrains
- 3.3.1. Stagnant Industrial Growth in the Developed Countries
- 3.4. Market Trends
- 3.4.1. Infrastructural Sector to Dominate the Market
- 4. Market Factor Analysis
- 4.1. Porters Five Forces
- 4.2. Supply/Value Chain
- 4.3. PESTEL analysis
- 4.4. Market Entropy
- 4.5. Patent/Trademark Analysis
- 5. Global 3D Concrete Printing Market Analysis, Insights and Forecast, 2019-2031
- 5.1. Market Analysis, Insights and Forecast - by Concrete Type
- 5.1.1. Ready-mix
- 5.1.2. High Performance
- 5.1.3. Precast
- 5.1.4. Shotcrete
- 5.2. Market Analysis, Insights and Forecast - by End-use Sector
- 5.2.1. Residential
- 5.2.2. Commercial
- 5.2.3. Infrastructural
- 5.2.4. Architectural
- 5.3. Market Analysis, Insights and Forecast - by Region
- 5.3.1. Asia Pacific
- 5.3.2. North America
- 5.3.3. Europe
- 5.3.4. South America
- 5.3.5. Middle East and Africa
- 5.1. Market Analysis, Insights and Forecast - by Concrete Type
- 6. Asia Pacific 3D Concrete Printing Market Analysis, Insights and Forecast, 2019-2031
- 6.1. Market Analysis, Insights and Forecast - by Concrete Type
- 6.1.1. Ready-mix
- 6.1.2. High Performance
- 6.1.3. Precast
- 6.1.4. Shotcrete
- 6.2. Market Analysis, Insights and Forecast - by End-use Sector
- 6.2.1. Residential
- 6.2.2. Commercial
- 6.2.3. Infrastructural
- 6.2.4. Architectural
- 6.1. Market Analysis, Insights and Forecast - by Concrete Type
- 7. North America 3D Concrete Printing Market Analysis, Insights and Forecast, 2019-2031
- 7.1. Market Analysis, Insights and Forecast - by Concrete Type
- 7.1.1. Ready-mix
- 7.1.2. High Performance
- 7.1.3. Precast
- 7.1.4. Shotcrete
- 7.2. Market Analysis, Insights and Forecast - by End-use Sector
- 7.2.1. Residential
- 7.2.2. Commercial
- 7.2.3. Infrastructural
- 7.2.4. Architectural
- 7.1. Market Analysis, Insights and Forecast - by Concrete Type
- 8. Europe 3D Concrete Printing Market Analysis, Insights and Forecast, 2019-2031
- 8.1. Market Analysis, Insights and Forecast - by Concrete Type
- 8.1.1. Ready-mix
- 8.1.2. High Performance
- 8.1.3. Precast
- 8.1.4. Shotcrete
- 8.2. Market Analysis, Insights and Forecast - by End-use Sector
- 8.2.1. Residential
- 8.2.2. Commercial
- 8.2.3. Infrastructural
- 8.2.4. Architectural
- 8.1. Market Analysis, Insights and Forecast - by Concrete Type
- 9. South America 3D Concrete Printing Market Analysis, Insights and Forecast, 2019-2031
- 9.1. Market Analysis, Insights and Forecast - by Concrete Type
- 9.1.1. Ready-mix
- 9.1.2. High Performance
- 9.1.3. Precast
- 9.1.4. Shotcrete
- 9.2. Market Analysis, Insights and Forecast - by End-use Sector
- 9.2.1. Residential
- 9.2.2. Commercial
- 9.2.3. Infrastructural
- 9.2.4. Architectural
- 9.1. Market Analysis, Insights and Forecast - by Concrete Type
- 10. Middle East and Africa 3D Concrete Printing Market Analysis, Insights and Forecast, 2019-2031
- 10.1. Market Analysis, Insights and Forecast - by Concrete Type
- 10.1.1. Ready-mix
- 10.1.2. High Performance
- 10.1.3. Precast
- 10.1.4. Shotcrete
- 10.2. Market Analysis, Insights and Forecast - by End-use Sector
- 10.2.1. Residential
- 10.2.2. Commercial
- 10.2.3. Infrastructural
- 10.2.4. Architectural
- 10.1. Market Analysis, Insights and Forecast - by Concrete Type
- 11. North America 3D Concrete Printing Market Analysis, Insights and Forecast, 2019-2031
- 11.1. Market Analysis, Insights and Forecast - By Country/Sub-region
- 11.1.1 United States
- 11.1.2 Canada
- 11.1.3 Mexico
- 12. Europe 3D Concrete Printing Market Analysis, Insights and Forecast, 2019-2031
- 12.1. Market Analysis, Insights and Forecast - By Country/Sub-region
- 12.1.1 Germany
- 12.1.2 France
- 12.1.3 Italy
- 12.1.4 United Kingdom
- 12.1.5 Netherlands
- 12.1.6 Rest of Europe
- 13. Asia Pacific 3D Concrete Printing Market Analysis, Insights and Forecast, 2019-2031
- 13.1. Market Analysis, Insights and Forecast - By Country/Sub-region
- 13.1.1 China
- 13.1.2 Japan
- 13.1.3 India
- 13.1.4 South Korea
- 13.1.5 Taiwan
- 13.1.6 Australia
- 13.1.7 Rest of Asia-Pacific
- 14. South America 3D Concrete Printing Market Analysis, Insights and Forecast, 2019-2031
- 14.1. Market Analysis, Insights and Forecast - By Country/Sub-region
- 14.1.1 Brazil
- 14.1.2 Argentina
- 14.1.3 Rest of South America
- 15. Middle East and Africa 3D Concrete Printing Market Analysis, Insights and Forecast, 2019-2031
- 15.1. Market Analysis, Insights and Forecast - By Country/Sub-region
- 15.1.1 Middle East
- 15.1.2 Africa
- 16. Competitive Analysis
- 16.1. Global Market Share Analysis 2024
- 16.2. Company Profiles
- 16.2.1 MUDBOTS 3D CONCRETE PRINTING LLC
- 16.2.1.1. Overview
- 16.2.1.2. Products
- 16.2.1.3. SWOT Analysis
- 16.2.1.4. Recent Developments
- 16.2.1.5. Financials (Based on Availability)
- 16.2.2 HOLCIM
- 16.2.2.1. Overview
- 16.2.2.2. Products
- 16.2.2.3. SWOT Analysis
- 16.2.2.4. Recent Developments
- 16.2.2.5. Financials (Based on Availability)
- 16.2.3 Apis Cor Inc
- 16.2.3.1. Overview
- 16.2.3.2. Products
- 16.2.3.3. SWOT Analysis
- 16.2.3.4. Recent Developments
- 16.2.3.5. Financials (Based on Availability)
- 16.2.4 HEIDELBERGCEMENT AG
- 16.2.4.1. Overview
- 16.2.4.2. Products
- 16.2.4.3. SWOT Analysis
- 16.2.4.4. Recent Developments
- 16.2.4.5. Financials (Based on Availability)
- 16.2.5 CyBe Construction
- 16.2.5.1. Overview
- 16.2.5.2. Products
- 16.2.5.3. SWOT Analysis
- 16.2.5.4. Recent Developments
- 16.2.5.5. Financials (Based on Availability)
- 16.2.6 ICON Technology Inc
- 16.2.6.1. Overview
- 16.2.6.2. Products
- 16.2.6.3. SWOT Analysis
- 16.2.6.4. Recent Developments
- 16.2.6.5. Financials (Based on Availability)
- 16.2.7 WASP Srl - Via Castelletto
- 16.2.7.1. Overview
- 16.2.7.2. Products
- 16.2.7.3. SWOT Analysis
- 16.2.7.4. Recent Developments
- 16.2.7.5. Financials (Based on Availability)
- 16.2.8 XtreeE
- 16.2.8.1. Overview
- 16.2.8.2. Products
- 16.2.8.3. SWOT Analysis
- 16.2.8.4. Recent Developments
- 16.2.8.5. Financials (Based on Availability)
- 16.2.9 Sika AG
- 16.2.9.1. Overview
- 16.2.9.2. Products
- 16.2.9.3. SWOT Analysis
- 16.2.9.4. Recent Developments
- 16.2.9.5. Financials (Based on Availability)
- 16.2.10 Skanska
- 16.2.10.1. Overview
- 16.2.10.2. Products
- 16.2.10.3. SWOT Analysis
- 16.2.10.4. Recent Developments
- 16.2.10.5. Financials (Based on Availability)
- 16.2.11 Yingchuang Building Technique (Shanghai) Co Ltd (WinSun)
- 16.2.11.1. Overview
- 16.2.11.2. Products
- 16.2.11.3. SWOT Analysis
- 16.2.11.4. Recent Developments
- 16.2.11.5. Financials (Based on Availability)
- 16.2.12 COBOD
- 16.2.12.1. Overview
- 16.2.12.2. Products
- 16.2.12.3. SWOT Analysis
- 16.2.12.4. Recent Developments
- 16.2.12.5. Financials (Based on Availability)
- 16.2.1 MUDBOTS 3D CONCRETE PRINTING LLC
List of Figures
- Figure 1: Global 3D Concrete Printing Market Revenue Breakdown (Million, %) by Region 2024 & 2032
- Figure 2: Global 3D Concrete Printing Market Volume Breakdown (K Tons, %) by Region 2024 & 2032
- Figure 3: North America 3D Concrete Printing Market Revenue (Million), by Country 2024 & 2032
- Figure 4: North America 3D Concrete Printing Market Volume (K Tons), by Country 2024 & 2032
- Figure 5: North America 3D Concrete Printing Market Revenue Share (%), by Country 2024 & 2032
- Figure 6: North America 3D Concrete Printing Market Volume Share (%), by Country 2024 & 2032
- Figure 7: Europe 3D Concrete Printing Market Revenue (Million), by Country 2024 & 2032
- Figure 8: Europe 3D Concrete Printing Market Volume (K Tons), by Country 2024 & 2032
- Figure 9: Europe 3D Concrete Printing Market Revenue Share (%), by Country 2024 & 2032
- Figure 10: Europe 3D Concrete Printing Market Volume Share (%), by Country 2024 & 2032
- Figure 11: Asia Pacific 3D Concrete Printing Market Revenue (Million), by Country 2024 & 2032
- Figure 12: Asia Pacific 3D Concrete Printing Market Volume (K Tons), by Country 2024 & 2032
- Figure 13: Asia Pacific 3D Concrete Printing Market Revenue Share (%), by Country 2024 & 2032
- Figure 14: Asia Pacific 3D Concrete Printing Market Volume Share (%), by Country 2024 & 2032
- Figure 15: South America 3D Concrete Printing Market Revenue (Million), by Country 2024 & 2032
- Figure 16: South America 3D Concrete Printing Market Volume (K Tons), by Country 2024 & 2032
- Figure 17: South America 3D Concrete Printing Market Revenue Share (%), by Country 2024 & 2032
- Figure 18: South America 3D Concrete Printing Market Volume Share (%), by Country 2024 & 2032
- Figure 19: Middle East and Africa 3D Concrete Printing Market Revenue (Million), by Country 2024 & 2032
- Figure 20: Middle East and Africa 3D Concrete Printing Market Volume (K Tons), by Country 2024 & 2032
- Figure 21: Middle East and Africa 3D Concrete Printing Market Revenue Share (%), by Country 2024 & 2032
- Figure 22: Middle East and Africa 3D Concrete Printing Market Volume Share (%), by Country 2024 & 2032
- Figure 23: Asia Pacific 3D Concrete Printing Market Revenue (Million), by Concrete Type 2024 & 2032
- Figure 24: Asia Pacific 3D Concrete Printing Market Volume (K Tons), by Concrete Type 2024 & 2032
- Figure 25: Asia Pacific 3D Concrete Printing Market Revenue Share (%), by Concrete Type 2024 & 2032
- Figure 26: Asia Pacific 3D Concrete Printing Market Volume Share (%), by Concrete Type 2024 & 2032
- Figure 27: Asia Pacific 3D Concrete Printing Market Revenue (Million), by End-use Sector 2024 & 2032
- Figure 28: Asia Pacific 3D Concrete Printing Market Volume (K Tons), by End-use Sector 2024 & 2032
- Figure 29: Asia Pacific 3D Concrete Printing Market Revenue Share (%), by End-use Sector 2024 & 2032
- Figure 30: Asia Pacific 3D Concrete Printing Market Volume Share (%), by End-use Sector 2024 & 2032
- Figure 31: Asia Pacific 3D Concrete Printing Market Revenue (Million), by Country 2024 & 2032
- Figure 32: Asia Pacific 3D Concrete Printing Market Volume (K Tons), by Country 2024 & 2032
- Figure 33: Asia Pacific 3D Concrete Printing Market Revenue Share (%), by Country 2024 & 2032
- Figure 34: Asia Pacific 3D Concrete Printing Market Volume Share (%), by Country 2024 & 2032
- Figure 35: North America 3D Concrete Printing Market Revenue (Million), by Concrete Type 2024 & 2032
- Figure 36: North America 3D Concrete Printing Market Volume (K Tons), by Concrete Type 2024 & 2032
- Figure 37: North America 3D Concrete Printing Market Revenue Share (%), by Concrete Type 2024 & 2032
- Figure 38: North America 3D Concrete Printing Market Volume Share (%), by Concrete Type 2024 & 2032
- Figure 39: North America 3D Concrete Printing Market Revenue (Million), by End-use Sector 2024 & 2032
- Figure 40: North America 3D Concrete Printing Market Volume (K Tons), by End-use Sector 2024 & 2032
- Figure 41: North America 3D Concrete Printing Market Revenue Share (%), by End-use Sector 2024 & 2032
- Figure 42: North America 3D Concrete Printing Market Volume Share (%), by End-use Sector 2024 & 2032
- Figure 43: North America 3D Concrete Printing Market Revenue (Million), by Country 2024 & 2032
- Figure 44: North America 3D Concrete Printing Market Volume (K Tons), by Country 2024 & 2032
- Figure 45: North America 3D Concrete Printing Market Revenue Share (%), by Country 2024 & 2032
- Figure 46: North America 3D Concrete Printing Market Volume Share (%), by Country 2024 & 2032
- Figure 47: Europe 3D Concrete Printing Market Revenue (Million), by Concrete Type 2024 & 2032
- Figure 48: Europe 3D Concrete Printing Market Volume (K Tons), by Concrete Type 2024 & 2032
- Figure 49: Europe 3D Concrete Printing Market Revenue Share (%), by Concrete Type 2024 & 2032
- Figure 50: Europe 3D Concrete Printing Market Volume Share (%), by Concrete Type 2024 & 2032
- Figure 51: Europe 3D Concrete Printing Market Revenue (Million), by End-use Sector 2024 & 2032
- Figure 52: Europe 3D Concrete Printing Market Volume (K Tons), by End-use Sector 2024 & 2032
- Figure 53: Europe 3D Concrete Printing Market Revenue Share (%), by End-use Sector 2024 & 2032
- Figure 54: Europe 3D Concrete Printing Market Volume Share (%), by End-use Sector 2024 & 2032
- Figure 55: Europe 3D Concrete Printing Market Revenue (Million), by Country 2024 & 2032
- Figure 56: Europe 3D Concrete Printing Market Volume (K Tons), by Country 2024 & 2032
- Figure 57: Europe 3D Concrete Printing Market Revenue Share (%), by Country 2024 & 2032
- Figure 58: Europe 3D Concrete Printing Market Volume Share (%), by Country 2024 & 2032
- Figure 59: South America 3D Concrete Printing Market Revenue (Million), by Concrete Type 2024 & 2032
- Figure 60: South America 3D Concrete Printing Market Volume (K Tons), by Concrete Type 2024 & 2032
- Figure 61: South America 3D Concrete Printing Market Revenue Share (%), by Concrete Type 2024 & 2032
- Figure 62: South America 3D Concrete Printing Market Volume Share (%), by Concrete Type 2024 & 2032
- Figure 63: South America 3D Concrete Printing Market Revenue (Million), by End-use Sector 2024 & 2032
- Figure 64: South America 3D Concrete Printing Market Volume (K Tons), by End-use Sector 2024 & 2032
- Figure 65: South America 3D Concrete Printing Market Revenue Share (%), by End-use Sector 2024 & 2032
- Figure 66: South America 3D Concrete Printing Market Volume Share (%), by End-use Sector 2024 & 2032
- Figure 67: South America 3D Concrete Printing Market Revenue (Million), by Country 2024 & 2032
- Figure 68: South America 3D Concrete Printing Market Volume (K Tons), by Country 2024 & 2032
- Figure 69: South America 3D Concrete Printing Market Revenue Share (%), by Country 2024 & 2032
- Figure 70: South America 3D Concrete Printing Market Volume Share (%), by Country 2024 & 2032
- Figure 71: Middle East and Africa 3D Concrete Printing Market Revenue (Million), by Concrete Type 2024 & 2032
- Figure 72: Middle East and Africa 3D Concrete Printing Market Volume (K Tons), by Concrete Type 2024 & 2032
- Figure 73: Middle East and Africa 3D Concrete Printing Market Revenue Share (%), by Concrete Type 2024 & 2032
- Figure 74: Middle East and Africa 3D Concrete Printing Market Volume Share (%), by Concrete Type 2024 & 2032
- Figure 75: Middle East and Africa 3D Concrete Printing Market Revenue (Million), by End-use Sector 2024 & 2032
- Figure 76: Middle East and Africa 3D Concrete Printing Market Volume (K Tons), by End-use Sector 2024 & 2032
- Figure 77: Middle East and Africa 3D Concrete Printing Market Revenue Share (%), by End-use Sector 2024 & 2032
- Figure 78: Middle East and Africa 3D Concrete Printing Market Volume Share (%), by End-use Sector 2024 & 2032
- Figure 79: Middle East and Africa 3D Concrete Printing Market Revenue (Million), by Country 2024 & 2032
- Figure 80: Middle East and Africa 3D Concrete Printing Market Volume (K Tons), by Country 2024 & 2032
- Figure 81: Middle East and Africa 3D Concrete Printing Market Revenue Share (%), by Country 2024 & 2032
- Figure 82: Middle East and Africa 3D Concrete Printing Market Volume Share (%), by Country 2024 & 2032
List of Tables
- Table 1: Global 3D Concrete Printing Market Revenue Million Forecast, by Region 2019 & 2032
- Table 2: Global 3D Concrete Printing Market Volume K Tons Forecast, by Region 2019 & 2032
- Table 3: Global 3D Concrete Printing Market Revenue Million Forecast, by Concrete Type 2019 & 2032
- Table 4: Global 3D Concrete Printing Market Volume K Tons Forecast, by Concrete Type 2019 & 2032
- Table 5: Global 3D Concrete Printing Market Revenue Million Forecast, by End-use Sector 2019 & 2032
- Table 6: Global 3D Concrete Printing Market Volume K Tons Forecast, by End-use Sector 2019 & 2032
- Table 7: Global 3D Concrete Printing Market Revenue Million Forecast, by Region 2019 & 2032
- Table 8: Global 3D Concrete Printing Market Volume K Tons Forecast, by Region 2019 & 2032
- Table 9: Global 3D Concrete Printing Market Revenue Million Forecast, by Country 2019 & 2032
- Table 10: Global 3D Concrete Printing Market Volume K Tons Forecast, by Country 2019 & 2032
- Table 11: United States 3D Concrete Printing Market Revenue (Million) Forecast, by Application 2019 & 2032
- Table 12: United States 3D Concrete Printing Market Volume (K Tons) Forecast, by Application 2019 & 2032
- Table 13: Canada 3D Concrete Printing Market Revenue (Million) Forecast, by Application 2019 & 2032
- Table 14: Canada 3D Concrete Printing Market Volume (K Tons) Forecast, by Application 2019 & 2032
- Table 15: Mexico 3D Concrete Printing Market Revenue (Million) Forecast, by Application 2019 & 2032
- Table 16: Mexico 3D Concrete Printing Market Volume (K Tons) Forecast, by Application 2019 & 2032
- Table 17: Global 3D Concrete Printing Market Revenue Million Forecast, by Country 2019 & 2032
- Table 18: Global 3D Concrete Printing Market Volume K Tons Forecast, by Country 2019 & 2032
- Table 19: Germany 3D Concrete Printing Market Revenue (Million) Forecast, by Application 2019 & 2032
- Table 20: Germany 3D Concrete Printing Market Volume (K Tons) Forecast, by Application 2019 & 2032
- Table 21: France 3D Concrete Printing Market Revenue (Million) Forecast, by Application 2019 & 2032
- Table 22: France 3D Concrete Printing Market Volume (K Tons) Forecast, by Application 2019 & 2032
- Table 23: Italy 3D Concrete Printing Market Revenue (Million) Forecast, by Application 2019 & 2032
- Table 24: Italy 3D Concrete Printing Market Volume (K Tons) Forecast, by Application 2019 & 2032
- Table 25: United Kingdom 3D Concrete Printing Market Revenue (Million) Forecast, by Application 2019 & 2032
- Table 26: United Kingdom 3D Concrete Printing Market Volume (K Tons) Forecast, by Application 2019 & 2032
- Table 27: Netherlands 3D Concrete Printing Market Revenue (Million) Forecast, by Application 2019 & 2032
- Table 28: Netherlands 3D Concrete Printing Market Volume (K Tons) Forecast, by Application 2019 & 2032
- Table 29: Rest of Europe 3D Concrete Printing Market Revenue (Million) Forecast, by Application 2019 & 2032
- Table 30: Rest of Europe 3D Concrete Printing Market Volume (K Tons) Forecast, by Application 2019 & 2032
- Table 31: Global 3D Concrete Printing Market Revenue Million Forecast, by Country 2019 & 2032
- Table 32: Global 3D Concrete Printing Market Volume K Tons Forecast, by Country 2019 & 2032
- Table 33: China 3D Concrete Printing Market Revenue (Million) Forecast, by Application 2019 & 2032
- Table 34: China 3D Concrete Printing Market Volume (K Tons) Forecast, by Application 2019 & 2032
- Table 35: Japan 3D Concrete Printing Market Revenue (Million) Forecast, by Application 2019 & 2032
- Table 36: Japan 3D Concrete Printing Market Volume (K Tons) Forecast, by Application 2019 & 2032
- Table 37: India 3D Concrete Printing Market Revenue (Million) Forecast, by Application 2019 & 2032
- Table 38: India 3D Concrete Printing Market Volume (K Tons) Forecast, by Application 2019 & 2032
- Table 39: South Korea 3D Concrete Printing Market Revenue (Million) Forecast, by Application 2019 & 2032
- Table 40: South Korea 3D Concrete Printing Market Volume (K Tons) Forecast, by Application 2019 & 2032
- Table 41: Taiwan 3D Concrete Printing Market Revenue (Million) Forecast, by Application 2019 & 2032
- Table 42: Taiwan 3D Concrete Printing Market Volume (K Tons) Forecast, by Application 2019 & 2032
- Table 43: Australia 3D Concrete Printing Market Revenue (Million) Forecast, by Application 2019 & 2032
- Table 44: Australia 3D Concrete Printing Market Volume (K Tons) Forecast, by Application 2019 & 2032
- Table 45: Rest of Asia-Pacific 3D Concrete Printing Market Revenue (Million) Forecast, by Application 2019 & 2032
- Table 46: Rest of Asia-Pacific 3D Concrete Printing Market Volume (K Tons) Forecast, by Application 2019 & 2032
- Table 47: Global 3D Concrete Printing Market Revenue Million Forecast, by Country 2019 & 2032
- Table 48: Global 3D Concrete Printing Market Volume K Tons Forecast, by Country 2019 & 2032
- Table 49: Brazil 3D Concrete Printing Market Revenue (Million) Forecast, by Application 2019 & 2032
- Table 50: Brazil 3D Concrete Printing Market Volume (K Tons) Forecast, by Application 2019 & 2032
- Table 51: Argentina 3D Concrete Printing Market Revenue (Million) Forecast, by Application 2019 & 2032
- Table 52: Argentina 3D Concrete Printing Market Volume (K Tons) Forecast, by Application 2019 & 2032
- Table 53: Rest of South America 3D Concrete Printing Market Revenue (Million) Forecast, by Application 2019 & 2032
- Table 54: Rest of South America 3D Concrete Printing Market Volume (K Tons) Forecast, by Application 2019 & 2032
- Table 55: Global 3D Concrete Printing Market Revenue Million Forecast, by Country 2019 & 2032
- Table 56: Global 3D Concrete Printing Market Volume K Tons Forecast, by Country 2019 & 2032
- Table 57: Middle East 3D Concrete Printing Market Revenue (Million) Forecast, by Application 2019 & 2032
- Table 58: Middle East 3D Concrete Printing Market Volume (K Tons) Forecast, by Application 2019 & 2032
- Table 59: Africa 3D Concrete Printing Market Revenue (Million) Forecast, by Application 2019 & 2032
- Table 60: Africa 3D Concrete Printing Market Volume (K Tons) Forecast, by Application 2019 & 2032
- Table 61: Global 3D Concrete Printing Market Revenue Million Forecast, by Concrete Type 2019 & 2032
- Table 62: Global 3D Concrete Printing Market Volume K Tons Forecast, by Concrete Type 2019 & 2032
- Table 63: Global 3D Concrete Printing Market Revenue Million Forecast, by End-use Sector 2019 & 2032
- Table 64: Global 3D Concrete Printing Market Volume K Tons Forecast, by End-use Sector 2019 & 2032
- Table 65: Global 3D Concrete Printing Market Revenue Million Forecast, by Country 2019 & 2032
- Table 66: Global 3D Concrete Printing Market Volume K Tons Forecast, by Country 2019 & 2032
- Table 67: China 3D Concrete Printing Market Revenue (Million) Forecast, by Application 2019 & 2032
- Table 68: China 3D Concrete Printing Market Volume (K Tons) Forecast, by Application 2019 & 2032
- Table 69: India 3D Concrete Printing Market Revenue (Million) Forecast, by Application 2019 & 2032
- Table 70: India 3D Concrete Printing Market Volume (K Tons) Forecast, by Application 2019 & 2032
- Table 71: Japan 3D Concrete Printing Market Revenue (Million) Forecast, by Application 2019 & 2032
- Table 72: Japan 3D Concrete Printing Market Volume (K Tons) Forecast, by Application 2019 & 2032
- Table 73: South Korea 3D Concrete Printing Market Revenue (Million) Forecast, by Application 2019 & 2032
- Table 74: South Korea 3D Concrete Printing Market Volume (K Tons) Forecast, by Application 2019 & 2032
- Table 75: ASEAN Countries 3D Concrete Printing Market Revenue (Million) Forecast, by Application 2019 & 2032
- Table 76: ASEAN Countries 3D Concrete Printing Market Volume (K Tons) Forecast, by Application 2019 & 2032
- Table 77: Rest of Asia Pacific 3D Concrete Printing Market Revenue (Million) Forecast, by Application 2019 & 2032
- Table 78: Rest of Asia Pacific 3D Concrete Printing Market Volume (K Tons) Forecast, by Application 2019 & 2032
- Table 79: Global 3D Concrete Printing Market Revenue Million Forecast, by Concrete Type 2019 & 2032
- Table 80: Global 3D Concrete Printing Market Volume K Tons Forecast, by Concrete Type 2019 & 2032
- Table 81: Global 3D Concrete Printing Market Revenue Million Forecast, by End-use Sector 2019 & 2032
- Table 82: Global 3D Concrete Printing Market Volume K Tons Forecast, by End-use Sector 2019 & 2032
- Table 83: Global 3D Concrete Printing Market Revenue Million Forecast, by Country 2019 & 2032
- Table 84: Global 3D Concrete Printing Market Volume K Tons Forecast, by Country 2019 & 2032
- Table 85: United States 3D Concrete Printing Market Revenue (Million) Forecast, by Application 2019 & 2032
- Table 86: United States 3D Concrete Printing Market Volume (K Tons) Forecast, by Application 2019 & 2032
- Table 87: Canada 3D Concrete Printing Market Revenue (Million) Forecast, by Application 2019 & 2032
- Table 88: Canada 3D Concrete Printing Market Volume (K Tons) Forecast, by Application 2019 & 2032
- Table 89: Mexico 3D Concrete Printing Market Revenue (Million) Forecast, by Application 2019 & 2032
- Table 90: Mexico 3D Concrete Printing Market Volume (K Tons) Forecast, by Application 2019 & 2032
- Table 91: Global 3D Concrete Printing Market Revenue Million Forecast, by Concrete Type 2019 & 2032
- Table 92: Global 3D Concrete Printing Market Volume K Tons Forecast, by Concrete Type 2019 & 2032
- Table 93: Global 3D Concrete Printing Market Revenue Million Forecast, by End-use Sector 2019 & 2032
- Table 94: Global 3D Concrete Printing Market Volume K Tons Forecast, by End-use Sector 2019 & 2032
- Table 95: Global 3D Concrete Printing Market Revenue Million Forecast, by Country 2019 & 2032
- Table 96: Global 3D Concrete Printing Market Volume K Tons Forecast, by Country 2019 & 2032
- Table 97: Germany 3D Concrete Printing Market Revenue (Million) Forecast, by Application 2019 & 2032
- Table 98: Germany 3D Concrete Printing Market Volume (K Tons) Forecast, by Application 2019 & 2032
- Table 99: United Kingdom 3D Concrete Printing Market Revenue (Million) Forecast, by Application 2019 & 2032
- Table 100: United Kingdom 3D Concrete Printing Market Volume (K Tons) Forecast, by Application 2019 & 2032
- Table 101: France 3D Concrete Printing Market Revenue (Million) Forecast, by Application 2019 & 2032
- Table 102: France 3D Concrete Printing Market Volume (K Tons) Forecast, by Application 2019 & 2032
- Table 103: Nordic Countries 3D Concrete Printing Market Revenue (Million) Forecast, by Application 2019 & 2032
- Table 104: Nordic Countries 3D Concrete Printing Market Volume (K Tons) Forecast, by Application 2019 & 2032
- Table 105: The Netherlands 3D Concrete Printing Market Revenue (Million) Forecast, by Application 2019 & 2032
- Table 106: The Netherlands 3D Concrete Printing Market Volume (K Tons) Forecast, by Application 2019 & 2032
- Table 107: Rest of Europe 3D Concrete Printing Market Revenue (Million) Forecast, by Application 2019 & 2032
- Table 108: Rest of Europe 3D Concrete Printing Market Volume (K Tons) Forecast, by Application 2019 & 2032
- Table 109: Global 3D Concrete Printing Market Revenue Million Forecast, by Concrete Type 2019 & 2032
- Table 110: Global 3D Concrete Printing Market Volume K Tons Forecast, by Concrete Type 2019 & 2032
- Table 111: Global 3D Concrete Printing Market Revenue Million Forecast, by End-use Sector 2019 & 2032
- Table 112: Global 3D Concrete Printing Market Volume K Tons Forecast, by End-use Sector 2019 & 2032
- Table 113: Global 3D Concrete Printing Market Revenue Million Forecast, by Country 2019 & 2032
- Table 114: Global 3D Concrete Printing Market Volume K Tons Forecast, by Country 2019 & 2032
- Table 115: Brazil 3D Concrete Printing Market Revenue (Million) Forecast, by Application 2019 & 2032
- Table 116: Brazil 3D Concrete Printing Market Volume (K Tons) Forecast, by Application 2019 & 2032
- Table 117: Argentina 3D Concrete Printing Market Revenue (Million) Forecast, by Application 2019 & 2032
- Table 118: Argentina 3D Concrete Printing Market Volume (K Tons) Forecast, by Application 2019 & 2032
- Table 119: Rest of South America 3D Concrete Printing Market Revenue (Million) Forecast, by Application 2019 & 2032
- Table 120: Rest of South America 3D Concrete Printing Market Volume (K Tons) Forecast, by Application 2019 & 2032
- Table 121: Global 3D Concrete Printing Market Revenue Million Forecast, by Concrete Type 2019 & 2032
- Table 122: Global 3D Concrete Printing Market Volume K Tons Forecast, by Concrete Type 2019 & 2032
- Table 123: Global 3D Concrete Printing Market Revenue Million Forecast, by End-use Sector 2019 & 2032
- Table 124: Global 3D Concrete Printing Market Volume K Tons Forecast, by End-use Sector 2019 & 2032
- Table 125: Global 3D Concrete Printing Market Revenue Million Forecast, by Country 2019 & 2032
- Table 126: Global 3D Concrete Printing Market Volume K Tons Forecast, by Country 2019 & 2032
- Table 127: GCC Countries 3D Concrete Printing Market Revenue (Million) Forecast, by Application 2019 & 2032
- Table 128: GCC Countries 3D Concrete Printing Market Volume (K Tons) Forecast, by Application 2019 & 2032
- Table 129: South Africa 3D Concrete Printing Market Revenue (Million) Forecast, by Application 2019 & 2032
- Table 130: South Africa 3D Concrete Printing Market Volume (K Tons) Forecast, by Application 2019 & 2032
- Table 131: Rest of Middle East and Africa 3D Concrete Printing Market Revenue (Million) Forecast, by Application 2019 & 2032
- Table 132: Rest of Middle East and Africa 3D Concrete Printing Market Volume (K Tons) Forecast, by Application 2019 & 2032
Frequently Asked Questions
1. What is the projected Compound Annual Growth Rate (CAGR) of the 3D Concrete Printing Market?
The projected CAGR is approximately > 65.00%.
2. Which companies are prominent players in the 3D Concrete Printing Market?
Key companies in the market include MUDBOTS 3D CONCRETE PRINTING LLC, HOLCIM, Apis Cor Inc, HEIDELBERGCEMENT AG, CyBe Construction, ICON Technology Inc, WASP Srl - Via Castelletto, XtreeE, Sika AG, Skanska, Yingchuang Building Technique (Shanghai) Co Ltd (WinSun), COBOD.
3. What are the main segments of the 3D Concrete Printing Market?
The market segments include Concrete Type, End-use Sector.
4. Can you provide details about the market size?
The market size is estimated to be USD XX Million as of 2022.
5. What are some drivers contributing to market growth?
Increasing Demand for Customized and Money Efficient Constructions; Increasing Investments in Infrastructure due to Rapid Urbanization and Industrialization; Increasing Focus on Eco-friendly and Smart Constructions.
6. What are the notable trends driving market growth?
Infrastructural Sector to Dominate the Market.
7. Are there any restraints impacting market growth?
Stagnant Industrial Growth in the Developed Countries.
8. Can you provide examples of recent developments in the market?
October 2022: Holcim announced its investment in COBOD International to advance world-class 3D printing materials, robotics, and automation. The 3D-printed windmill tower bases with GE, the world's first 3D-printed school in Malawi, and Africa's largest 3D-printed affordable housing project in Kenya are just a few of the cutting-edge construction projects on which Holcim and COBOD have successfully collaborated.
9. What pricing options are available for accessing the report?
Pricing options include single-user, multi-user, and enterprise licenses priced at USD 4750, USD 5250, and USD 8750 respectively.
10. Is the market size provided in terms of value or volume?
The market size is provided in terms of value, measured in Million and volume, measured in K Tons.
11. Are there any specific market keywords associated with the report?
Yes, the market keyword associated with the report is "3D Concrete Printing Market," which aids in identifying and referencing the specific market segment covered.
12. How do I determine which pricing option suits my needs best?
The pricing options vary based on user requirements and access needs. Individual users may opt for single-user licenses, while businesses requiring broader access may choose multi-user or enterprise licenses for cost-effective access to the report.
13. Are there any additional resources or data provided in the 3D Concrete Printing Market report?
While the report offers comprehensive insights, it's advisable to review the specific contents or supplementary materials provided to ascertain if additional resources or data are available.
14. How can I stay updated on further developments or reports in the 3D Concrete Printing Market?
To stay informed about further developments, trends, and reports in the 3D Concrete Printing Market, consider subscribing to industry newsletters, following relevant companies and organizations, or regularly checking reputable industry news sources and publications.
Methodology
Step 1 - Identification of Relevant Samples Size from Population Database


Step 2 - Approaches for Defining Global Market Size (Value, Volume* & Price*)

Note*: In applicable scenarios
Step 3 - Data Sources
Primary Research
- Web Analytics
- Survey Reports
- Research Institute
- Latest Research Reports
- Opinion Leaders
Secondary Research
- Annual Reports
- White Paper
- Latest Press Release
- Industry Association
- Paid Database
- Investor Presentations

Step 4 - Data Triangulation
Involves using different sources of information in order to increase the validity of a study
These sources are likely to be stakeholders in a program - participants, other researchers, program staff, other community members, and so on.
Then we put all data in single framework & apply various statistical tools to find out the dynamic on the market.
During the analysis stage, feedback from the stakeholder groups would be compared to determine areas of agreement as well as areas of divergence
