

Key Insights
The USA onshore drilling fluid market is experiencing robust growth, driven by increasing onshore oil and gas exploration and production activities. A compound annual growth rate (CAGR) exceeding 13% from 2019-2033 signifies significant market expansion. This growth is fueled by several key factors, including technological advancements leading to improved drilling efficiency and reduced environmental impact, government incentives promoting domestic energy production, and the ongoing demand for energy resources. The market is segmented by fluid type (water-based, oil-based, synthetic-based), application (conventional drilling, horizontal drilling, directional drilling), and geographic region. While challenges exist, such as fluctuating oil prices and stringent environmental regulations, the long-term outlook remains positive, indicating a substantial market opportunity for established players and new entrants. The competitive landscape is dynamic, with both major international corporations and smaller specialized companies vying for market share. Ongoing innovation in drilling fluid technology, focused on enhanced performance and sustainability, is expected to further drive market growth.
Despite potential restraints from environmental regulations and price volatility, the strong demand for energy, coupled with technological advancements in drilling fluid formulations (e.g., environmentally friendly options), positions the US onshore drilling fluid market for continued expansion. The increasing adoption of horizontal and directional drilling techniques, requiring specialized drilling fluids, presents significant growth opportunities. Furthermore, the ongoing focus on improving drilling efficiency and reducing non-productive time (NPT) creates a demand for higher-performance drilling fluids. Regional variations in drilling activity will impact market penetration, with regions experiencing high exploration activity seeing more substantial growth. Consolidation within the industry is also expected as companies seek to expand their market reach and technological capabilities.

Unlock Growth Opportunities in the USA Onshore Drilling Fluid Industry: A Comprehensive Market Report (2019-2033)
This comprehensive report provides an in-depth analysis of the USA Onshore Drilling Fluid Industry, offering invaluable insights for stakeholders seeking to navigate this dynamic market. Covering the period 2019-2033, with a focus on 2025, this report unveils key trends, challenges, and opportunities shaping the industry's future. The report leverages extensive data analysis and expert insights to deliver actionable intelligence for strategic decision-making. The total market size in 2025 is estimated at $XX Million, projecting a CAGR of XX% from 2025 to 2033.
USA Onshore Drilling Fluid Industry Market Dynamics & Concentration
The USA onshore drilling fluid market is characterized by a moderately concentrated landscape, with a few major players holding significant market share. The market share of the top 5 companies is estimated at approximately 60% in 2025. Innovation is a key driver, with companies continuously developing environmentally friendly and high-performance drilling fluids. Stringent environmental regulations, particularly concerning wastewater disposal and the use of hazardous chemicals, significantly impact market dynamics. Substitute products, such as alternative drilling fluids based on water-based or synthetic polymers, are gaining traction, posing a moderate threat to conventional oil-based muds. End-user trends towards sustainability and efficiency are driving demand for improved drilling fluid technology. The period 2019-2024 witnessed approximately XX M&A deals, indicating a moderate level of consolidation in the sector.
- Market Concentration: Top 5 players hold ~60% market share (2025).
- Innovation Drivers: Development of environmentally friendly and high-performance fluids.
- Regulatory Framework: Stringent environmental regulations impacting product selection.
- Product Substitutes: Growth in water-based and synthetic polymer fluids.
- End-User Trends: Increasing demand for sustainable and efficient drilling solutions.
- M&A Activity: Approximately XX M&A deals occurred between 2019 and 2024.
USA Onshore Drilling Fluid Industry Industry Trends & Analysis
The USA onshore drilling fluid market is experiencing robust growth, driven primarily by increasing onshore oil and gas exploration and production activities. Technological advancements, such as the development of high-performance drilling fluids and improved drilling techniques, are enhancing efficiency and reducing operational costs. The market is witnessing a shift towards environmentally friendly drilling fluids, driven by stricter environmental regulations and a growing focus on sustainability. The rising demand for shale gas and oil extraction from unconventional reservoirs is further fueling market growth. Competitive dynamics are intense, with leading companies focusing on product innovation, technological advancements, and strategic partnerships to maintain market share. Market penetration of advanced drilling fluids is estimated at XX% in 2025, with projected growth to XX% by 2033.

Leading Markets & Segments in USA Onshore Drilling Fluid Industry
The Permian Basin remains the dominant region for onshore drilling fluid consumption in the USA, driven by robust oil and gas production activities and extensive shale gas reserves. The key drivers for this dominance include favorable geological conditions, substantial investment in infrastructure, and supportive government policies promoting energy exploration and production. Other significant regions include the Eagle Ford Shale and the Bakken Shale formations.
- Key Drivers in the Permian Basin:
- Abundant shale gas and oil reserves
- Extensive existing infrastructure
- Supportive government policies and tax incentives
- Significant investments in exploration and production activities
The detailed dominance analysis reveals that the Permian Basin accounts for approximately XX% of the total market share, significantly exceeding other regions due to factors outlined above.
USA Onshore Drilling Fluid Industry Product Developments
Recent product innovations include the development of enhanced oil recovery (EOR) fluids, high-performance water-based muds, and environmentally friendly synthetic-based fluids. These advancements focus on improving drilling efficiency, reducing environmental impact, and enhancing wellbore stability. The emphasis is on developing fluids tailored to specific geological conditions and operational requirements, improving cost-effectiveness and overall performance.
Key Drivers of USA Onshore Drilling Fluid Industry Growth
The growth of the USA onshore drilling fluid industry is propelled by several key factors. Increased exploration and production of shale oil and gas is a primary driver. Advancements in drilling technology and the development of more efficient and environmentally friendly drilling fluids are also contributing to growth. Government policies supporting domestic energy production further stimulate market expansion.
Challenges in the USA Onshore Drilling Fluid Industry Market
The industry faces challenges such as fluctuating oil and gas prices impacting demand. Environmental regulations pose compliance and operational cost pressures. Competition from alternative drilling fluid technologies adds pressure on pricing and innovation. The supply chain disruptions experienced in recent years also negatively impacted production and availability of certain raw materials, resulting in an estimated XX% increase in production costs during 2022.
Emerging Opportunities in USA Onshore Drilling Fluid Industry
Significant opportunities exist in developing and deploying environmentally sustainable drilling fluids. Strategic partnerships with technology providers can unlock innovation and cost efficiencies. Expanding into emerging unconventional oil and gas plays presents significant growth potential.
Leading Players in the USA Onshore Drilling Fluid Industry Sector
- IMDEX LIMITED
- Horizon Mud
- Aes Drilling Fluids
- MEDSERV
- Baker Hughes Company
- Schlumberger Limited
- Newpark Resources Inc
- Weatherford
- National Oilwell Varco
- Francis Drilling Fluids Ltd
- Oleon Americas Inc (Avril Group)
- Q'max Solutions Inc
- Unique Drilling Fluids Inc
- Sunwest Fluids LLC
- McAda Drilling Fluids
- Geo Drilling Fluids Inc
- CES Energy Solutions Corp
*List Not Exhaustive
Key Milestones in USA Onshore Drilling Fluid Industry Industry
- 2020: Increased focus on environmentally friendly fluids.
- 2021: Several mergers and acquisitions consolidate market share.
- 2022: Supply chain disruptions impacting raw material costs and availability.
- 2023: Introduction of several innovative high-performance drilling fluids.
- 2024: New regulations implemented on wastewater disposal from drilling fluids.
Strategic Outlook for USA Onshore Drilling Fluid Industry Market
The future of the USA onshore drilling fluid market looks promising, with continuous growth driven by technological advancements, increased oil and gas production, and ongoing demand for sustainable solutions. Strategic investments in research and development, along with strategic partnerships and mergers and acquisitions, will be key to capturing market share and driving long-term success within the sector.
USA Onshore Drilling Fluid Industry Segmentation
-
1. Additive Type
- 1.1. Protective Chemicals
- 1.2. Fluid Viscosifiers
- 1.3. Weighting Agents
- 1.4. Wetting Agents
- 1.5. Lost Circulation Materials
- 1.6. Thinners
- 1.7. Rheology Modifiers
- 1.8. Surfactants
- 1.9. Alkalinity and pH Control Materials
- 1.10. Shale Stabilizers
- 1.11. Other Additive Types
-
2. Product Type
- 2.1. Oil-based Drilling Fluid
- 2.2. Synthetic-based Drilling Fluid
- 2.3. Water-based Drilling Fluid
-
3. Basin
- 3.1. Permian
- 3.2. Eagle Ford
- 3.3. Niobrara
- 3.4. Bakken
- 3.5. Appalachia
- 3.6. Other Basins
USA Onshore Drilling Fluid Industry Segmentation By Geography
-
1. North America
- 1.1. United States
- 1.2. Canada
- 1.3. Mexico
-
2. South America
- 2.1. Brazil
- 2.2. Argentina
- 2.3. Rest of South America
-
3. Europe
- 3.1. United Kingdom
- 3.2. Germany
- 3.3. France
- 3.4. Italy
- 3.5. Spain
- 3.6. Russia
- 3.7. Benelux
- 3.8. Nordics
- 3.9. Rest of Europe
-
4. Middle East & Africa
- 4.1. Turkey
- 4.2. Israel
- 4.3. GCC
- 4.4. North Africa
- 4.5. South Africa
- 4.6. Rest of Middle East & Africa
-
5. Asia Pacific
- 5.1. China
- 5.2. India
- 5.3. Japan
- 5.4. South Korea
- 5.5. ASEAN
- 5.6. Oceania
- 5.7. Rest of Asia Pacific
USA Onshore Drilling Fluid Industry REPORT HIGHLIGHTS
| Aspects | Details |
|---|---|
| Study Period | 2019-2033 |
| Base Year | 2024 |
| Estimated Year | 2025 |
| Forecast Period | 2025-2033 |
| Historical Period | 2019-2024 |
| Growth Rate | CAGR of > 13.00% from 2019-2033 |
| Segmentation |
|
Table of Contents
- 1. Introduction
- 1.1. Research Scope
- 1.2. Market Segmentation
- 1.3. Research Methodology
- 1.4. Definitions and Assumptions
- 2. Executive Summary
- 2.1. Introduction
- 3. Market Dynamics
- 3.1. Introduction
- 3.2. Market Drivers
- 3.2.1. ; Low Breakeven Price and High Crude Oil Price; Increasing Demand for Longer Lateral Length; Continuous Growth in Demand from Permian Basin
- 3.3. Market Restrains
- 3.3.1. ; Low Breakeven Price and High Crude Oil Price; Increasing Demand for Longer Lateral Length; Continuous Growth in Demand from Permian Basin
- 3.4. Market Trends
- 3.4.1. Continuous Growth in Demand from Permian Basin
- 4. Market Factor Analysis
- 4.1. Porters Five Forces
- 4.2. Supply/Value Chain
- 4.3. PESTEL analysis
- 4.4. Market Entropy
- 4.5. Patent/Trademark Analysis
- 5. Global USA Onshore Drilling Fluid Industry Analysis, Insights and Forecast, 2019-2031
- 5.1. Market Analysis, Insights and Forecast - by Additive Type
- 5.1.1. Protective Chemicals
- 5.1.2. Fluid Viscosifiers
- 5.1.3. Weighting Agents
- 5.1.4. Wetting Agents
- 5.1.5. Lost Circulation Materials
- 5.1.6. Thinners
- 5.1.7. Rheology Modifiers
- 5.1.8. Surfactants
- 5.1.9. Alkalinity and pH Control Materials
- 5.1.10. Shale Stabilizers
- 5.1.11. Other Additive Types
- 5.2. Market Analysis, Insights and Forecast - by Product Type
- 5.2.1. Oil-based Drilling Fluid
- 5.2.2. Synthetic-based Drilling Fluid
- 5.2.3. Water-based Drilling Fluid
- 5.3. Market Analysis, Insights and Forecast - by Basin
- 5.3.1. Permian
- 5.3.2. Eagle Ford
- 5.3.3. Niobrara
- 5.3.4. Bakken
- 5.3.5. Appalachia
- 5.3.6. Other Basins
- 5.4. Market Analysis, Insights and Forecast - by Region
- 5.4.1. North America
- 5.4.2. South America
- 5.4.3. Europe
- 5.4.4. Middle East & Africa
- 5.4.5. Asia Pacific
- 5.1. Market Analysis, Insights and Forecast - by Additive Type
- 6. North America USA Onshore Drilling Fluid Industry Analysis, Insights and Forecast, 2019-2031
- 6.1. Market Analysis, Insights and Forecast - by Additive Type
- 6.1.1. Protective Chemicals
- 6.1.2. Fluid Viscosifiers
- 6.1.3. Weighting Agents
- 6.1.4. Wetting Agents
- 6.1.5. Lost Circulation Materials
- 6.1.6. Thinners
- 6.1.7. Rheology Modifiers
- 6.1.8. Surfactants
- 6.1.9. Alkalinity and pH Control Materials
- 6.1.10. Shale Stabilizers
- 6.1.11. Other Additive Types
- 6.2. Market Analysis, Insights and Forecast - by Product Type
- 6.2.1. Oil-based Drilling Fluid
- 6.2.2. Synthetic-based Drilling Fluid
- 6.2.3. Water-based Drilling Fluid
- 6.3. Market Analysis, Insights and Forecast - by Basin
- 6.3.1. Permian
- 6.3.2. Eagle Ford
- 6.3.3. Niobrara
- 6.3.4. Bakken
- 6.3.5. Appalachia
- 6.3.6. Other Basins
- 6.1. Market Analysis, Insights and Forecast - by Additive Type
- 7. South America USA Onshore Drilling Fluid Industry Analysis, Insights and Forecast, 2019-2031
- 7.1. Market Analysis, Insights and Forecast - by Additive Type
- 7.1.1. Protective Chemicals
- 7.1.2. Fluid Viscosifiers
- 7.1.3. Weighting Agents
- 7.1.4. Wetting Agents
- 7.1.5. Lost Circulation Materials
- 7.1.6. Thinners
- 7.1.7. Rheology Modifiers
- 7.1.8. Surfactants
- 7.1.9. Alkalinity and pH Control Materials
- 7.1.10. Shale Stabilizers
- 7.1.11. Other Additive Types
- 7.2. Market Analysis, Insights and Forecast - by Product Type
- 7.2.1. Oil-based Drilling Fluid
- 7.2.2. Synthetic-based Drilling Fluid
- 7.2.3. Water-based Drilling Fluid
- 7.3. Market Analysis, Insights and Forecast - by Basin
- 7.3.1. Permian
- 7.3.2. Eagle Ford
- 7.3.3. Niobrara
- 7.3.4. Bakken
- 7.3.5. Appalachia
- 7.3.6. Other Basins
- 7.1. Market Analysis, Insights and Forecast - by Additive Type
- 8. Europe USA Onshore Drilling Fluid Industry Analysis, Insights and Forecast, 2019-2031
- 8.1. Market Analysis, Insights and Forecast - by Additive Type
- 8.1.1. Protective Chemicals
- 8.1.2. Fluid Viscosifiers
- 8.1.3. Weighting Agents
- 8.1.4. Wetting Agents
- 8.1.5. Lost Circulation Materials
- 8.1.6. Thinners
- 8.1.7. Rheology Modifiers
- 8.1.8. Surfactants
- 8.1.9. Alkalinity and pH Control Materials
- 8.1.10. Shale Stabilizers
- 8.1.11. Other Additive Types
- 8.2. Market Analysis, Insights and Forecast - by Product Type
- 8.2.1. Oil-based Drilling Fluid
- 8.2.2. Synthetic-based Drilling Fluid
- 8.2.3. Water-based Drilling Fluid
- 8.3. Market Analysis, Insights and Forecast - by Basin
- 8.3.1. Permian
- 8.3.2. Eagle Ford
- 8.3.3. Niobrara
- 8.3.4. Bakken
- 8.3.5. Appalachia
- 8.3.6. Other Basins
- 8.1. Market Analysis, Insights and Forecast - by Additive Type
- 9. Middle East & Africa USA Onshore Drilling Fluid Industry Analysis, Insights and Forecast, 2019-2031
- 9.1. Market Analysis, Insights and Forecast - by Additive Type
- 9.1.1. Protective Chemicals
- 9.1.2. Fluid Viscosifiers
- 9.1.3. Weighting Agents
- 9.1.4. Wetting Agents
- 9.1.5. Lost Circulation Materials
- 9.1.6. Thinners
- 9.1.7. Rheology Modifiers
- 9.1.8. Surfactants
- 9.1.9. Alkalinity and pH Control Materials
- 9.1.10. Shale Stabilizers
- 9.1.11. Other Additive Types
- 9.2. Market Analysis, Insights and Forecast - by Product Type
- 9.2.1. Oil-based Drilling Fluid
- 9.2.2. Synthetic-based Drilling Fluid
- 9.2.3. Water-based Drilling Fluid
- 9.3. Market Analysis, Insights and Forecast - by Basin
- 9.3.1. Permian
- 9.3.2. Eagle Ford
- 9.3.3. Niobrara
- 9.3.4. Bakken
- 9.3.5. Appalachia
- 9.3.6. Other Basins
- 9.1. Market Analysis, Insights and Forecast - by Additive Type
- 10. Asia Pacific USA Onshore Drilling Fluid Industry Analysis, Insights and Forecast, 2019-2031
- 10.1. Market Analysis, Insights and Forecast - by Additive Type
- 10.1.1. Protective Chemicals
- 10.1.2. Fluid Viscosifiers
- 10.1.3. Weighting Agents
- 10.1.4. Wetting Agents
- 10.1.5. Lost Circulation Materials
- 10.1.6. Thinners
- 10.1.7. Rheology Modifiers
- 10.1.8. Surfactants
- 10.1.9. Alkalinity and pH Control Materials
- 10.1.10. Shale Stabilizers
- 10.1.11. Other Additive Types
- 10.2. Market Analysis, Insights and Forecast - by Product Type
- 10.2.1. Oil-based Drilling Fluid
- 10.2.2. Synthetic-based Drilling Fluid
- 10.2.3. Water-based Drilling Fluid
- 10.3. Market Analysis, Insights and Forecast - by Basin
- 10.3.1. Permian
- 10.3.2. Eagle Ford
- 10.3.3. Niobrara
- 10.3.4. Bakken
- 10.3.5. Appalachia
- 10.3.6. Other Basins
- 10.1. Market Analysis, Insights and Forecast - by Additive Type
- 11. Competitive Analysis
- 11.1. Global Market Share Analysis 2024
- 11.2. Company Profiles
- 11.2.1 IMDEX LIMITED
- 11.2.1.1. Overview
- 11.2.1.2. Products
- 11.2.1.3. SWOT Analysis
- 11.2.1.4. Recent Developments
- 11.2.1.5. Financials (Based on Availability)
- 11.2.2 Horizon Mud
- 11.2.2.1. Overview
- 11.2.2.2. Products
- 11.2.2.3. SWOT Analysis
- 11.2.2.4. Recent Developments
- 11.2.2.5. Financials (Based on Availability)
- 11.2.3 Aes Drilling Fluids
- 11.2.3.1. Overview
- 11.2.3.2. Products
- 11.2.3.3. SWOT Analysis
- 11.2.3.4. Recent Developments
- 11.2.3.5. Financials (Based on Availability)
- 11.2.4 MEDSERV
- 11.2.4.1. Overview
- 11.2.4.2. Products
- 11.2.4.3. SWOT Analysis
- 11.2.4.4. Recent Developments
- 11.2.4.5. Financials (Based on Availability)
- 11.2.5 Baker Hughes Company
- 11.2.5.1. Overview
- 11.2.5.2. Products
- 11.2.5.3. SWOT Analysis
- 11.2.5.4. Recent Developments
- 11.2.5.5. Financials (Based on Availability)
- 11.2.6 Schlumberger Limited
- 11.2.6.1. Overview
- 11.2.6.2. Products
- 11.2.6.3. SWOT Analysis
- 11.2.6.4. Recent Developments
- 11.2.6.5. Financials (Based on Availability)
- 11.2.7 Newpark Resources Inc
- 11.2.7.1. Overview
- 11.2.7.2. Products
- 11.2.7.3. SWOT Analysis
- 11.2.7.4. Recent Developments
- 11.2.7.5. Financials (Based on Availability)
- 11.2.8 Weatherford
- 11.2.8.1. Overview
- 11.2.8.2. Products
- 11.2.8.3. SWOT Analysis
- 11.2.8.4. Recent Developments
- 11.2.8.5. Financials (Based on Availability)
- 11.2.9 National Oilwell Varco
- 11.2.9.1. Overview
- 11.2.9.2. Products
- 11.2.9.3. SWOT Analysis
- 11.2.9.4. Recent Developments
- 11.2.9.5. Financials (Based on Availability)
- 11.2.10 Francis Drilling Fluids Ltd
- 11.2.10.1. Overview
- 11.2.10.2. Products
- 11.2.10.3. SWOT Analysis
- 11.2.10.4. Recent Developments
- 11.2.10.5. Financials (Based on Availability)
- 11.2.11 Oleon Americas Inc (Avril Group)
- 11.2.11.1. Overview
- 11.2.11.2. Products
- 11.2.11.3. SWOT Analysis
- 11.2.11.4. Recent Developments
- 11.2.11.5. Financials (Based on Availability)
- 11.2.12 Q'max Solutions Inc
- 11.2.12.1. Overview
- 11.2.12.2. Products
- 11.2.12.3. SWOT Analysis
- 11.2.12.4. Recent Developments
- 11.2.12.5. Financials (Based on Availability)
- 11.2.13 Unique Drilling Fluids Inc
- 11.2.13.1. Overview
- 11.2.13.2. Products
- 11.2.13.3. SWOT Analysis
- 11.2.13.4. Recent Developments
- 11.2.13.5. Financials (Based on Availability)
- 11.2.14 Sunwest Fluids LLC
- 11.2.14.1. Overview
- 11.2.14.2. Products
- 11.2.14.3. SWOT Analysis
- 11.2.14.4. Recent Developments
- 11.2.14.5. Financials (Based on Availability)
- 11.2.15 McAda Drilling Fluids
- 11.2.15.1. Overview
- 11.2.15.2. Products
- 11.2.15.3. SWOT Analysis
- 11.2.15.4. Recent Developments
- 11.2.15.5. Financials (Based on Availability)
- 11.2.16 Geo Drilling Fluids Inc
- 11.2.16.1. Overview
- 11.2.16.2. Products
- 11.2.16.3. SWOT Analysis
- 11.2.16.4. Recent Developments
- 11.2.16.5. Financials (Based on Availability)
- 11.2.17 CES Energy Solutions Corp *List Not Exhaustive
- 11.2.17.1. Overview
- 11.2.17.2. Products
- 11.2.17.3. SWOT Analysis
- 11.2.17.4. Recent Developments
- 11.2.17.5. Financials (Based on Availability)
- 11.2.1 IMDEX LIMITED
List of Figures
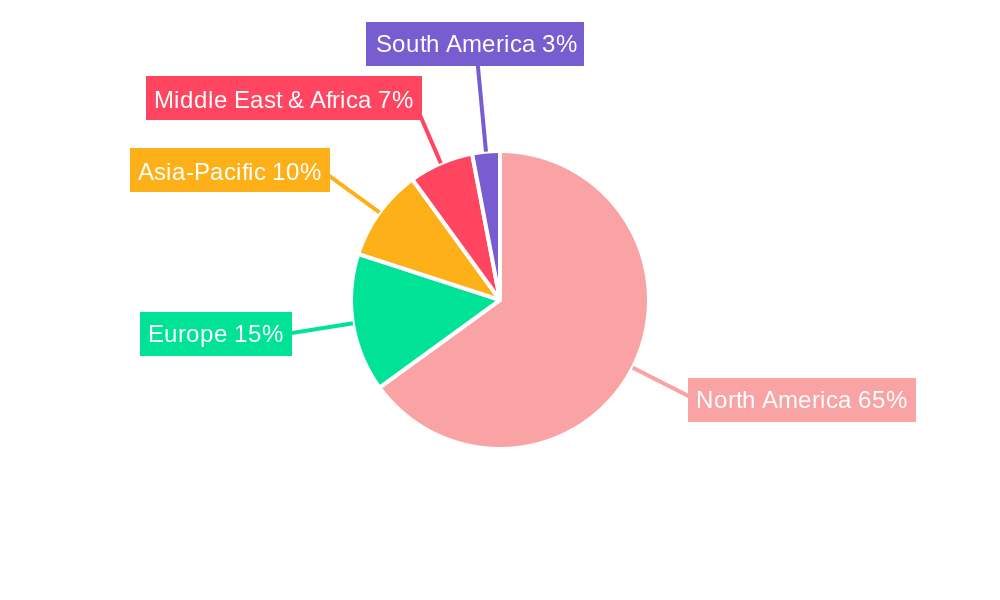
- Figure 1: Global USA Onshore Drilling Fluid Industry Revenue Breakdown (Million, %) by Region 2024 & 2032
- Figure 2: North America USA Onshore Drilling Fluid Industry Revenue (Million), by Additive Type 2024 & 2032
- Figure 3: North America USA Onshore Drilling Fluid Industry Revenue Share (%), by Additive Type 2024 & 2032
- Figure 4: North America USA Onshore Drilling Fluid Industry Revenue (Million), by Product Type 2024 & 2032
- Figure 5: North America USA Onshore Drilling Fluid Industry Revenue Share (%), by Product Type 2024 & 2032
- Figure 6: North America USA Onshore Drilling Fluid Industry Revenue (Million), by Basin 2024 & 2032
- Figure 7: North America USA Onshore Drilling Fluid Industry Revenue Share (%), by Basin 2024 & 2032
- Figure 8: North America USA Onshore Drilling Fluid Industry Revenue (Million), by Country 2024 & 2032
- Figure 9: North America USA Onshore Drilling Fluid Industry Revenue Share (%), by Country 2024 & 2032
- Figure 10: South America USA Onshore Drilling Fluid Industry Revenue (Million), by Additive Type 2024 & 2032
- Figure 11: South America USA Onshore Drilling Fluid Industry Revenue Share (%), by Additive Type 2024 & 2032
- Figure 12: South America USA Onshore Drilling Fluid Industry Revenue (Million), by Product Type 2024 & 2032
- Figure 13: South America USA Onshore Drilling Fluid Industry Revenue Share (%), by Product Type 2024 & 2032
- Figure 14: South America USA Onshore Drilling Fluid Industry Revenue (Million), by Basin 2024 & 2032
- Figure 15: South America USA Onshore Drilling Fluid Industry Revenue Share (%), by Basin 2024 & 2032
- Figure 16: South America USA Onshore Drilling Fluid Industry Revenue (Million), by Country 2024 & 2032
- Figure 17: South America USA Onshore Drilling Fluid Industry Revenue Share (%), by Country 2024 & 2032
- Figure 18: Europe USA Onshore Drilling Fluid Industry Revenue (Million), by Additive Type 2024 & 2032
- Figure 19: Europe USA Onshore Drilling Fluid Industry Revenue Share (%), by Additive Type 2024 & 2032
- Figure 20: Europe USA Onshore Drilling Fluid Industry Revenue (Million), by Product Type 2024 & 2032
- Figure 21: Europe USA Onshore Drilling Fluid Industry Revenue Share (%), by Product Type 2024 & 2032
- Figure 22: Europe USA Onshore Drilling Fluid Industry Revenue (Million), by Basin 2024 & 2032
- Figure 23: Europe USA Onshore Drilling Fluid Industry Revenue Share (%), by Basin 2024 & 2032
- Figure 24: Europe USA Onshore Drilling Fluid Industry Revenue (Million), by Country 2024 & 2032
- Figure 25: Europe USA Onshore Drilling Fluid Industry Revenue Share (%), by Country 2024 & 2032
- Figure 26: Middle East & Africa USA Onshore Drilling Fluid Industry Revenue (Million), by Additive Type 2024 & 2032
- Figure 27: Middle East & Africa USA Onshore Drilling Fluid Industry Revenue Share (%), by Additive Type 2024 & 2032
- Figure 28: Middle East & Africa USA Onshore Drilling Fluid Industry Revenue (Million), by Product Type 2024 & 2032
- Figure 29: Middle East & Africa USA Onshore Drilling Fluid Industry Revenue Share (%), by Product Type 2024 & 2032
- Figure 30: Middle East & Africa USA Onshore Drilling Fluid Industry Revenue (Million), by Basin 2024 & 2032
- Figure 31: Middle East & Africa USA Onshore Drilling Fluid Industry Revenue Share (%), by Basin 2024 & 2032
- Figure 32: Middle East & Africa USA Onshore Drilling Fluid Industry Revenue (Million), by Country 2024 & 2032
- Figure 33: Middle East & Africa USA Onshore Drilling Fluid Industry Revenue Share (%), by Country 2024 & 2032
- Figure 34: Asia Pacific USA Onshore Drilling Fluid Industry Revenue (Million), by Additive Type 2024 & 2032
- Figure 35: Asia Pacific USA Onshore Drilling Fluid Industry Revenue Share (%), by Additive Type 2024 & 2032
- Figure 36: Asia Pacific USA Onshore Drilling Fluid Industry Revenue (Million), by Product Type 2024 & 2032
- Figure 37: Asia Pacific USA Onshore Drilling Fluid Industry Revenue Share (%), by Product Type 2024 & 2032
- Figure 38: Asia Pacific USA Onshore Drilling Fluid Industry Revenue (Million), by Basin 2024 & 2032
- Figure 39: Asia Pacific USA Onshore Drilling Fluid Industry Revenue Share (%), by Basin 2024 & 2032
- Figure 40: Asia Pacific USA Onshore Drilling Fluid Industry Revenue (Million), by Country 2024 & 2032
- Figure 41: Asia Pacific USA Onshore Drilling Fluid Industry Revenue Share (%), by Country 2024 & 2032
List of Tables
- Table 1: Global USA Onshore Drilling Fluid Industry Revenue Million Forecast, by Region 2019 & 2032
- Table 2: Global USA Onshore Drilling Fluid Industry Revenue Million Forecast, by Additive Type 2019 & 2032
- Table 3: Global USA Onshore Drilling Fluid Industry Revenue Million Forecast, by Product Type 2019 & 2032
- Table 4: Global USA Onshore Drilling Fluid Industry Revenue Million Forecast, by Basin 2019 & 2032
- Table 5: Global USA Onshore Drilling Fluid Industry Revenue Million Forecast, by Region 2019 & 2032
- Table 6: Global USA Onshore Drilling Fluid Industry Revenue Million Forecast, by Additive Type 2019 & 2032
- Table 7: Global USA Onshore Drilling Fluid Industry Revenue Million Forecast, by Product Type 2019 & 2032
- Table 8: Global USA Onshore Drilling Fluid Industry Revenue Million Forecast, by Basin 2019 & 2032
- Table 9: Global USA Onshore Drilling Fluid Industry Revenue Million Forecast, by Country 2019 & 2032
- Table 10: United States USA Onshore Drilling Fluid Industry Revenue (Million) Forecast, by Application 2019 & 2032
- Table 11: Canada USA Onshore Drilling Fluid Industry Revenue (Million) Forecast, by Application 2019 & 2032
- Table 12: Mexico USA Onshore Drilling Fluid Industry Revenue (Million) Forecast, by Application 2019 & 2032
- Table 13: Global USA Onshore Drilling Fluid Industry Revenue Million Forecast, by Additive Type 2019 & 2032
- Table 14: Global USA Onshore Drilling Fluid Industry Revenue Million Forecast, by Product Type 2019 & 2032
- Table 15: Global USA Onshore Drilling Fluid Industry Revenue Million Forecast, by Basin 2019 & 2032
- Table 16: Global USA Onshore Drilling Fluid Industry Revenue Million Forecast, by Country 2019 & 2032
- Table 17: Brazil USA Onshore Drilling Fluid Industry Revenue (Million) Forecast, by Application 2019 & 2032
- Table 18: Argentina USA Onshore Drilling Fluid Industry Revenue (Million) Forecast, by Application 2019 & 2032
- Table 19: Rest of South America USA Onshore Drilling Fluid Industry Revenue (Million) Forecast, by Application 2019 & 2032
- Table 20: Global USA Onshore Drilling Fluid Industry Revenue Million Forecast, by Additive Type 2019 & 2032
- Table 21: Global USA Onshore Drilling Fluid Industry Revenue Million Forecast, by Product Type 2019 & 2032
- Table 22: Global USA Onshore Drilling Fluid Industry Revenue Million Forecast, by Basin 2019 & 2032
- Table 23: Global USA Onshore Drilling Fluid Industry Revenue Million Forecast, by Country 2019 & 2032
- Table 24: United Kingdom USA Onshore Drilling Fluid Industry Revenue (Million) Forecast, by Application 2019 & 2032
- Table 25: Germany USA Onshore Drilling Fluid Industry Revenue (Million) Forecast, by Application 2019 & 2032
- Table 26: France USA Onshore Drilling Fluid Industry Revenue (Million) Forecast, by Application 2019 & 2032
- Table 27: Italy USA Onshore Drilling Fluid Industry Revenue (Million) Forecast, by Application 2019 & 2032
- Table 28: Spain USA Onshore Drilling Fluid Industry Revenue (Million) Forecast, by Application 2019 & 2032
- Table 29: Russia USA Onshore Drilling Fluid Industry Revenue (Million) Forecast, by Application 2019 & 2032
- Table 30: Benelux USA Onshore Drilling Fluid Industry Revenue (Million) Forecast, by Application 2019 & 2032
- Table 31: Nordics USA Onshore Drilling Fluid Industry Revenue (Million) Forecast, by Application 2019 & 2032
- Table 32: Rest of Europe USA Onshore Drilling Fluid Industry Revenue (Million) Forecast, by Application 2019 & 2032
- Table 33: Global USA Onshore Drilling Fluid Industry Revenue Million Forecast, by Additive Type 2019 & 2032
- Table 34: Global USA Onshore Drilling Fluid Industry Revenue Million Forecast, by Product Type 2019 & 2032
- Table 35: Global USA Onshore Drilling Fluid Industry Revenue Million Forecast, by Basin 2019 & 2032
- Table 36: Global USA Onshore Drilling Fluid Industry Revenue Million Forecast, by Country 2019 & 2032
- Table 37: Turkey USA Onshore Drilling Fluid Industry Revenue (Million) Forecast, by Application 2019 & 2032
- Table 38: Israel USA Onshore Drilling Fluid Industry Revenue (Million) Forecast, by Application 2019 & 2032
- Table 39: GCC USA Onshore Drilling Fluid Industry Revenue (Million) Forecast, by Application 2019 & 2032
- Table 40: North Africa USA Onshore Drilling Fluid Industry Revenue (Million) Forecast, by Application 2019 & 2032
- Table 41: South Africa USA Onshore Drilling Fluid Industry Revenue (Million) Forecast, by Application 2019 & 2032
- Table 42: Rest of Middle East & Africa USA Onshore Drilling Fluid Industry Revenue (Million) Forecast, by Application 2019 & 2032
- Table 43: Global USA Onshore Drilling Fluid Industry Revenue Million Forecast, by Additive Type 2019 & 2032
- Table 44: Global USA Onshore Drilling Fluid Industry Revenue Million Forecast, by Product Type 2019 & 2032
- Table 45: Global USA Onshore Drilling Fluid Industry Revenue Million Forecast, by Basin 2019 & 2032
- Table 46: Global USA Onshore Drilling Fluid Industry Revenue Million Forecast, by Country 2019 & 2032
- Table 47: China USA Onshore Drilling Fluid Industry Revenue (Million) Forecast, by Application 2019 & 2032
- Table 48: India USA Onshore Drilling Fluid Industry Revenue (Million) Forecast, by Application 2019 & 2032
- Table 49: Japan USA Onshore Drilling Fluid Industry Revenue (Million) Forecast, by Application 2019 & 2032
- Table 50: South Korea USA Onshore Drilling Fluid Industry Revenue (Million) Forecast, by Application 2019 & 2032
- Table 51: ASEAN USA Onshore Drilling Fluid Industry Revenue (Million) Forecast, by Application 2019 & 2032
- Table 52: Oceania USA Onshore Drilling Fluid Industry Revenue (Million) Forecast, by Application 2019 & 2032
- Table 53: Rest of Asia Pacific USA Onshore Drilling Fluid Industry Revenue (Million) Forecast, by Application 2019 & 2032
Frequently Asked Questions
1. What is the projected Compound Annual Growth Rate (CAGR) of the USA Onshore Drilling Fluid Industry?
The projected CAGR is approximately > 13.00%.
2. Which companies are prominent players in the USA Onshore Drilling Fluid Industry?
Key companies in the market include IMDEX LIMITED, Horizon Mud, Aes Drilling Fluids, MEDSERV, Baker Hughes Company, Schlumberger Limited, Newpark Resources Inc, Weatherford, National Oilwell Varco, Francis Drilling Fluids Ltd, Oleon Americas Inc (Avril Group), Q'max Solutions Inc, Unique Drilling Fluids Inc, Sunwest Fluids LLC, McAda Drilling Fluids, Geo Drilling Fluids Inc, CES Energy Solutions Corp *List Not Exhaustive.
3. What are the main segments of the USA Onshore Drilling Fluid Industry?
The market segments include Additive Type, Product Type, Basin.
4. Can you provide details about the market size?
The market size is estimated to be USD XX Million as of 2022.
5. What are some drivers contributing to market growth?
; Low Breakeven Price and High Crude Oil Price; Increasing Demand for Longer Lateral Length; Continuous Growth in Demand from Permian Basin.
6. What are the notable trends driving market growth?
Continuous Growth in Demand from Permian Basin.
7. Are there any restraints impacting market growth?
; Low Breakeven Price and High Crude Oil Price; Increasing Demand for Longer Lateral Length; Continuous Growth in Demand from Permian Basin.
8. Can you provide examples of recent developments in the market?
N/A
9. What pricing options are available for accessing the report?
Pricing options include single-user, multi-user, and enterprise licenses priced at USD 3800, USD 4500, and USD 5800 respectively.
10. Is the market size provided in terms of value or volume?
The market size is provided in terms of value, measured in Million.
11. Are there any specific market keywords associated with the report?
Yes, the market keyword associated with the report is "USA Onshore Drilling Fluid Industry," which aids in identifying and referencing the specific market segment covered.
12. How do I determine which pricing option suits my needs best?
The pricing options vary based on user requirements and access needs. Individual users may opt for single-user licenses, while businesses requiring broader access may choose multi-user or enterprise licenses for cost-effective access to the report.
13. Are there any additional resources or data provided in the USA Onshore Drilling Fluid Industry report?
While the report offers comprehensive insights, it's advisable to review the specific contents or supplementary materials provided to ascertain if additional resources or data are available.
14. How can I stay updated on further developments or reports in the USA Onshore Drilling Fluid Industry?
To stay informed about further developments, trends, and reports in the USA Onshore Drilling Fluid Industry, consider subscribing to industry newsletters, following relevant companies and organizations, or regularly checking reputable industry news sources and publications.
Methodology
Step 1 - Identification of Relevant Samples Size from Population Database


Step 2 - Approaches for Defining Global Market Size (Value, Volume* & Price*)

Note*: In applicable scenarios
Step 3 - Data Sources
Primary Research
- Web Analytics
- Survey Reports
- Research Institute
- Latest Research Reports
- Opinion Leaders
Secondary Research
- Annual Reports
- White Paper
- Latest Press Release
- Industry Association
- Paid Database
- Investor Presentations

Step 4 - Data Triangulation
Involves using different sources of information in order to increase the validity of a study
These sources are likely to be stakeholders in a program - participants, other researchers, program staff, other community members, and so on.
Then we put all data in single framework & apply various statistical tools to find out the dynamic on the market.
During the analysis stage, feedback from the stakeholder groups would be compared to determine areas of agreement as well as areas of divergence
