

Key Insights
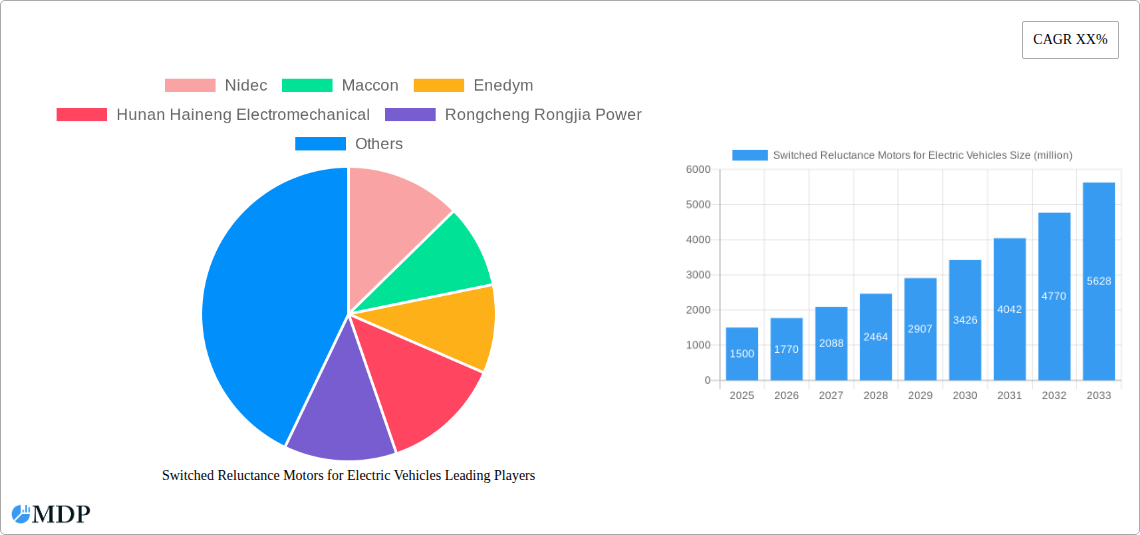
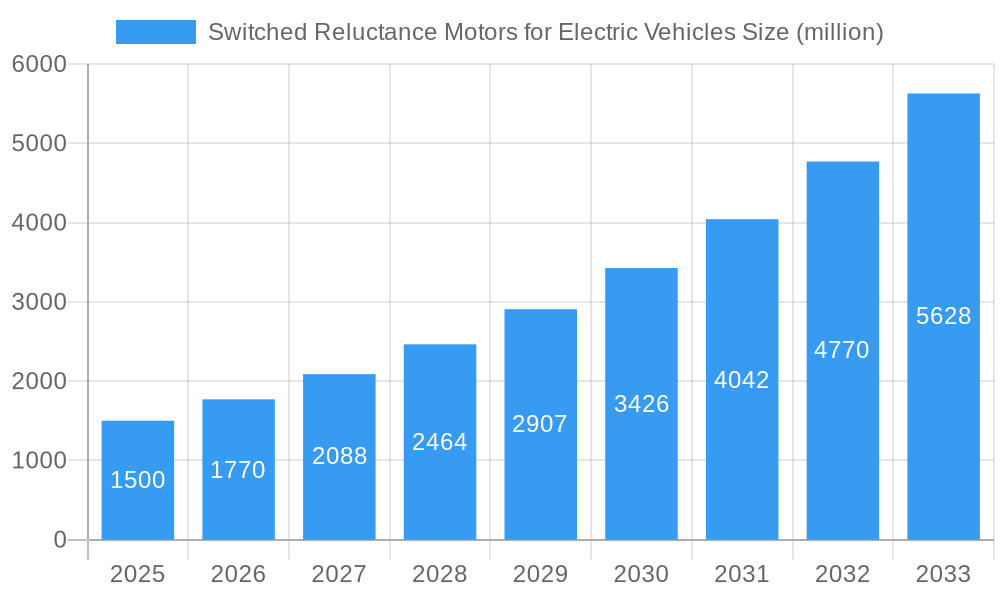
The Switched Reluctance Motors (SRM) market for Electric Vehicles (EVs) is experiencing robust growth, projected to reach an estimated market size of approximately USD 1.5 billion by 2025, with a significant Compound Annual Growth Rate (CAGR) of around 18% through 2033. This surge is primarily driven by the escalating adoption of electric vehicles globally, fueled by stringent government regulations aimed at reducing emissions and increasing consumer demand for sustainable transportation. The inherent advantages of SRMs, such as their simple and rugged construction, higher torque density, superior efficiency across a wider speed range, and excellent fault tolerance, make them increasingly attractive alternatives to traditional permanent magnet synchronous motors (PMSM) in EV powertrains. The aftermarket segment is also poised for substantial expansion as EVs in operation require maintenance and potential upgrades, further bolstering the overall market trajectory.
Switched Reluctance Motors for Electric Vehicles Market Size (In Billion)
Key trends shaping the SRM for EV market include advancements in control algorithms, which are crucial for mitigating torque ripple and noise, thereby enhancing the driving experience. Manufacturers are heavily investing in R&D to optimize SRM performance and reduce manufacturing costs, making them more competitive. The development of advanced power electronics and miniaturization of SRM components are also contributing to their wider integration. However, challenges remain, including the historical perception of SRMs being noisier and exhibiting more torque ripple compared to PMSMs, though technological advancements are rapidly addressing these issues. The dependency on specialized manufacturing processes and the need for skilled engineering talent to develop and implement sophisticated control strategies also present some market restraints. Despite these, the strong underlying demand for efficient and cost-effective EV powertrains positions the SRM market for sustained and significant growth.
Switched Reluctance Motors for Electric Vehicles Company Market Share
Switched Reluctance Motors for Electric Vehicles Market Insights: Comprehensive Analysis and Future Outlook
This in-depth report provides a meticulous examination of the global Switched Reluctance Motors (SRMs) for Electric Vehicles market, forecasting substantial growth and highlighting critical industry dynamics. Spanning a comprehensive Study Period from 2019 to 2033, with a Base Year of 2025 and a Forecast Period of 2025–2033, this analysis delves into the technological advancements, market penetration, and strategic imperatives shaping the electric vehicle powertrain landscape.
Switched Reluctance Motors for Electric Vehicles Market Dynamics & Concentration
The Switched Reluctance Motors for Electric Vehicles market exhibits a dynamic and evolving concentration, driven by continuous innovation and a burgeoning demand for efficient EV powertrains. Key drivers include advancements in power electronics, sensorless control algorithms, and material science, enabling higher torque density and improved efficiency. Regulatory frameworks promoting zero-emission vehicles worldwide are a significant catalyst, pushing OEMs towards adopting SRM technology for its inherent robustness and cost-effectiveness. However, the market also faces challenges from established technologies like Permanent Magnet Synchronous Motors (PMSMs), which currently dominate market share, estimated to be around 65% in 2025. Product substitutes, while present, are increasingly being outpaced by the performance improvements in SRMs. End-user trends, particularly the consumer demand for longer range, faster charging, and lower overall vehicle cost, directly influence the adoption of SRM technology. Mergers and Acquisitions (M&A) activities are expected to increase, with an estimated XX M&A deals in the historical period (2019-2024) and projected XX deals in the forecast period (2025-2033), as larger players seek to integrate SRM expertise and manufacturing capabilities. Market concentration is moderate, with several key players vying for market share, expected to reach XX% by 2033.
Switched Reluctance Motors for Electric Vehicles Industry Trends & Analysis
The Switched Reluctance Motors for Electric Vehicles industry is poised for remarkable expansion, projected to grow at a Compound Annual Growth Rate (CAGR) of xx% from 2025 to 2033. This robust growth is fueled by several critical trends. Technological disruptions are at the forefront, with ongoing research and development in advanced control strategies, reducing torque ripple and acoustic noise, historically a major drawback for SRMs. Innovations in high-performance materials for stators and rotors, alongside more efficient power electronics and sophisticated sensorless control systems, are significantly enhancing SRM performance, making them highly competitive against traditional EV motor types. Consumer preferences are increasingly aligning with the advantages offered by SRMs, such as their inherent reliability due to the absence of permanent magnets, their ability to operate efficiently across a wide speed range, and their potential for lower manufacturing costs, especially in mass production scenarios. The market penetration of SRMs in the EV sector, currently estimated at xx% in 2025, is anticipated to surge to xx% by 2033 as these technological advancements mature and gain broader OEM acceptance. Competitive dynamics are intensifying, with established automotive suppliers and innovative startups investing heavily in SRM development. The rising global sales of electric vehicles, projected to exceed xx million units in 2025 and xx million units by 2033, directly translates into a significantly larger addressable market for SRM technology. Furthermore, the increasing focus on supply chain resilience and the reduction of reliance on rare-earth materials are further bolstering the appeal of SRM technology, positioning it as a key enabler of sustainable electric mobility.
Leading Markets & Segments in Switched Reluctance Motors for Electric Vehicles
The OEM segment within the Switched Reluctance Motors for Electric Vehicles market is anticipated to be the dominant force, capturing an estimated xx% of the market share in 2025 and projected to grow to xx% by 2033. This dominance is driven by the direct integration of SRM technology into new electric vehicle models by major automotive manufacturers. The Aftermarket segment, while smaller, is expected to witness significant growth as older EVs are retrofitted or repaired, with its market share projected to increase from xx% in 2025 to xx% by 2033. Geographically, North America is anticipated to lead the market, accounting for approximately xx% of global demand in 2025, propelled by stringent emissions regulations and substantial government incentives for EV adoption. Asia-Pacific is forecast to follow closely, driven by the rapid expansion of the EV manufacturing base in countries like China, with an estimated market share of xx% in 2025, projected to reach xx% by 2033. Europe is also a significant market, expected to hold xx% of the market in 2025, benefiting from strong policy support for electric mobility.
Switched Reluctance Motors for Electric Vehicles Product Developments
Product developments in Switched Reluctance Motors for Electric Vehicles are centered on enhancing performance and reducing costs. Innovations include the development of novel rotor and stator pole configurations for improved torque density and efficiency, as well as advanced digital control algorithms that minimize torque ripple and acoustic noise. Companies are also focusing on lightweighting materials and integrated power electronics for compact and efficient motor designs. The competitive advantage of SRMs lies in their inherent fault tolerance, absence of rare-earth magnets, and simplified construction, making them a cost-effective and robust solution for a wide range of EV applications, from passenger cars to commercial vehicles. Technological trends are pushing towards higher power densities and greater energy efficiency to meet the evolving demands of the electric vehicle market.
Key Drivers of Switched Reluctance Motors for Electric Vehicles Growth
The growth of the Switched Reluctance Motors for Electric Vehicles market is propelled by a confluence of technological, economic, and regulatory factors. Technologically, advancements in power electronics, control algorithms, and thermal management are significantly improving SRM performance, making them increasingly competitive with established motor technologies. Economically, the cost-effectiveness of SRMs, particularly their independence from rare-earth magnets which are subject to price volatility and supply chain risks, presents a compelling value proposition for EV manufacturers aiming to reduce vehicle production costs. Regulatory drivers, such as stringent government mandates for zero-emission vehicles and attractive subsidies for EV adoption, create a favorable market environment, indirectly boosting the demand for efficient and cost-effective powertrain components like SRMs. For example, the increasing electrification targets in major automotive markets are directly stimulating investment in SRM research and development.
Challenges in the Switched Reluctance Motors for Electric Vehicles Market
Despite the promising outlook, the Switched Reluctance Motors for Electric Vehicles market faces several challenges. A primary hurdle remains the historical perception of SRMs having higher torque ripple and acoustic noise compared to Permanent Magnet Synchronous Motors. Addressing these issues through advanced control techniques and improved motor design requires significant R&D investment. Regulatory hurdles, while generally favorable for EVs, can sometimes be slow to adapt to new powertrain technologies, potentially delaying widespread adoption. Supply chain issues, particularly the availability of specialized components and skilled labor for advanced SRM manufacturing, can also pose a restraint. Competitive pressures from established and highly refined PMSM technology, which benefits from decades of development and widespread OEM familiarity, continue to challenge SRM market penetration. The estimated cost of overcoming these technical challenges could amount to millions in R&D expenditure per company.
Emerging Opportunities in Switched Reluctance Motors for Electric Vehicles
Emerging opportunities in the Switched Reluctance Motors for Electric Vehicles sector are vast and driven by continuous technological breakthroughs and strategic market plays. The increasing demand for electric commercial vehicles, such as trucks and buses, presents a significant opportunity for SRMs due to their robustness and scalability. Technological advancements in high-temperature materials and advanced cooling systems are opening avenues for SRMs in high-performance EV applications. Strategic partnerships between SRM manufacturers and established automotive OEMs are crucial for accelerating market adoption and co-developing tailored solutions. Furthermore, the growing focus on sustainability and the circular economy is creating opportunities for SRM manufacturers that can demonstrate a more environmentally friendly supply chain, particularly by minimizing reliance on rare-earth elements.
Leading Players in the Switched Reluctance Motors for Electric Vehicles Sector
- Nidec
- Maccon
- Enedym
- Hunan Haineng Electromechanical
- Rongcheng Rongjia Power
- Zibo Jingke Electric
Key Milestones in Switched Reluctance Motors for Electric Vehicles Industry
- 2019: Increased research funding for advanced SRM control algorithms.
- 2020: Several leading automotive suppliers begin pilot programs for SRM integration.
- 2021: Key advancements in sensorless control for reduced torque ripple reported.
- 2022: Major breakthroughs in high-performance materials for SRM components announced.
- 2023: First OEM announces plans to incorporate SRMs in a high-volume EV platform.
- 2024: Significant investment in SRM manufacturing capacity by key industry players.
Strategic Outlook for Switched Reluctance Motors for Electric Vehicles Market
The strategic outlook for the Switched Reluctance Motors for Electric Vehicles market is exceptionally positive, characterized by strong growth accelerators. The increasing emphasis on cost reduction, supply chain diversification, and enhanced powertrain reliability within the EV industry positions SRMs as a highly attractive alternative. Future market potential is immense, particularly as ongoing R&D addresses historical performance limitations and as economies of scale are achieved through wider adoption. Strategic opportunities lie in forming deeper collaborations between SRM developers and automotive OEMs to co-create specialized motor solutions. Furthermore, the expansion of SRMs into emerging EV segments, such as heavy-duty vehicles and specialized mobility solutions, will be critical for sustained market leadership.
Switched Reluctance Motors for Electric Vehicles Segmentation
-
1. Application
- 1.1. OEM
- 1.2. Aftermarket
-
2. Types
- 2.1. <50 kW
- 2.2. ≥50 kW
Switched Reluctance Motors for Electric Vehicles Segmentation By Geography
-
1. North America
- 1.1. United States
- 1.2. Canada
- 1.3. Mexico
-
2. South America
- 2.1. Brazil
- 2.2. Argentina
- 2.3. Rest of South America
-
3. Europe
- 3.1. United Kingdom
- 3.2. Germany
- 3.3. France
- 3.4. Italy
- 3.5. Spain
- 3.6. Russia
- 3.7. Benelux
- 3.8. Nordics
- 3.9. Rest of Europe
-
4. Middle East & Africa
- 4.1. Turkey
- 4.2. Israel
- 4.3. GCC
- 4.4. North Africa
- 4.5. South Africa
- 4.6. Rest of Middle East & Africa
-
5. Asia Pacific
- 5.1. China
- 5.2. India
- 5.3. Japan
- 5.4. South Korea
- 5.5. ASEAN
- 5.6. Oceania
- 5.7. Rest of Asia Pacific
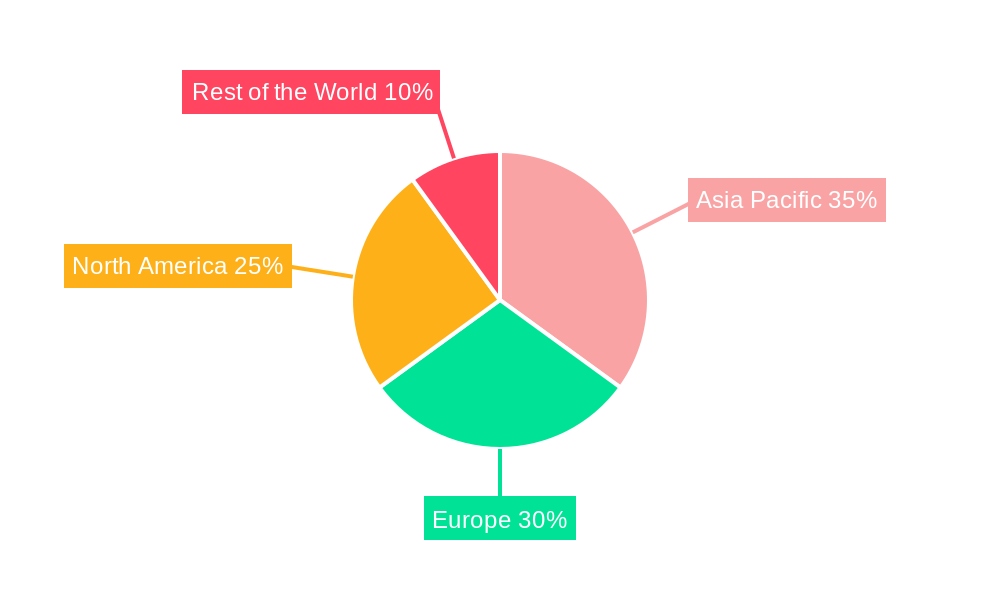
Switched Reluctance Motors for Electric Vehicles Regional Market Share
Geographic Coverage of Switched Reluctance Motors for Electric Vehicles
Switched Reluctance Motors for Electric Vehicles REPORT HIGHLIGHTS
| Aspects | Details |
|---|---|
| Study Period | 2020-2034 |
| Base Year | 2025 |
| Estimated Year | 2026 |
| Forecast Period | 2026-2034 |
| Historical Period | 2020-2025 |
| Growth Rate | CAGR of 6.3% from 2020-2034 |
| Segmentation |
|
Table of Contents
- 1. Introduction
- 1.1. Research Scope
- 1.2. Market Segmentation
- 1.3. Research Methodology
- 1.4. Definitions and Assumptions
- 2. Executive Summary
- 2.1. Introduction
- 3. Market Dynamics
- 3.1. Introduction
- 3.2. Market Drivers
- 3.3. Market Restrains
- 3.4. Market Trends
- 4. Market Factor Analysis
- 4.1. Porters Five Forces
- 4.2. Supply/Value Chain
- 4.3. PESTEL analysis
- 4.4. Market Entropy
- 4.5. Patent/Trademark Analysis
- 5. Global Switched Reluctance Motors for Electric Vehicles Analysis, Insights and Forecast, 2020-2032
- 5.1. Market Analysis, Insights and Forecast - by Application
- 5.1.1. OEM
- 5.1.2. Aftermarket
- 5.2. Market Analysis, Insights and Forecast - by Types
- 5.2.1. <50 kW
- 5.2.2. ≥50 kW
- 5.3. Market Analysis, Insights and Forecast - by Region
- 5.3.1. North America
- 5.3.2. South America
- 5.3.3. Europe
- 5.3.4. Middle East & Africa
- 5.3.5. Asia Pacific
- 5.1. Market Analysis, Insights and Forecast - by Application
- 6. North America Switched Reluctance Motors for Electric Vehicles Analysis, Insights and Forecast, 2020-2032
- 6.1. Market Analysis, Insights and Forecast - by Application
- 6.1.1. OEM
- 6.1.2. Aftermarket
- 6.2. Market Analysis, Insights and Forecast - by Types
- 6.2.1. <50 kW
- 6.2.2. ≥50 kW
- 6.1. Market Analysis, Insights and Forecast - by Application
- 7. South America Switched Reluctance Motors for Electric Vehicles Analysis, Insights and Forecast, 2020-2032
- 7.1. Market Analysis, Insights and Forecast - by Application
- 7.1.1. OEM
- 7.1.2. Aftermarket
- 7.2. Market Analysis, Insights and Forecast - by Types
- 7.2.1. <50 kW
- 7.2.2. ≥50 kW
- 7.1. Market Analysis, Insights and Forecast - by Application
- 8. Europe Switched Reluctance Motors for Electric Vehicles Analysis, Insights and Forecast, 2020-2032
- 8.1. Market Analysis, Insights and Forecast - by Application
- 8.1.1. OEM
- 8.1.2. Aftermarket
- 8.2. Market Analysis, Insights and Forecast - by Types
- 8.2.1. <50 kW
- 8.2.2. ≥50 kW
- 8.1. Market Analysis, Insights and Forecast - by Application
- 9. Middle East & Africa Switched Reluctance Motors for Electric Vehicles Analysis, Insights and Forecast, 2020-2032
- 9.1. Market Analysis, Insights and Forecast - by Application
- 9.1.1. OEM
- 9.1.2. Aftermarket
- 9.2. Market Analysis, Insights and Forecast - by Types
- 9.2.1. <50 kW
- 9.2.2. ≥50 kW
- 9.1. Market Analysis, Insights and Forecast - by Application
- 10. Asia Pacific Switched Reluctance Motors for Electric Vehicles Analysis, Insights and Forecast, 2020-2032
- 10.1. Market Analysis, Insights and Forecast - by Application
- 10.1.1. OEM
- 10.1.2. Aftermarket
- 10.2. Market Analysis, Insights and Forecast - by Types
- 10.2.1. <50 kW
- 10.2.2. ≥50 kW
- 10.1. Market Analysis, Insights and Forecast - by Application
- 11. Competitive Analysis
- 11.1. Global Market Share Analysis 2025
- 11.2. Company Profiles
- 11.2.1 Nidec
- 11.2.1.1. Overview
- 11.2.1.2. Products
- 11.2.1.3. SWOT Analysis
- 11.2.1.4. Recent Developments
- 11.2.1.5. Financials (Based on Availability)
- 11.2.2 Maccon
- 11.2.2.1. Overview
- 11.2.2.2. Products
- 11.2.2.3. SWOT Analysis
- 11.2.2.4. Recent Developments
- 11.2.2.5. Financials (Based on Availability)
- 11.2.3 Enedym
- 11.2.3.1. Overview
- 11.2.3.2. Products
- 11.2.3.3. SWOT Analysis
- 11.2.3.4. Recent Developments
- 11.2.3.5. Financials (Based on Availability)
- 11.2.4 Hunan Haineng Electromechanical
- 11.2.4.1. Overview
- 11.2.4.2. Products
- 11.2.4.3. SWOT Analysis
- 11.2.4.4. Recent Developments
- 11.2.4.5. Financials (Based on Availability)
- 11.2.5 Rongcheng Rongjia Power
- 11.2.5.1. Overview
- 11.2.5.2. Products
- 11.2.5.3. SWOT Analysis
- 11.2.5.4. Recent Developments
- 11.2.5.5. Financials (Based on Availability)
- 11.2.6 Zibo Jingke Electric
- 11.2.6.1. Overview
- 11.2.6.2. Products
- 11.2.6.3. SWOT Analysis
- 11.2.6.4. Recent Developments
- 11.2.6.5. Financials (Based on Availability)
- 11.2.1 Nidec
List of Figures
- Figure 1: Global Switched Reluctance Motors for Electric Vehicles Revenue Breakdown (undefined, %) by Region 2025 & 2033
- Figure 2: North America Switched Reluctance Motors for Electric Vehicles Revenue (undefined), by Application 2025 & 2033
- Figure 3: North America Switched Reluctance Motors for Electric Vehicles Revenue Share (%), by Application 2025 & 2033
- Figure 4: North America Switched Reluctance Motors for Electric Vehicles Revenue (undefined), by Types 2025 & 2033
- Figure 5: North America Switched Reluctance Motors for Electric Vehicles Revenue Share (%), by Types 2025 & 2033
- Figure 6: North America Switched Reluctance Motors for Electric Vehicles Revenue (undefined), by Country 2025 & 2033
- Figure 7: North America Switched Reluctance Motors for Electric Vehicles Revenue Share (%), by Country 2025 & 2033
- Figure 8: South America Switched Reluctance Motors for Electric Vehicles Revenue (undefined), by Application 2025 & 2033
- Figure 9: South America Switched Reluctance Motors for Electric Vehicles Revenue Share (%), by Application 2025 & 2033
- Figure 10: South America Switched Reluctance Motors for Electric Vehicles Revenue (undefined), by Types 2025 & 2033
- Figure 11: South America Switched Reluctance Motors for Electric Vehicles Revenue Share (%), by Types 2025 & 2033
- Figure 12: South America Switched Reluctance Motors for Electric Vehicles Revenue (undefined), by Country 2025 & 2033
- Figure 13: South America Switched Reluctance Motors for Electric Vehicles Revenue Share (%), by Country 2025 & 2033
- Figure 14: Europe Switched Reluctance Motors for Electric Vehicles Revenue (undefined), by Application 2025 & 2033
- Figure 15: Europe Switched Reluctance Motors for Electric Vehicles Revenue Share (%), by Application 2025 & 2033
- Figure 16: Europe Switched Reluctance Motors for Electric Vehicles Revenue (undefined), by Types 2025 & 2033
- Figure 17: Europe Switched Reluctance Motors for Electric Vehicles Revenue Share (%), by Types 2025 & 2033
- Figure 18: Europe Switched Reluctance Motors for Electric Vehicles Revenue (undefined), by Country 2025 & 2033
- Figure 19: Europe Switched Reluctance Motors for Electric Vehicles Revenue Share (%), by Country 2025 & 2033
- Figure 20: Middle East & Africa Switched Reluctance Motors for Electric Vehicles Revenue (undefined), by Application 2025 & 2033
- Figure 21: Middle East & Africa Switched Reluctance Motors for Electric Vehicles Revenue Share (%), by Application 2025 & 2033
- Figure 22: Middle East & Africa Switched Reluctance Motors for Electric Vehicles Revenue (undefined), by Types 2025 & 2033
- Figure 23: Middle East & Africa Switched Reluctance Motors for Electric Vehicles Revenue Share (%), by Types 2025 & 2033
- Figure 24: Middle East & Africa Switched Reluctance Motors for Electric Vehicles Revenue (undefined), by Country 2025 & 2033
- Figure 25: Middle East & Africa Switched Reluctance Motors for Electric Vehicles Revenue Share (%), by Country 2025 & 2033
- Figure 26: Asia Pacific Switched Reluctance Motors for Electric Vehicles Revenue (undefined), by Application 2025 & 2033
- Figure 27: Asia Pacific Switched Reluctance Motors for Electric Vehicles Revenue Share (%), by Application 2025 & 2033
- Figure 28: Asia Pacific Switched Reluctance Motors for Electric Vehicles Revenue (undefined), by Types 2025 & 2033
- Figure 29: Asia Pacific Switched Reluctance Motors for Electric Vehicles Revenue Share (%), by Types 2025 & 2033
- Figure 30: Asia Pacific Switched Reluctance Motors for Electric Vehicles Revenue (undefined), by Country 2025 & 2033
- Figure 31: Asia Pacific Switched Reluctance Motors for Electric Vehicles Revenue Share (%), by Country 2025 & 2033
List of Tables
- Table 1: Global Switched Reluctance Motors for Electric Vehicles Revenue undefined Forecast, by Application 2020 & 2033
- Table 2: Global Switched Reluctance Motors for Electric Vehicles Revenue undefined Forecast, by Types 2020 & 2033
- Table 3: Global Switched Reluctance Motors for Electric Vehicles Revenue undefined Forecast, by Region 2020 & 2033
- Table 4: Global Switched Reluctance Motors for Electric Vehicles Revenue undefined Forecast, by Application 2020 & 2033
- Table 5: Global Switched Reluctance Motors for Electric Vehicles Revenue undefined Forecast, by Types 2020 & 2033
- Table 6: Global Switched Reluctance Motors for Electric Vehicles Revenue undefined Forecast, by Country 2020 & 2033
- Table 7: United States Switched Reluctance Motors for Electric Vehicles Revenue (undefined) Forecast, by Application 2020 & 2033
- Table 8: Canada Switched Reluctance Motors for Electric Vehicles Revenue (undefined) Forecast, by Application 2020 & 2033
- Table 9: Mexico Switched Reluctance Motors for Electric Vehicles Revenue (undefined) Forecast, by Application 2020 & 2033
- Table 10: Global Switched Reluctance Motors for Electric Vehicles Revenue undefined Forecast, by Application 2020 & 2033
- Table 11: Global Switched Reluctance Motors for Electric Vehicles Revenue undefined Forecast, by Types 2020 & 2033
- Table 12: Global Switched Reluctance Motors for Electric Vehicles Revenue undefined Forecast, by Country 2020 & 2033
- Table 13: Brazil Switched Reluctance Motors for Electric Vehicles Revenue (undefined) Forecast, by Application 2020 & 2033
- Table 14: Argentina Switched Reluctance Motors for Electric Vehicles Revenue (undefined) Forecast, by Application 2020 & 2033
- Table 15: Rest of South America Switched Reluctance Motors for Electric Vehicles Revenue (undefined) Forecast, by Application 2020 & 2033
- Table 16: Global Switched Reluctance Motors for Electric Vehicles Revenue undefined Forecast, by Application 2020 & 2033
- Table 17: Global Switched Reluctance Motors for Electric Vehicles Revenue undefined Forecast, by Types 2020 & 2033
- Table 18: Global Switched Reluctance Motors for Electric Vehicles Revenue undefined Forecast, by Country 2020 & 2033
- Table 19: United Kingdom Switched Reluctance Motors for Electric Vehicles Revenue (undefined) Forecast, by Application 2020 & 2033
- Table 20: Germany Switched Reluctance Motors for Electric Vehicles Revenue (undefined) Forecast, by Application 2020 & 2033
- Table 21: France Switched Reluctance Motors for Electric Vehicles Revenue (undefined) Forecast, by Application 2020 & 2033
- Table 22: Italy Switched Reluctance Motors for Electric Vehicles Revenue (undefined) Forecast, by Application 2020 & 2033
- Table 23: Spain Switched Reluctance Motors for Electric Vehicles Revenue (undefined) Forecast, by Application 2020 & 2033
- Table 24: Russia Switched Reluctance Motors for Electric Vehicles Revenue (undefined) Forecast, by Application 2020 & 2033
- Table 25: Benelux Switched Reluctance Motors for Electric Vehicles Revenue (undefined) Forecast, by Application 2020 & 2033
- Table 26: Nordics Switched Reluctance Motors for Electric Vehicles Revenue (undefined) Forecast, by Application 2020 & 2033
- Table 27: Rest of Europe Switched Reluctance Motors for Electric Vehicles Revenue (undefined) Forecast, by Application 2020 & 2033
- Table 28: Global Switched Reluctance Motors for Electric Vehicles Revenue undefined Forecast, by Application 2020 & 2033
- Table 29: Global Switched Reluctance Motors for Electric Vehicles Revenue undefined Forecast, by Types 2020 & 2033
- Table 30: Global Switched Reluctance Motors for Electric Vehicles Revenue undefined Forecast, by Country 2020 & 2033
- Table 31: Turkey Switched Reluctance Motors for Electric Vehicles Revenue (undefined) Forecast, by Application 2020 & 2033
- Table 32: Israel Switched Reluctance Motors for Electric Vehicles Revenue (undefined) Forecast, by Application 2020 & 2033
- Table 33: GCC Switched Reluctance Motors for Electric Vehicles Revenue (undefined) Forecast, by Application 2020 & 2033
- Table 34: North Africa Switched Reluctance Motors for Electric Vehicles Revenue (undefined) Forecast, by Application 2020 & 2033
- Table 35: South Africa Switched Reluctance Motors for Electric Vehicles Revenue (undefined) Forecast, by Application 2020 & 2033
- Table 36: Rest of Middle East & Africa Switched Reluctance Motors for Electric Vehicles Revenue (undefined) Forecast, by Application 2020 & 2033
- Table 37: Global Switched Reluctance Motors for Electric Vehicles Revenue undefined Forecast, by Application 2020 & 2033
- Table 38: Global Switched Reluctance Motors for Electric Vehicles Revenue undefined Forecast, by Types 2020 & 2033
- Table 39: Global Switched Reluctance Motors for Electric Vehicles Revenue undefined Forecast, by Country 2020 & 2033
- Table 40: China Switched Reluctance Motors for Electric Vehicles Revenue (undefined) Forecast, by Application 2020 & 2033
- Table 41: India Switched Reluctance Motors for Electric Vehicles Revenue (undefined) Forecast, by Application 2020 & 2033
- Table 42: Japan Switched Reluctance Motors for Electric Vehicles Revenue (undefined) Forecast, by Application 2020 & 2033
- Table 43: South Korea Switched Reluctance Motors for Electric Vehicles Revenue (undefined) Forecast, by Application 2020 & 2033
- Table 44: ASEAN Switched Reluctance Motors for Electric Vehicles Revenue (undefined) Forecast, by Application 2020 & 2033
- Table 45: Oceania Switched Reluctance Motors for Electric Vehicles Revenue (undefined) Forecast, by Application 2020 & 2033
- Table 46: Rest of Asia Pacific Switched Reluctance Motors for Electric Vehicles Revenue (undefined) Forecast, by Application 2020 & 2033
Frequently Asked Questions
1. What is the projected Compound Annual Growth Rate (CAGR) of the Switched Reluctance Motors for Electric Vehicles?
The projected CAGR is approximately 6.3%.
2. Which companies are prominent players in the Switched Reluctance Motors for Electric Vehicles?
Key companies in the market include Nidec, Maccon, Enedym, Hunan Haineng Electromechanical, Rongcheng Rongjia Power, Zibo Jingke Electric.
3. What are the main segments of the Switched Reluctance Motors for Electric Vehicles?
The market segments include Application, Types.
4. Can you provide details about the market size?
The market size is estimated to be USD XXX N/A as of 2022.
5. What are some drivers contributing to market growth?
N/A
6. What are the notable trends driving market growth?
N/A
7. Are there any restraints impacting market growth?
N/A
8. Can you provide examples of recent developments in the market?
N/A
9. What pricing options are available for accessing the report?
Pricing options include single-user, multi-user, and enterprise licenses priced at USD 4900.00, USD 7350.00, and USD 9800.00 respectively.
10. Is the market size provided in terms of value or volume?
The market size is provided in terms of value, measured in N/A.
11. Are there any specific market keywords associated with the report?
Yes, the market keyword associated with the report is "Switched Reluctance Motors for Electric Vehicles," which aids in identifying and referencing the specific market segment covered.
12. How do I determine which pricing option suits my needs best?
The pricing options vary based on user requirements and access needs. Individual users may opt for single-user licenses, while businesses requiring broader access may choose multi-user or enterprise licenses for cost-effective access to the report.
13. Are there any additional resources or data provided in the Switched Reluctance Motors for Electric Vehicles report?
While the report offers comprehensive insights, it's advisable to review the specific contents or supplementary materials provided to ascertain if additional resources or data are available.
14. How can I stay updated on further developments or reports in the Switched Reluctance Motors for Electric Vehicles?
To stay informed about further developments, trends, and reports in the Switched Reluctance Motors for Electric Vehicles, consider subscribing to industry newsletters, following relevant companies and organizations, or regularly checking reputable industry news sources and publications.
Methodology
Step 1 - Identification of Relevant Samples Size from Population Database


Step 2 - Approaches for Defining Global Market Size (Value, Volume* & Price*)

Note*: In applicable scenarios
Step 3 - Data Sources
Primary Research
- Web Analytics
- Survey Reports
- Research Institute
- Latest Research Reports
- Opinion Leaders
Secondary Research
- Annual Reports
- White Paper
- Latest Press Release
- Industry Association
- Paid Database
- Investor Presentations

Step 4 - Data Triangulation
Involves using different sources of information in order to increase the validity of a study
These sources are likely to be stakeholders in a program - participants, other researchers, program staff, other community members, and so on.
Then we put all data in single framework & apply various statistical tools to find out the dynamic on the market.
During the analysis stage, feedback from the stakeholder groups would be compared to determine areas of agreement as well as areas of divergence