

Key Insights
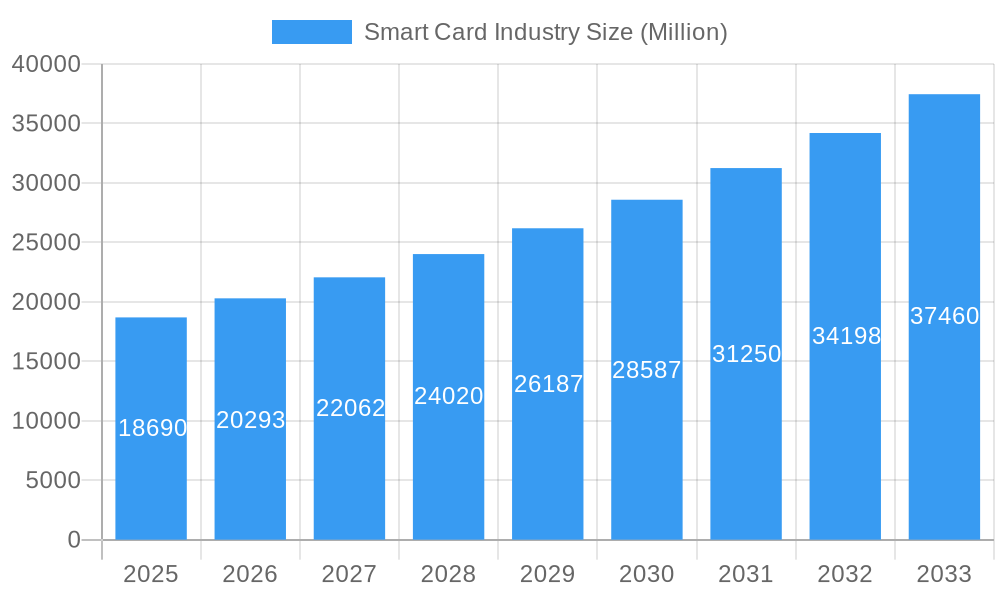
The global smart card market, valued at $18.69 billion in 2025, is projected to experience robust growth, exhibiting a Compound Annual Growth Rate (CAGR) of 8.59% from 2025 to 2033. This expansion is driven by several key factors. The increasing adoption of contactless payment solutions and the surge in digital transactions are major catalysts. Furthermore, the rising demand for secure identification and access control systems across various sectors, including BFSI (Banking, Financial Services, and Insurance), IT & Telecommunications, and government, fuels market growth. Government initiatives promoting digitalization and the expanding use of smart cards in transportation systems (e.g., transit cards) further contribute to this upward trajectory. Technological advancements, such as the incorporation of biometric features and enhanced security protocols within smart cards, are also driving market adoption.
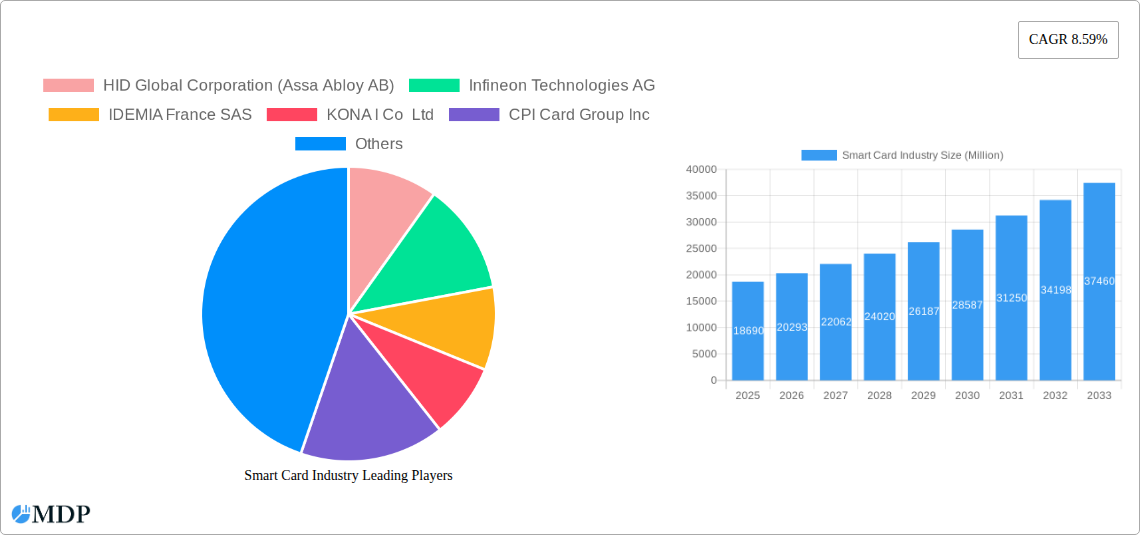
Smart Card Industry Market Size (In Billion)
Market segmentation reveals significant opportunities. Contactless smart cards are experiencing faster growth compared to contact-based cards due to convenience and hygiene concerns. Within end-user verticals, the BFSI sector dominates, followed by IT & Telecommunications, reflecting the substantial use of smart cards in banking operations and SIM cards in mobile communications. However, other sectors like healthcare (patient identification and access control) and education (student identification and access control) also show strong growth potential, presenting lucrative opportunities for market players. While certain geographical regions like North America and Europe currently hold larger market shares, rapid economic development and technological adoption in Asia-Pacific and other emerging markets are expected to significantly contribute to future market expansion. Competition is fierce, with major players like HID Global, Infineon Technologies, and Gemalto vying for market share through product innovation and strategic partnerships.
Smart Card Industry Company Market Share
Smart Card Industry Market Report: 2019-2033
This comprehensive report provides an in-depth analysis of the global smart card industry, offering invaluable insights for stakeholders seeking to navigate this dynamic market. The report covers the period from 2019 to 2033, with a focus on the estimated year 2025 and a forecast period spanning 2025-2033. Valuations are expressed in millions.
Smart Card Industry Market Dynamics & Concentration
The global smart card market exhibits a moderately consolidated structure, with key players holding significant market share. The market's dynamics are shaped by several factors:
Innovation Drivers: Continuous advancements in chip technology, security features (biometrics, encryption), and contactless functionalities drive market expansion. The integration of near-field communication (NFC) and mobile payment technologies is significantly impacting growth.
Regulatory Frameworks: Government regulations concerning data privacy, security standards (e.g., EMV), and interoperability influence market development. Variations in regulations across different geographies create both opportunities and challenges.
Product Substitutes: Mobile payment systems and digital wallets pose a competitive threat, but the smart card industry counters this by incorporating improved security and functionalities.
End-User Trends: The increasing adoption of smart cards across various sectors—BFSI, transportation, government, healthcare—fuels market growth. Demand is driven by the need for secure identification, access control, and payment solutions.
M&A Activities: The industry witnesses significant merger and acquisition (M&A) activities, with an estimated xx M&A deals concluded between 2019 and 2024. Major players like HID Global Corporation and Gemalto (Thales Group) have engaged in strategic acquisitions to expand their market reach and product portfolios. The market share of the top 5 players is estimated to be xx% in 2025.
Smart Card Industry Industry Trends & Analysis
The smart card market is experiencing robust growth, driven by several key trends:
The Compound Annual Growth Rate (CAGR) for the period 2025-2033 is projected at xx%. This growth is fueled by the increasing penetration of smart cards in various applications, including payment cards, identity cards, transit passes, and access control systems. Technological disruptions, such as the rising popularity of contactless cards and the integration of biometric authentication, are reshaping the industry landscape. Consumer preferences are shifting towards convenient and secure contactless payment solutions, while the competitive landscape is characterized by innovation, strategic partnerships, and M&A activity. Market penetration in key sectors like BFSI is estimated to reach xx% by 2033, showcasing the substantial growth potential.
Leading Markets & Segments in Smart Card Industry
The Asia-Pacific region is projected to dominate the global smart card market throughout the forecast period, driven by rapid economic growth and increasing government initiatives promoting digitalization. Within this region, countries like India and China are expected to contribute significantly to overall market expansion.
By Type: Contactless smart cards are experiencing faster growth than contact-based cards due to their convenience and enhanced security features. The market share of contactless cards is projected to reach xx% by 2033.
By End-User Vertical: The BFSI sector remains the largest segment, followed by the government and transportation sectors. The BFSI sector's dominance is attributed to the widespread use of debit and credit cards, while government initiatives to improve citizen identification and access control contribute to the growth of the government sector. The transportation sector is experiencing significant growth due to the increasing adoption of smart transit cards.
Key Drivers:
- Asia-Pacific: Rapid urbanization, expanding middle class, increasing smartphone penetration.
- BFSI: Growing digital payments adoption, increasing fraud prevention measures.
- Government: Initiatives to improve citizen services, national ID programs.
- Transportation: Smart city initiatives, improving public transport efficiency.
Smart Card Industry Product Developments
Recent product innovations focus on enhanced security, improved user experience, and integration with mobile devices. The integration of biometrics, NFC technology, and advanced encryption algorithms are key features of newer smart card products. These innovations cater to the growing demand for secure and convenient payment and access control solutions. Companies are emphasizing the development of sustainable and environmentally friendly smart card solutions, aligning with global sustainability initiatives.
Key Drivers of Smart Card Industry Growth
Several factors contribute to the growth of the smart card industry:
- Technological advancements: Innovations in chip technology, security features, and contactless payment solutions.
- Economic growth: Rising disposable incomes and increasing spending power in developing economies.
- Government regulations: Initiatives to promote digitalization and cashless transactions.
- Increased security concerns: Growing demand for secure identification and access control systems.
Challenges in the Smart Card Industry Market
Challenges include:
- Regulatory hurdles: Varying regulations across different countries and regions can hinder market expansion.
- Supply chain disruptions: Global supply chain vulnerabilities can impact production and distribution.
- Competitive pressures: Intense competition from other payment technologies, such as mobile wallets.
- Security threats: The increasing sophistication of cyberattacks necessitates ongoing investments in security measures. This contributes to approximately xx million in additional annual costs for companies in the sector.
Emerging Opportunities in Smart Card Industry
The long-term growth of the smart card industry is driven by:
The rising adoption of the Internet of Things (IoT), growing demand for secure contactless payments, the expansion of smart cities, and ongoing technological innovation in embedded security technologies are key opportunities for significant growth in the coming years. Strategic partnerships and market expansion into emerging markets represent key growth opportunities.
Leading Players in the Smart Card Industry Sector
- HID Global Corporation (Assa Abloy AB)
- Infineon Technologies AG
- IDEMIA France SAS
- KONA I Co Ltd
- CPI Card Group Inc
- Samsung Electronics Co Ltd
- Gemalto NV (Thales Group)
- Watchdata Technologies
- Secura Key
- Fingerprint Cards AB
- Alioth LLC
- CardLogix Corporation
- Giesecke & Devrient GmbH (MC Familiengesellschaft mbH)
- Bundesdruckerei GmbH
- IntelCav
Key Milestones in Smart Card Industry Industry
- April 2023: Launch of the GoSmart National Common Mobility Card (NCMC) in Kanpur, India, facilitating nationwide interoperable transport and payment services. This is expected to contribute xx million to the market in the next 5 years.
- January 2023: Inauguration of dzcard's new innovation center in Bangkok, Thailand, focusing on next-generation sustainable card technologies. This initiative positions dzcard for growth within the sustainable smart card solutions sector.
Strategic Outlook for Smart Card Industry Market
The smart card market is poised for substantial growth, driven by technological advancements, increasing digitalization, and the expanding adoption of contactless payment and access control solutions. Strategic partnerships, investments in research and development, and expansion into new markets will be crucial for companies seeking to capitalize on future opportunities. The market's potential for innovation is enormous, presenting many opportunities for new entrants and existing players to thrive.
Smart Card Industry Segmentation
-
1. Type
- 1.1. Contact-based
- 1.2. Contact-Less
-
2. End-user Vertical
- 2.1. BFSI
- 2.2. IT & Telecommunication
- 2.3. Government
- 2.4. Transportation
- 2.5. Other
Smart Card Industry Segmentation By Geography
-
1. North America
- 1.1. United States
- 1.2. Canada
-
2. Europe
- 2.1. United Kingdom
- 2.2. Germany
- 2.3. France
- 2.4. Rest of Europe
-
3. Asia Pacific
- 3.1. China
- 3.2. Japan
- 3.3. India
- 3.4. Rest of Asia Pacific
- 4. Rest of the World
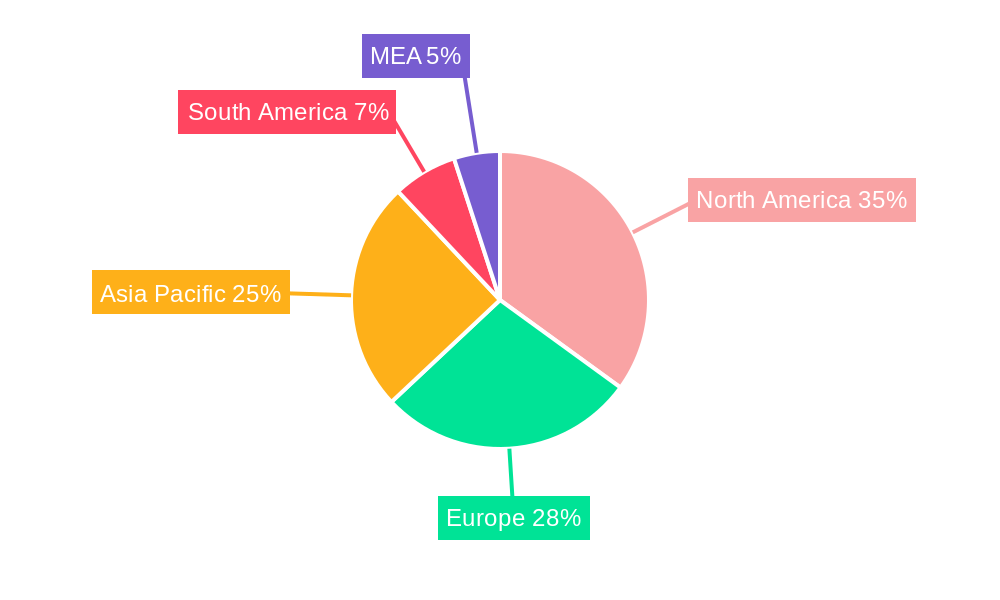
Smart Card Industry Regional Market Share
Geographic Coverage of Smart Card Industry
Smart Card Industry REPORT HIGHLIGHTS
| Aspects | Details |
|---|---|
| Study Period | 2020-2034 |
| Base Year | 2025 |
| Estimated Year | 2026 |
| Forecast Period | 2026-2034 |
| Historical Period | 2020-2025 |
| Growth Rate | CAGR of 8.59% from 2020-2034 |
| Segmentation |
|
Table of Contents
- 1. Introduction
- 1.1. Research Scope
- 1.2. Market Segmentation
- 1.3. Research Methodology
- 1.4. Definitions and Assumptions
- 2. Executive Summary
- 2.1. Introduction
- 3. Market Dynamics
- 3.1. Introduction
- 3.2. Market Drivers
- 3.2.1. Growing Deployment in Personal Identification and Access Control Applications; Extensive Use in Travel Identity and Transportation; Growing Demand for Contactless Payments
- 3.3. Market Restrains
- 3.3.1. Privacy and Security Issues and Standardization concerns
- 3.4. Market Trends
- 3.4.1. Growing Deployment in Personal Identification and Access Control Applications to Drive the Market Growth
- 4. Market Factor Analysis
- 4.1. Porters Five Forces
- 4.2. Supply/Value Chain
- 4.3. PESTEL analysis
- 4.4. Market Entropy
- 4.5. Patent/Trademark Analysis
- 5. Global Smart Card Industry Analysis, Insights and Forecast, 2020-2032
- 5.1. Market Analysis, Insights and Forecast - by Type
- 5.1.1. Contact-based
- 5.1.2. Contact-Less
- 5.2. Market Analysis, Insights and Forecast - by End-user Vertical
- 5.2.1. BFSI
- 5.2.2. IT & Telecommunication
- 5.2.3. Government
- 5.2.4. Transportation
- 5.2.5. Other
- 5.3. Market Analysis, Insights and Forecast - by Region
- 5.3.1. North America
- 5.3.2. Europe
- 5.3.3. Asia Pacific
- 5.3.4. Rest of the World
- 5.1. Market Analysis, Insights and Forecast - by Type
- 6. North America Smart Card Industry Analysis, Insights and Forecast, 2020-2032
- 6.1. Market Analysis, Insights and Forecast - by Type
- 6.1.1. Contact-based
- 6.1.2. Contact-Less
- 6.2. Market Analysis, Insights and Forecast - by End-user Vertical
- 6.2.1. BFSI
- 6.2.2. IT & Telecommunication
- 6.2.3. Government
- 6.2.4. Transportation
- 6.2.5. Other
- 6.1. Market Analysis, Insights and Forecast - by Type
- 7. Europe Smart Card Industry Analysis, Insights and Forecast, 2020-2032
- 7.1. Market Analysis, Insights and Forecast - by Type
- 7.1.1. Contact-based
- 7.1.2. Contact-Less
- 7.2. Market Analysis, Insights and Forecast - by End-user Vertical
- 7.2.1. BFSI
- 7.2.2. IT & Telecommunication
- 7.2.3. Government
- 7.2.4. Transportation
- 7.2.5. Other
- 7.1. Market Analysis, Insights and Forecast - by Type
- 8. Asia Pacific Smart Card Industry Analysis, Insights and Forecast, 2020-2032
- 8.1. Market Analysis, Insights and Forecast - by Type
- 8.1.1. Contact-based
- 8.1.2. Contact-Less
- 8.2. Market Analysis, Insights and Forecast - by End-user Vertical
- 8.2.1. BFSI
- 8.2.2. IT & Telecommunication
- 8.2.3. Government
- 8.2.4. Transportation
- 8.2.5. Other
- 8.1. Market Analysis, Insights and Forecast - by Type
- 9. Rest of the World Smart Card Industry Analysis, Insights and Forecast, 2020-2032
- 9.1. Market Analysis, Insights and Forecast - by Type
- 9.1.1. Contact-based
- 9.1.2. Contact-Less
- 9.2. Market Analysis, Insights and Forecast - by End-user Vertical
- 9.2.1. BFSI
- 9.2.2. IT & Telecommunication
- 9.2.3. Government
- 9.2.4. Transportation
- 9.2.5. Other
- 9.1. Market Analysis, Insights and Forecast - by Type
- 10. Competitive Analysis
- 10.1. Global Market Share Analysis 2025
- 10.2. Company Profiles
- 10.2.1 HID Global Corporation (Assa Abloy AB)
- 10.2.1.1. Overview
- 10.2.1.2. Products
- 10.2.1.3. SWOT Analysis
- 10.2.1.4. Recent Developments
- 10.2.1.5. Financials (Based on Availability)
- 10.2.2 Infineon Technologies AG
- 10.2.2.1. Overview
- 10.2.2.2. Products
- 10.2.2.3. SWOT Analysis
- 10.2.2.4. Recent Developments
- 10.2.2.5. Financials (Based on Availability)
- 10.2.3 IDEMIA France SAS
- 10.2.3.1. Overview
- 10.2.3.2. Products
- 10.2.3.3. SWOT Analysis
- 10.2.3.4. Recent Developments
- 10.2.3.5. Financials (Based on Availability)
- 10.2.4 KONA I Co Ltd
- 10.2.4.1. Overview
- 10.2.4.2. Products
- 10.2.4.3. SWOT Analysis
- 10.2.4.4. Recent Developments
- 10.2.4.5. Financials (Based on Availability)
- 10.2.5 CPI Card Group Inc
- 10.2.5.1. Overview
- 10.2.5.2. Products
- 10.2.5.3. SWOT Analysis
- 10.2.5.4. Recent Developments
- 10.2.5.5. Financials (Based on Availability)
- 10.2.6 Samsung Electronics Co Ltd
- 10.2.6.1. Overview
- 10.2.6.2. Products
- 10.2.6.3. SWOT Analysis
- 10.2.6.4. Recent Developments
- 10.2.6.5. Financials (Based on Availability)
- 10.2.7 Gemalto NV (Thales Group)
- 10.2.7.1. Overview
- 10.2.7.2. Products
- 10.2.7.3. SWOT Analysis
- 10.2.7.4. Recent Developments
- 10.2.7.5. Financials (Based on Availability)
- 10.2.8 Watchdata Technologies
- 10.2.8.1. Overview
- 10.2.8.2. Products
- 10.2.8.3. SWOT Analysis
- 10.2.8.4. Recent Developments
- 10.2.8.5. Financials (Based on Availability)
- 10.2.9 Secura Key
- 10.2.9.1. Overview
- 10.2.9.2. Products
- 10.2.9.3. SWOT Analysis
- 10.2.9.4. Recent Developments
- 10.2.9.5. Financials (Based on Availability)
- 10.2.10 Fingerprint Cards AB
- 10.2.10.1. Overview
- 10.2.10.2. Products
- 10.2.10.3. SWOT Analysis
- 10.2.10.4. Recent Developments
- 10.2.10.5. Financials (Based on Availability)
- 10.2.11 Alioth LLC
- 10.2.11.1. Overview
- 10.2.11.2. Products
- 10.2.11.3. SWOT Analysis
- 10.2.11.4. Recent Developments
- 10.2.11.5. Financials (Based on Availability)
- 10.2.12 CardLogix Corporation
- 10.2.12.1. Overview
- 10.2.12.2. Products
- 10.2.12.3. SWOT Analysis
- 10.2.12.4. Recent Developments
- 10.2.12.5. Financials (Based on Availability)
- 10.2.13 Giesecke & Devrient GmbH (MC Familiengesellschaft mbH)
- 10.2.13.1. Overview
- 10.2.13.2. Products
- 10.2.13.3. SWOT Analysis
- 10.2.13.4. Recent Developments
- 10.2.13.5. Financials (Based on Availability)
- 10.2.14 Bundesdruckerei GmbH
- 10.2.14.1. Overview
- 10.2.14.2. Products
- 10.2.14.3. SWOT Analysis
- 10.2.14.4. Recent Developments
- 10.2.14.5. Financials (Based on Availability)
- 10.2.15 IntelCav
- 10.2.15.1. Overview
- 10.2.15.2. Products
- 10.2.15.3. SWOT Analysis
- 10.2.15.4. Recent Developments
- 10.2.15.5. Financials (Based on Availability)
- 10.2.1 HID Global Corporation (Assa Abloy AB)
List of Figures
- Figure 1: Global Smart Card Industry Revenue Breakdown (Million, %) by Region 2025 & 2033
- Figure 2: Global Smart Card Industry Volume Breakdown (K Unit, %) by Region 2025 & 2033
- Figure 3: North America Smart Card Industry Revenue (Million), by Type 2025 & 2033
- Figure 4: North America Smart Card Industry Volume (K Unit), by Type 2025 & 2033
- Figure 5: North America Smart Card Industry Revenue Share (%), by Type 2025 & 2033
- Figure 6: North America Smart Card Industry Volume Share (%), by Type 2025 & 2033
- Figure 7: North America Smart Card Industry Revenue (Million), by End-user Vertical 2025 & 2033
- Figure 8: North America Smart Card Industry Volume (K Unit), by End-user Vertical 2025 & 2033
- Figure 9: North America Smart Card Industry Revenue Share (%), by End-user Vertical 2025 & 2033
- Figure 10: North America Smart Card Industry Volume Share (%), by End-user Vertical 2025 & 2033
- Figure 11: North America Smart Card Industry Revenue (Million), by Country 2025 & 2033
- Figure 12: North America Smart Card Industry Volume (K Unit), by Country 2025 & 2033
- Figure 13: North America Smart Card Industry Revenue Share (%), by Country 2025 & 2033
- Figure 14: North America Smart Card Industry Volume Share (%), by Country 2025 & 2033
- Figure 15: Europe Smart Card Industry Revenue (Million), by Type 2025 & 2033
- Figure 16: Europe Smart Card Industry Volume (K Unit), by Type 2025 & 2033
- Figure 17: Europe Smart Card Industry Revenue Share (%), by Type 2025 & 2033
- Figure 18: Europe Smart Card Industry Volume Share (%), by Type 2025 & 2033
- Figure 19: Europe Smart Card Industry Revenue (Million), by End-user Vertical 2025 & 2033
- Figure 20: Europe Smart Card Industry Volume (K Unit), by End-user Vertical 2025 & 2033
- Figure 21: Europe Smart Card Industry Revenue Share (%), by End-user Vertical 2025 & 2033
- Figure 22: Europe Smart Card Industry Volume Share (%), by End-user Vertical 2025 & 2033
- Figure 23: Europe Smart Card Industry Revenue (Million), by Country 2025 & 2033
- Figure 24: Europe Smart Card Industry Volume (K Unit), by Country 2025 & 2033
- Figure 25: Europe Smart Card Industry Revenue Share (%), by Country 2025 & 2033
- Figure 26: Europe Smart Card Industry Volume Share (%), by Country 2025 & 2033
- Figure 27: Asia Pacific Smart Card Industry Revenue (Million), by Type 2025 & 2033
- Figure 28: Asia Pacific Smart Card Industry Volume (K Unit), by Type 2025 & 2033
- Figure 29: Asia Pacific Smart Card Industry Revenue Share (%), by Type 2025 & 2033
- Figure 30: Asia Pacific Smart Card Industry Volume Share (%), by Type 2025 & 2033
- Figure 31: Asia Pacific Smart Card Industry Revenue (Million), by End-user Vertical 2025 & 2033
- Figure 32: Asia Pacific Smart Card Industry Volume (K Unit), by End-user Vertical 2025 & 2033
- Figure 33: Asia Pacific Smart Card Industry Revenue Share (%), by End-user Vertical 2025 & 2033
- Figure 34: Asia Pacific Smart Card Industry Volume Share (%), by End-user Vertical 2025 & 2033
- Figure 35: Asia Pacific Smart Card Industry Revenue (Million), by Country 2025 & 2033
- Figure 36: Asia Pacific Smart Card Industry Volume (K Unit), by Country 2025 & 2033
- Figure 37: Asia Pacific Smart Card Industry Revenue Share (%), by Country 2025 & 2033
- Figure 38: Asia Pacific Smart Card Industry Volume Share (%), by Country 2025 & 2033
- Figure 39: Rest of the World Smart Card Industry Revenue (Million), by Type 2025 & 2033
- Figure 40: Rest of the World Smart Card Industry Volume (K Unit), by Type 2025 & 2033
- Figure 41: Rest of the World Smart Card Industry Revenue Share (%), by Type 2025 & 2033
- Figure 42: Rest of the World Smart Card Industry Volume Share (%), by Type 2025 & 2033
- Figure 43: Rest of the World Smart Card Industry Revenue (Million), by End-user Vertical 2025 & 2033
- Figure 44: Rest of the World Smart Card Industry Volume (K Unit), by End-user Vertical 2025 & 2033
- Figure 45: Rest of the World Smart Card Industry Revenue Share (%), by End-user Vertical 2025 & 2033
- Figure 46: Rest of the World Smart Card Industry Volume Share (%), by End-user Vertical 2025 & 2033
- Figure 47: Rest of the World Smart Card Industry Revenue (Million), by Country 2025 & 2033
- Figure 48: Rest of the World Smart Card Industry Volume (K Unit), by Country 2025 & 2033
- Figure 49: Rest of the World Smart Card Industry Revenue Share (%), by Country 2025 & 2033
- Figure 50: Rest of the World Smart Card Industry Volume Share (%), by Country 2025 & 2033
List of Tables
- Table 1: Global Smart Card Industry Revenue Million Forecast, by Type 2020 & 2033
- Table 2: Global Smart Card Industry Volume K Unit Forecast, by Type 2020 & 2033
- Table 3: Global Smart Card Industry Revenue Million Forecast, by End-user Vertical 2020 & 2033
- Table 4: Global Smart Card Industry Volume K Unit Forecast, by End-user Vertical 2020 & 2033
- Table 5: Global Smart Card Industry Revenue Million Forecast, by Region 2020 & 2033
- Table 6: Global Smart Card Industry Volume K Unit Forecast, by Region 2020 & 2033
- Table 7: Global Smart Card Industry Revenue Million Forecast, by Type 2020 & 2033
- Table 8: Global Smart Card Industry Volume K Unit Forecast, by Type 2020 & 2033
- Table 9: Global Smart Card Industry Revenue Million Forecast, by End-user Vertical 2020 & 2033
- Table 10: Global Smart Card Industry Volume K Unit Forecast, by End-user Vertical 2020 & 2033
- Table 11: Global Smart Card Industry Revenue Million Forecast, by Country 2020 & 2033
- Table 12: Global Smart Card Industry Volume K Unit Forecast, by Country 2020 & 2033
- Table 13: United States Smart Card Industry Revenue (Million) Forecast, by Application 2020 & 2033
- Table 14: United States Smart Card Industry Volume (K Unit) Forecast, by Application 2020 & 2033
- Table 15: Canada Smart Card Industry Revenue (Million) Forecast, by Application 2020 & 2033
- Table 16: Canada Smart Card Industry Volume (K Unit) Forecast, by Application 2020 & 2033
- Table 17: Global Smart Card Industry Revenue Million Forecast, by Type 2020 & 2033
- Table 18: Global Smart Card Industry Volume K Unit Forecast, by Type 2020 & 2033
- Table 19: Global Smart Card Industry Revenue Million Forecast, by End-user Vertical 2020 & 2033
- Table 20: Global Smart Card Industry Volume K Unit Forecast, by End-user Vertical 2020 & 2033
- Table 21: Global Smart Card Industry Revenue Million Forecast, by Country 2020 & 2033
- Table 22: Global Smart Card Industry Volume K Unit Forecast, by Country 2020 & 2033
- Table 23: United Kingdom Smart Card Industry Revenue (Million) Forecast, by Application 2020 & 2033
- Table 24: United Kingdom Smart Card Industry Volume (K Unit) Forecast, by Application 2020 & 2033
- Table 25: Germany Smart Card Industry Revenue (Million) Forecast, by Application 2020 & 2033
- Table 26: Germany Smart Card Industry Volume (K Unit) Forecast, by Application 2020 & 2033
- Table 27: France Smart Card Industry Revenue (Million) Forecast, by Application 2020 & 2033
- Table 28: France Smart Card Industry Volume (K Unit) Forecast, by Application 2020 & 2033
- Table 29: Rest of Europe Smart Card Industry Revenue (Million) Forecast, by Application 2020 & 2033
- Table 30: Rest of Europe Smart Card Industry Volume (K Unit) Forecast, by Application 2020 & 2033
- Table 31: Global Smart Card Industry Revenue Million Forecast, by Type 2020 & 2033
- Table 32: Global Smart Card Industry Volume K Unit Forecast, by Type 2020 & 2033
- Table 33: Global Smart Card Industry Revenue Million Forecast, by End-user Vertical 2020 & 2033
- Table 34: Global Smart Card Industry Volume K Unit Forecast, by End-user Vertical 2020 & 2033
- Table 35: Global Smart Card Industry Revenue Million Forecast, by Country 2020 & 2033
- Table 36: Global Smart Card Industry Volume K Unit Forecast, by Country 2020 & 2033
- Table 37: China Smart Card Industry Revenue (Million) Forecast, by Application 2020 & 2033
- Table 38: China Smart Card Industry Volume (K Unit) Forecast, by Application 2020 & 2033
- Table 39: Japan Smart Card Industry Revenue (Million) Forecast, by Application 2020 & 2033
- Table 40: Japan Smart Card Industry Volume (K Unit) Forecast, by Application 2020 & 2033
- Table 41: India Smart Card Industry Revenue (Million) Forecast, by Application 2020 & 2033
- Table 42: India Smart Card Industry Volume (K Unit) Forecast, by Application 2020 & 2033
- Table 43: Rest of Asia Pacific Smart Card Industry Revenue (Million) Forecast, by Application 2020 & 2033
- Table 44: Rest of Asia Pacific Smart Card Industry Volume (K Unit) Forecast, by Application 2020 & 2033
- Table 45: Global Smart Card Industry Revenue Million Forecast, by Type 2020 & 2033
- Table 46: Global Smart Card Industry Volume K Unit Forecast, by Type 2020 & 2033
- Table 47: Global Smart Card Industry Revenue Million Forecast, by End-user Vertical 2020 & 2033
- Table 48: Global Smart Card Industry Volume K Unit Forecast, by End-user Vertical 2020 & 2033
- Table 49: Global Smart Card Industry Revenue Million Forecast, by Country 2020 & 2033
- Table 50: Global Smart Card Industry Volume K Unit Forecast, by Country 2020 & 2033
Frequently Asked Questions
1. What is the projected Compound Annual Growth Rate (CAGR) of the Smart Card Industry?
The projected CAGR is approximately 8.59%.
2. Which companies are prominent players in the Smart Card Industry?
Key companies in the market include HID Global Corporation (Assa Abloy AB), Infineon Technologies AG, IDEMIA France SAS, KONA I Co Ltd, CPI Card Group Inc, Samsung Electronics Co Ltd, Gemalto NV (Thales Group), Watchdata Technologies, Secura Key, Fingerprint Cards AB, Alioth LLC, CardLogix Corporation, Giesecke & Devrient GmbH (MC Familiengesellschaft mbH), Bundesdruckerei GmbH, IntelCav.
3. What are the main segments of the Smart Card Industry?
The market segments include Type, End-user Vertical.
4. Can you provide details about the market size?
The market size is estimated to be USD 18.69 Million as of 2022.
5. What are some drivers contributing to market growth?
Growing Deployment in Personal Identification and Access Control Applications; Extensive Use in Travel Identity and Transportation; Growing Demand for Contactless Payments.
6. What are the notable trends driving market growth?
Growing Deployment in Personal Identification and Access Control Applications to Drive the Market Growth.
7. Are there any restraints impacting market growth?
Privacy and Security Issues and Standardization concerns.
8. Can you provide examples of recent developments in the market?
April 2023: The GoSmart National Common Mobility Card was launched for passengers using the Kanpur metro in India. The NCMC card was initially introduced in Uttar Pradesh by the Kanpur Metro. The primary advantage of this card is that it is an interchangeable transport card, meaning that it may be used for other NCMC-compliant retail, parking, metro, bus, and other transportation services throughout the nation. Travelers can easily traverse the entire nation with the NCMC card. Along with facilitating smooth mobility, this also helps travelers save time and energy.
9. What pricing options are available for accessing the report?
Pricing options include single-user, multi-user, and enterprise licenses priced at USD 4750, USD 5250, and USD 8750 respectively.
10. Is the market size provided in terms of value or volume?
The market size is provided in terms of value, measured in Million and volume, measured in K Unit.
11. Are there any specific market keywords associated with the report?
Yes, the market keyword associated with the report is "Smart Card Industry," which aids in identifying and referencing the specific market segment covered.
12. How do I determine which pricing option suits my needs best?
The pricing options vary based on user requirements and access needs. Individual users may opt for single-user licenses, while businesses requiring broader access may choose multi-user or enterprise licenses for cost-effective access to the report.
13. Are there any additional resources or data provided in the Smart Card Industry report?
While the report offers comprehensive insights, it's advisable to review the specific contents or supplementary materials provided to ascertain if additional resources or data are available.
14. How can I stay updated on further developments or reports in the Smart Card Industry?
To stay informed about further developments, trends, and reports in the Smart Card Industry, consider subscribing to industry newsletters, following relevant companies and organizations, or regularly checking reputable industry news sources and publications.
Methodology
Step 1 - Identification of Relevant Samples Size from Population Database


Step 2 - Approaches for Defining Global Market Size (Value, Volume* & Price*)

Note*: In applicable scenarios
Step 3 - Data Sources
Primary Research
- Web Analytics
- Survey Reports
- Research Institute
- Latest Research Reports
- Opinion Leaders
Secondary Research
- Annual Reports
- White Paper
- Latest Press Release
- Industry Association
- Paid Database
- Investor Presentations

Step 4 - Data Triangulation
Involves using different sources of information in order to increase the validity of a study
These sources are likely to be stakeholders in a program - participants, other researchers, program staff, other community members, and so on.
Then we put all data in single framework & apply various statistical tools to find out the dynamic on the market.
During the analysis stage, feedback from the stakeholder groups would be compared to determine areas of agreement as well as areas of divergence