

Key Insights
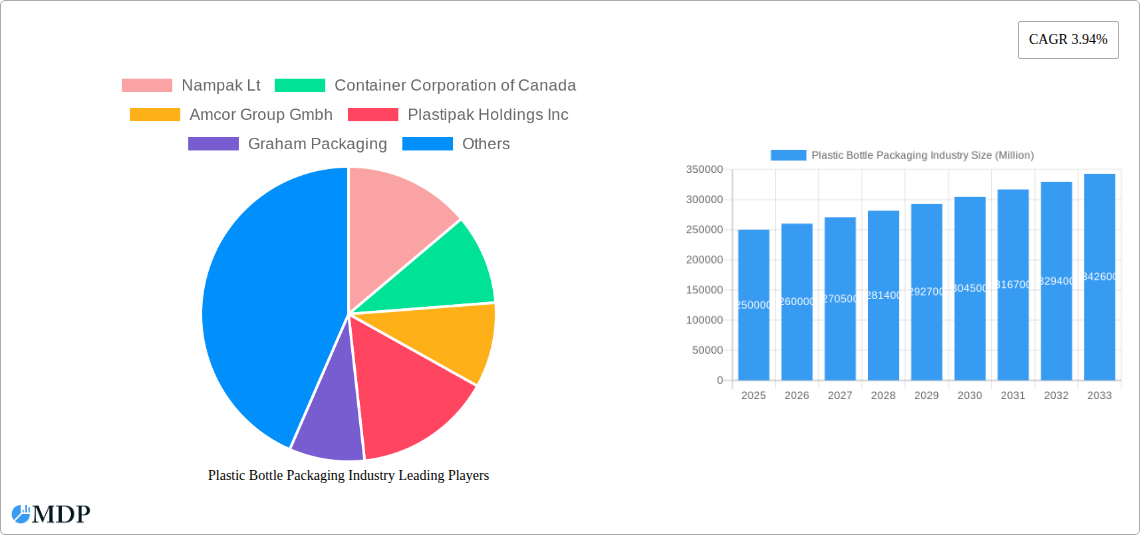
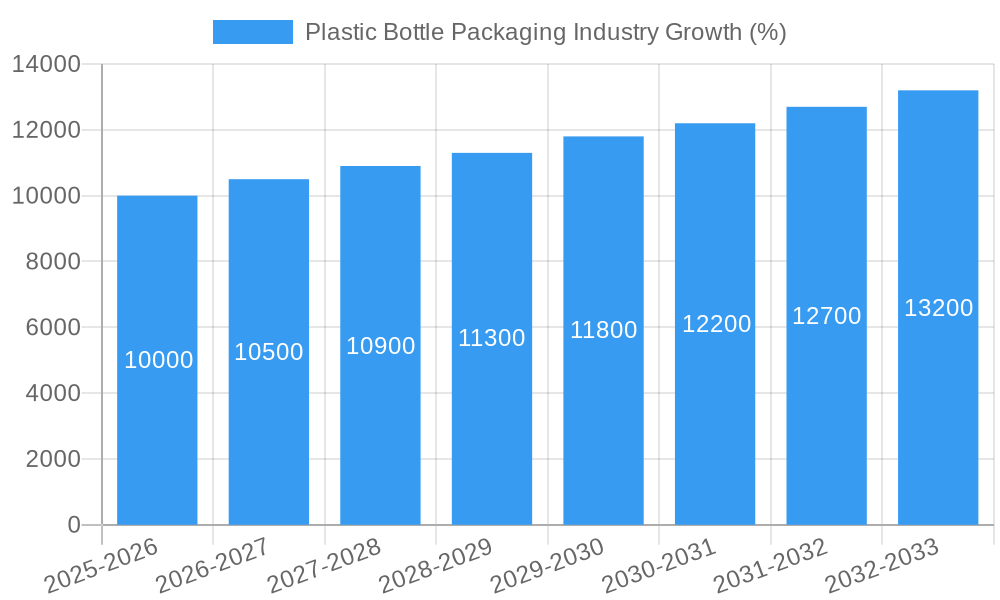
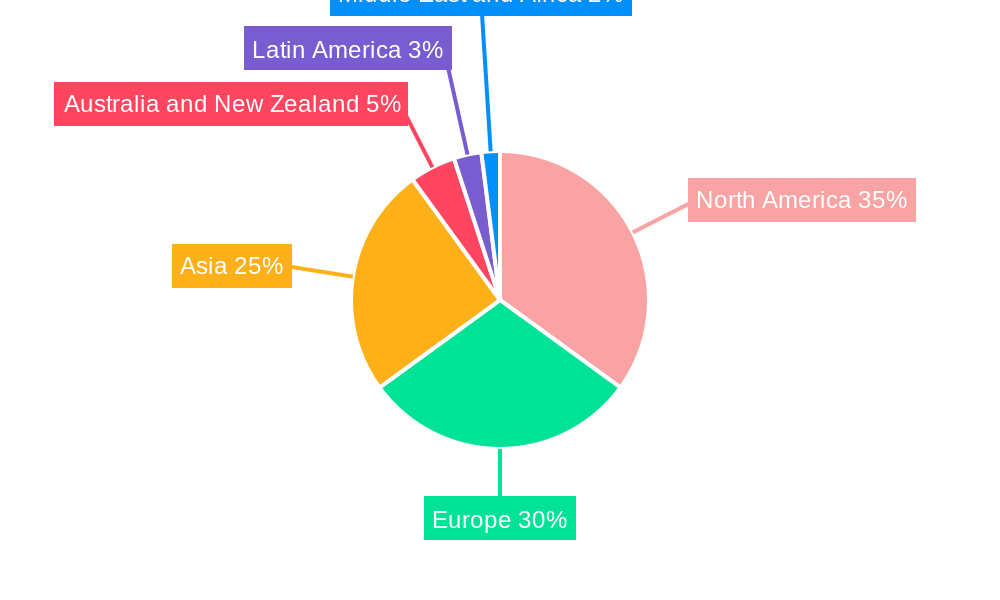
The global plastic bottle packaging market is experiencing steady growth, projected to maintain a Compound Annual Growth Rate (CAGR) of 3.94% from 2025 to 2033. This expansion is driven by several key factors. The burgeoning beverage industry, particularly the rise of bottled water and ready-to-drink beverages, fuels significant demand. Furthermore, the increasing preference for convenient and lightweight packaging across various sectors like food, cosmetics, and pharmaceuticals continues to boost market size. Technological advancements in plastic materials, leading to improved barrier properties, recyclability, and lighter weight bottles, further contribute to market growth. However, growing environmental concerns regarding plastic waste and stringent regulations aimed at reducing plastic pollution pose significant restraints. The market is segmented by material type (PET, PP, LDPE, HDPE, and others), with PET currently dominating due to its superior properties and recyclability. By end-user vertical, beverages hold the largest market share, followed by food and cosmetics. Key players like Amcor, Berry Global, and Silgan Holdings are driving innovation and market consolidation through strategic acquisitions and product diversification. Regional variations exist, with North America and Europe holding significant market shares currently, while Asia-Pacific is expected to exhibit robust growth in the coming years due to increasing consumer spending and industrialization.
The competitive landscape is characterized by both large multinational corporations and smaller regional players. Successful companies focus on sustainable packaging solutions, catering to the growing consumer demand for eco-friendly options. This involves investing in research and development of biodegradable and recyclable plastics, as well as exploring alternative materials. The market is also witnessing a shift towards lightweighting of bottles to reduce transportation costs and environmental impact. The future of the plastic bottle packaging industry will depend on its ability to address the sustainability challenges while meeting the evolving needs of consumers and regulatory requirements. Strategic partnerships and collaborations within the value chain are becoming increasingly important for companies to navigate the complexities of this dynamic market. This includes collaborations with recyclers and waste management companies to improve plastic recycling rates and minimize environmental impact.
Dive deep into the dynamic world of plastic bottle packaging with our comprehensive market report. This in-depth analysis covers market size, segmentation, key players, industry trends, and future growth projections, providing actionable insights for stakeholders across the value chain. This report covers the period 2019-2033, with a focus on 2025.
Plastic Bottle Packaging Industry Market Dynamics & Concentration
The global plastic bottle packaging market, valued at $XX Million in 2024, is projected to reach $XX Million by 2033, exhibiting a CAGR of XX% during the forecast period (2025-2033). Market concentration is moderate, with several key players holding significant shares, while a large number of smaller companies compete in niche segments.
Market Concentration:
- High level of competition among existing players
- Market share of top 5 players: XX% in 2024, projected to XX% in 2033.
- Significant M&A activity, with XX major deals recorded in the historical period (2019-2024). This signifies a consolidation trend within the industry.
Innovation Drivers:
- Lightweighting of bottles to reduce material costs and environmental impact.
- Development of sustainable and recyclable materials (e.g., rPET).
- Advanced closure technologies improving convenience and tamper evidence.
Regulatory Frameworks:
- Growing regulations on plastic waste management and recycling are shaping industry practices.
- Extended Producer Responsibility (EPR) schemes are influencing material choices and packaging design.
- Regulations vary significantly across regions, leading to diverse approaches.
Product Substitutes:
- Glass, aluminum, and paper-based alternatives are gaining traction in specific segments.
- The competitive pressure from substitutes is expected to influence market growth and innovation.
End-User Trends:
- Increasing demand for convenient packaging drives the industry growth.
- Growing preference for sustainable and eco-friendly options is impacting material selection.
- Changing consumer preferences in terms of size, design, and functionality are continually influencing product innovation.
Plastic Bottle Packaging Industry Industry Trends & Analysis
The plastic bottle packaging market is characterized by several significant trends influencing its growth trajectory. The market is experiencing robust growth fueled by the rising demand for packaged beverages, food, and other consumer goods. Technological advancements in materials science and manufacturing processes are enabling the creation of lighter, more durable, and sustainable packaging solutions. Consumer preferences are shifting towards environmentally friendly alternatives, driving the adoption of recycled and biodegradable materials. Furthermore, the market is witnessing intense competition among established players and emerging startups, leading to innovations and strategic partnerships.
The global market witnessed a CAGR of XX% from 2019 to 2024, with significant penetration into emerging economies. The estimated market size for 2025 is projected to be $XX Million, exhibiting a market penetration rate of XX% in key regions. The forecast period (2025-2033) is projected to see a CAGR of XX%, driven by sustained demand and technological breakthroughs.
Leading Markets & Segments in Plastic Bottle Packaging Industry
The Asia-Pacific region currently dominates the global plastic bottle packaging market, driven by rapid economic growth, rising disposable incomes, and expanding populations. Within the region, China and India stand out as particularly significant markets. Europe and North America also hold substantial market shares.
By Material:
PET: Largest segment due to its clarity, strength, and recyclability, primarily used in beverage packaging. Key drivers include high demand from the beverage industry, favorable material properties, and cost-effectiveness.
HDPE: Significant presence in food, household care, and personal care applications. Its durability and chemical resistance are key attributes.
PP: Growing usage for applications requiring high temperature resistance and chemical inertness. Increasing demand in the food and pharmaceuticals industries fuels this segment's growth.
LDPE: Smaller market share, primarily in flexible packaging for non-food items.
Other Material Types: Includes bioplastics and other emerging materials that have a growing presence, driven by sustainability concerns.
By End-user Vertical:
Beverages: Largest segment, driven by the high consumption of soft drinks, bottled water, and juices.
Food: Significant usage for packaging edible oils, sauces, and other food products.
Cosmetics & Pharmaceuticals: Growing demand for specialized packaging solutions.
Plastic Bottle Packaging Industry Product Developments
Recent product innovations focus on sustainable materials, lightweighting, improved barrier properties, and smart packaging technologies. Recycled PET (rPET) is gaining prominence, alongside bio-based plastics. Innovative closures and tamper-evident designs enhance product safety and consumer experience. These advancements cater to growing demands for eco-friendly, efficient, and secure packaging solutions.
Key Drivers of Plastic Bottle Packaging Industry Growth
The growth of the plastic bottle packaging industry is propelled by several key factors:
- The continuous rise in global consumption of packaged goods, especially beverages and food products.
- Technological advancements enabling the development of lightweight, high-barrier, and recyclable materials.
- Growing consumer awareness about product safety and convenience drives demand for sophisticated packaging solutions.
Challenges in the Plastic Bottle Packaging Industry Market
The industry faces significant challenges, including:
- Stricter environmental regulations and growing pressure to reduce plastic waste.
- Fluctuating raw material prices, impacting production costs.
- Intense competition and the need for continuous innovation to maintain market share.
Emerging Opportunities in Plastic Bottle Packaging Industry
Significant opportunities lie in the development and adoption of sustainable packaging solutions, strategic partnerships for waste management, and expansion into emerging markets. Growth in the use of recycled content and the exploration of innovative bioplastics hold significant potential.
Leading Players in the Plastic Bottle Packaging Industry Sector
- Nampak Ltd
- Container Corporation of Canada
- Amcor Group GmbH
- Plastipak Holdings Inc
- Graham Packaging
- Retal Industries Limited
- Comar
- Berry Global Inc
- Resilux NV
- Apex Plastics (Container Services Inc)
- Silgan Holdings Inc
- Gerresheimer AG
- Greiner Packaging International GmbH
- Altium Packaging
- ALPLA Group
Key Milestones in Plastic Bottle Packaging Industry Industry
November 2023: ALPLA Group expands into North Africa, acquiring a majority shareholding in Atlantic Packaging and establishing a joint venture. This significantly increases their production capacity and market reach in the region.
October 2023: Coca-Cola's commitment to 100% recycled plastic bottles in Ireland and India marks a substantial shift towards sustainable packaging, influencing industry practices and consumer perception.
Strategic Outlook for Plastic Bottle Packaging Industry Market
The future of the plastic bottle packaging market is bright, driven by increasing demand, technological advancements, and a growing focus on sustainability. Strategic opportunities include investing in recycled content, developing innovative materials, and establishing robust supply chains. Companies that prioritize sustainability and innovation are poised for significant growth in the coming years.
Plastic Bottle Packaging Industry Segmentation
-
1. Material
- 1.1. Polyethylene Terephthalate (PET)
- 1.2. Polypropylene (PP)
- 1.3. Low-density Polyethylene (LDPE)
- 1.4. High-density Polyethylene (HDPE)
- 1.5. Other Material Types
-
2. End-user Vertical
- 2.1. Beverages
- 2.2. Food
- 2.3. Cosmetics
- 2.4. Pharmaceuticals
- 2.5. Household Care
- 2.6. Other End-user Verticals
Plastic Bottle Packaging Industry Segmentation By Geography
- 1. North America
- 2. Europe
- 3. Asia
- 4. Australia and New Zealand
- 5. Latin America
- 6. Middle East and Africa
Plastic Bottle Packaging Industry REPORT HIGHLIGHTS
| Aspects | Details |
|---|---|
| Study Period | 2019-2033 |
| Base Year | 2024 |
| Estimated Year | 2025 |
| Forecast Period | 2025-2033 |
| Historical Period | 2019-2024 |
| Growth Rate | CAGR of 3.94% from 2019-2033 |
| Segmentation |
|
Table of Contents
- 1. Introduction
- 1.1. Research Scope
- 1.2. Market Segmentation
- 1.3. Research Methodology
- 1.4. Definitions and Assumptions
- 2. Executive Summary
- 2.1. Introduction
- 3. Market Dynamics
- 3.1. Introduction
- 3.2. Market Drivers
- 3.2.1. Increasing Adoption of Lightweight Packaging Methods
- 3.3. Market Restrains
- 3.3.1. Environmental Concerns Regarding Use of Plastics
- 3.4. Market Trends
- 3.4.1. Beverage Segment to Witness Major Growth
- 4. Market Factor Analysis
- 4.1. Porters Five Forces
- 4.2. Supply/Value Chain
- 4.3. PESTEL analysis
- 4.4. Market Entropy
- 4.5. Patent/Trademark Analysis
- 5. Global Plastic Bottle Packaging Industry Analysis, Insights and Forecast, 2019-2031
- 5.1. Market Analysis, Insights and Forecast - by Material
- 5.1.1. Polyethylene Terephthalate (PET)
- 5.1.2. Polypropylene (PP)
- 5.1.3. Low-density Polyethylene (LDPE)
- 5.1.4. High-density Polyethylene (HDPE)
- 5.1.5. Other Material Types
- 5.2. Market Analysis, Insights and Forecast - by End-user Vertical
- 5.2.1. Beverages
- 5.2.2. Food
- 5.2.3. Cosmetics
- 5.2.4. Pharmaceuticals
- 5.2.5. Household Care
- 5.2.6. Other End-user Verticals
- 5.3. Market Analysis, Insights and Forecast - by Region
- 5.3.1. North America
- 5.3.2. Europe
- 5.3.3. Asia
- 5.3.4. Australia and New Zealand
- 5.3.5. Latin America
- 5.3.6. Middle East and Africa
- 5.1. Market Analysis, Insights and Forecast - by Material
- 6. North America Plastic Bottle Packaging Industry Analysis, Insights and Forecast, 2019-2031
- 6.1. Market Analysis, Insights and Forecast - by Material
- 6.1.1. Polyethylene Terephthalate (PET)
- 6.1.2. Polypropylene (PP)
- 6.1.3. Low-density Polyethylene (LDPE)
- 6.1.4. High-density Polyethylene (HDPE)
- 6.1.5. Other Material Types
- 6.2. Market Analysis, Insights and Forecast - by End-user Vertical
- 6.2.1. Beverages
- 6.2.2. Food
- 6.2.3. Cosmetics
- 6.2.4. Pharmaceuticals
- 6.2.5. Household Care
- 6.2.6. Other End-user Verticals
- 6.1. Market Analysis, Insights and Forecast - by Material
- 7. Europe Plastic Bottle Packaging Industry Analysis, Insights and Forecast, 2019-2031
- 7.1. Market Analysis, Insights and Forecast - by Material
- 7.1.1. Polyethylene Terephthalate (PET)
- 7.1.2. Polypropylene (PP)
- 7.1.3. Low-density Polyethylene (LDPE)
- 7.1.4. High-density Polyethylene (HDPE)
- 7.1.5. Other Material Types
- 7.2. Market Analysis, Insights and Forecast - by End-user Vertical
- 7.2.1. Beverages
- 7.2.2. Food
- 7.2.3. Cosmetics
- 7.2.4. Pharmaceuticals
- 7.2.5. Household Care
- 7.2.6. Other End-user Verticals
- 7.1. Market Analysis, Insights and Forecast - by Material
- 8. Asia Plastic Bottle Packaging Industry Analysis, Insights and Forecast, 2019-2031
- 8.1. Market Analysis, Insights and Forecast - by Material
- 8.1.1. Polyethylene Terephthalate (PET)
- 8.1.2. Polypropylene (PP)
- 8.1.3. Low-density Polyethylene (LDPE)
- 8.1.4. High-density Polyethylene (HDPE)
- 8.1.5. Other Material Types
- 8.2. Market Analysis, Insights and Forecast - by End-user Vertical
- 8.2.1. Beverages
- 8.2.2. Food
- 8.2.3. Cosmetics
- 8.2.4. Pharmaceuticals
- 8.2.5. Household Care
- 8.2.6. Other End-user Verticals
- 8.1. Market Analysis, Insights and Forecast - by Material
- 9. Australia and New Zealand Plastic Bottle Packaging Industry Analysis, Insights and Forecast, 2019-2031
- 9.1. Market Analysis, Insights and Forecast - by Material
- 9.1.1. Polyethylene Terephthalate (PET)
- 9.1.2. Polypropylene (PP)
- 9.1.3. Low-density Polyethylene (LDPE)
- 9.1.4. High-density Polyethylene (HDPE)
- 9.1.5. Other Material Types
- 9.2. Market Analysis, Insights and Forecast - by End-user Vertical
- 9.2.1. Beverages
- 9.2.2. Food
- 9.2.3. Cosmetics
- 9.2.4. Pharmaceuticals
- 9.2.5. Household Care
- 9.2.6. Other End-user Verticals
- 9.1. Market Analysis, Insights and Forecast - by Material
- 10. Latin America Plastic Bottle Packaging Industry Analysis, Insights and Forecast, 2019-2031
- 10.1. Market Analysis, Insights and Forecast - by Material
- 10.1.1. Polyethylene Terephthalate (PET)
- 10.1.2. Polypropylene (PP)
- 10.1.3. Low-density Polyethylene (LDPE)
- 10.1.4. High-density Polyethylene (HDPE)
- 10.1.5. Other Material Types
- 10.2. Market Analysis, Insights and Forecast - by End-user Vertical
- 10.2.1. Beverages
- 10.2.2. Food
- 10.2.3. Cosmetics
- 10.2.4. Pharmaceuticals
- 10.2.5. Household Care
- 10.2.6. Other End-user Verticals
- 10.1. Market Analysis, Insights and Forecast - by Material
- 11. Middle East and Africa Plastic Bottle Packaging Industry Analysis, Insights and Forecast, 2019-2031
- 11.1. Market Analysis, Insights and Forecast - by Material
- 11.1.1. Polyethylene Terephthalate (PET)
- 11.1.2. Polypropylene (PP)
- 11.1.3. Low-density Polyethylene (LDPE)
- 11.1.4. High-density Polyethylene (HDPE)
- 11.1.5. Other Material Types
- 11.2. Market Analysis, Insights and Forecast - by End-user Vertical
- 11.2.1. Beverages
- 11.2.2. Food
- 11.2.3. Cosmetics
- 11.2.4. Pharmaceuticals
- 11.2.5. Household Care
- 11.2.6. Other End-user Verticals
- 11.1. Market Analysis, Insights and Forecast - by Material
- 12. North America Plastic Bottle Packaging Industry Analysis, Insights and Forecast, 2019-2031
- 12.1. Market Analysis, Insights and Forecast - By Country/Sub-region
- 12.1.1.
- 13. Europe Plastic Bottle Packaging Industry Analysis, Insights and Forecast, 2019-2031
- 13.1. Market Analysis, Insights and Forecast - By Country/Sub-region
- 13.1.1.
- 14. Asia Plastic Bottle Packaging Industry Analysis, Insights and Forecast, 2019-2031
- 14.1. Market Analysis, Insights and Forecast - By Country/Sub-region
- 14.1.1.
- 15. Australia and New Zealand Plastic Bottle Packaging Industry Analysis, Insights and Forecast, 2019-2031
- 15.1. Market Analysis, Insights and Forecast - By Country/Sub-region
- 15.1.1.
- 16. Latin America Plastic Bottle Packaging Industry Analysis, Insights and Forecast, 2019-2031
- 16.1. Market Analysis, Insights and Forecast - By Country/Sub-region
- 16.1.1.
- 17. Middle East and Africa Plastic Bottle Packaging Industry Analysis, Insights and Forecast, 2019-2031
- 17.1. Market Analysis, Insights and Forecast - By Country/Sub-region
- 17.1.1.
- 18. Competitive Analysis
- 18.1. Global Market Share Analysis 2024
- 18.2. Company Profiles
- 18.2.1 Nampak Lt
- 18.2.1.1. Overview
- 18.2.1.2. Products
- 18.2.1.3. SWOT Analysis
- 18.2.1.4. Recent Developments
- 18.2.1.5. Financials (Based on Availability)
- 18.2.2 Container Corporation of Canada
- 18.2.2.1. Overview
- 18.2.2.2. Products
- 18.2.2.3. SWOT Analysis
- 18.2.2.4. Recent Developments
- 18.2.2.5. Financials (Based on Availability)
- 18.2.3 Amcor Group Gmbh
- 18.2.3.1. Overview
- 18.2.3.2. Products
- 18.2.3.3. SWOT Analysis
- 18.2.3.4. Recent Developments
- 18.2.3.5. Financials (Based on Availability)
- 18.2.4 Plastipak Holdings Inc
- 18.2.4.1. Overview
- 18.2.4.2. Products
- 18.2.4.3. SWOT Analysis
- 18.2.4.4. Recent Developments
- 18.2.4.5. Financials (Based on Availability)
- 18.2.5 Graham Packaging
- 18.2.5.1. Overview
- 18.2.5.2. Products
- 18.2.5.3. SWOT Analysis
- 18.2.5.4. Recent Developments
- 18.2.5.5. Financials (Based on Availability)
- 18.2.6 Retal Industries Limited
- 18.2.6.1. Overview
- 18.2.6.2. Products
- 18.2.6.3. SWOT Analysis
- 18.2.6.4. Recent Developments
- 18.2.6.5. Financials (Based on Availability)
- 18.2.7 Comar
- 18.2.7.1. Overview
- 18.2.7.2. Products
- 18.2.7.3. SWOT Analysis
- 18.2.7.4. Recent Developments
- 18.2.7.5. Financials (Based on Availability)
- 18.2.8 Berry Global Inc
- 18.2.8.1. Overview
- 18.2.8.2. Products
- 18.2.8.3. SWOT Analysis
- 18.2.8.4. Recent Developments
- 18.2.8.5. Financials (Based on Availability)
- 18.2.9 Resilux NV
- 18.2.9.1. Overview
- 18.2.9.2. Products
- 18.2.9.3. SWOT Analysis
- 18.2.9.4. Recent Developments
- 18.2.9.5. Financials (Based on Availability)
- 18.2.10 Apex Plastics (Container Services Inc )
- 18.2.10.1. Overview
- 18.2.10.2. Products
- 18.2.10.3. SWOT Analysis
- 18.2.10.4. Recent Developments
- 18.2.10.5. Financials (Based on Availability)
- 18.2.11 Silgan Holdings Inc
- 18.2.11.1. Overview
- 18.2.11.2. Products
- 18.2.11.3. SWOT Analysis
- 18.2.11.4. Recent Developments
- 18.2.11.5. Financials (Based on Availability)
- 18.2.12 Gerresheimer AG
- 18.2.12.1. Overview
- 18.2.12.2. Products
- 18.2.12.3. SWOT Analysis
- 18.2.12.4. Recent Developments
- 18.2.12.5. Financials (Based on Availability)
- 18.2.13 Greiner Packaging International Gmbh
- 18.2.13.1. Overview
- 18.2.13.2. Products
- 18.2.13.3. SWOT Analysis
- 18.2.13.4. Recent Developments
- 18.2.13.5. Financials (Based on Availability)
- 18.2.14 Altium Packaging
- 18.2.14.1. Overview
- 18.2.14.2. Products
- 18.2.14.3. SWOT Analysis
- 18.2.14.4. Recent Developments
- 18.2.14.5. Financials (Based on Availability)
- 18.2.15 ALPLA Group
- 18.2.15.1. Overview
- 18.2.15.2. Products
- 18.2.15.3. SWOT Analysis
- 18.2.15.4. Recent Developments
- 18.2.15.5. Financials (Based on Availability)
- 18.2.1 Nampak Lt
List of Figures
- Figure 1: Global Plastic Bottle Packaging Industry Revenue Breakdown (Million, %) by Region 2024 & 2032
- Figure 2: Global Plastic Bottle Packaging Industry Volume Breakdown (Million, %) by Region 2024 & 2032
- Figure 3: North America Plastic Bottle Packaging Industry Revenue (Million), by Country 2024 & 2032
- Figure 4: North America Plastic Bottle Packaging Industry Volume (Million), by Country 2024 & 2032
- Figure 5: North America Plastic Bottle Packaging Industry Revenue Share (%), by Country 2024 & 2032
- Figure 6: North America Plastic Bottle Packaging Industry Volume Share (%), by Country 2024 & 2032
- Figure 7: Europe Plastic Bottle Packaging Industry Revenue (Million), by Country 2024 & 2032
- Figure 8: Europe Plastic Bottle Packaging Industry Volume (Million), by Country 2024 & 2032
- Figure 9: Europe Plastic Bottle Packaging Industry Revenue Share (%), by Country 2024 & 2032
- Figure 10: Europe Plastic Bottle Packaging Industry Volume Share (%), by Country 2024 & 2032
- Figure 11: Asia Plastic Bottle Packaging Industry Revenue (Million), by Country 2024 & 2032
- Figure 12: Asia Plastic Bottle Packaging Industry Volume (Million), by Country 2024 & 2032
- Figure 13: Asia Plastic Bottle Packaging Industry Revenue Share (%), by Country 2024 & 2032
- Figure 14: Asia Plastic Bottle Packaging Industry Volume Share (%), by Country 2024 & 2032
- Figure 15: Australia and New Zealand Plastic Bottle Packaging Industry Revenue (Million), by Country 2024 & 2032
- Figure 16: Australia and New Zealand Plastic Bottle Packaging Industry Volume (Million), by Country 2024 & 2032
- Figure 17: Australia and New Zealand Plastic Bottle Packaging Industry Revenue Share (%), by Country 2024 & 2032
- Figure 18: Australia and New Zealand Plastic Bottle Packaging Industry Volume Share (%), by Country 2024 & 2032
- Figure 19: Latin America Plastic Bottle Packaging Industry Revenue (Million), by Country 2024 & 2032
- Figure 20: Latin America Plastic Bottle Packaging Industry Volume (Million), by Country 2024 & 2032
- Figure 21: Latin America Plastic Bottle Packaging Industry Revenue Share (%), by Country 2024 & 2032
- Figure 22: Latin America Plastic Bottle Packaging Industry Volume Share (%), by Country 2024 & 2032
- Figure 23: Middle East and Africa Plastic Bottle Packaging Industry Revenue (Million), by Country 2024 & 2032
- Figure 24: Middle East and Africa Plastic Bottle Packaging Industry Volume (Million), by Country 2024 & 2032
- Figure 25: Middle East and Africa Plastic Bottle Packaging Industry Revenue Share (%), by Country 2024 & 2032
- Figure 26: Middle East and Africa Plastic Bottle Packaging Industry Volume Share (%), by Country 2024 & 2032
- Figure 27: North America Plastic Bottle Packaging Industry Revenue (Million), by Material 2024 & 2032
- Figure 28: North America Plastic Bottle Packaging Industry Volume (Million), by Material 2024 & 2032
- Figure 29: North America Plastic Bottle Packaging Industry Revenue Share (%), by Material 2024 & 2032
- Figure 30: North America Plastic Bottle Packaging Industry Volume Share (%), by Material 2024 & 2032
- Figure 31: North America Plastic Bottle Packaging Industry Revenue (Million), by End-user Vertical 2024 & 2032
- Figure 32: North America Plastic Bottle Packaging Industry Volume (Million), by End-user Vertical 2024 & 2032
- Figure 33: North America Plastic Bottle Packaging Industry Revenue Share (%), by End-user Vertical 2024 & 2032
- Figure 34: North America Plastic Bottle Packaging Industry Volume Share (%), by End-user Vertical 2024 & 2032
- Figure 35: North America Plastic Bottle Packaging Industry Revenue (Million), by Country 2024 & 2032
- Figure 36: North America Plastic Bottle Packaging Industry Volume (Million), by Country 2024 & 2032
- Figure 37: North America Plastic Bottle Packaging Industry Revenue Share (%), by Country 2024 & 2032
- Figure 38: North America Plastic Bottle Packaging Industry Volume Share (%), by Country 2024 & 2032
- Figure 39: Europe Plastic Bottle Packaging Industry Revenue (Million), by Material 2024 & 2032
- Figure 40: Europe Plastic Bottle Packaging Industry Volume (Million), by Material 2024 & 2032
- Figure 41: Europe Plastic Bottle Packaging Industry Revenue Share (%), by Material 2024 & 2032
- Figure 42: Europe Plastic Bottle Packaging Industry Volume Share (%), by Material 2024 & 2032
- Figure 43: Europe Plastic Bottle Packaging Industry Revenue (Million), by End-user Vertical 2024 & 2032
- Figure 44: Europe Plastic Bottle Packaging Industry Volume (Million), by End-user Vertical 2024 & 2032
- Figure 45: Europe Plastic Bottle Packaging Industry Revenue Share (%), by End-user Vertical 2024 & 2032
- Figure 46: Europe Plastic Bottle Packaging Industry Volume Share (%), by End-user Vertical 2024 & 2032
- Figure 47: Europe Plastic Bottle Packaging Industry Revenue (Million), by Country 2024 & 2032
- Figure 48: Europe Plastic Bottle Packaging Industry Volume (Million), by Country 2024 & 2032
- Figure 49: Europe Plastic Bottle Packaging Industry Revenue Share (%), by Country 2024 & 2032
- Figure 50: Europe Plastic Bottle Packaging Industry Volume Share (%), by Country 2024 & 2032
- Figure 51: Asia Plastic Bottle Packaging Industry Revenue (Million), by Material 2024 & 2032
- Figure 52: Asia Plastic Bottle Packaging Industry Volume (Million), by Material 2024 & 2032
- Figure 53: Asia Plastic Bottle Packaging Industry Revenue Share (%), by Material 2024 & 2032
- Figure 54: Asia Plastic Bottle Packaging Industry Volume Share (%), by Material 2024 & 2032
- Figure 55: Asia Plastic Bottle Packaging Industry Revenue (Million), by End-user Vertical 2024 & 2032
- Figure 56: Asia Plastic Bottle Packaging Industry Volume (Million), by End-user Vertical 2024 & 2032
- Figure 57: Asia Plastic Bottle Packaging Industry Revenue Share (%), by End-user Vertical 2024 & 2032
- Figure 58: Asia Plastic Bottle Packaging Industry Volume Share (%), by End-user Vertical 2024 & 2032
- Figure 59: Asia Plastic Bottle Packaging Industry Revenue (Million), by Country 2024 & 2032
- Figure 60: Asia Plastic Bottle Packaging Industry Volume (Million), by Country 2024 & 2032
- Figure 61: Asia Plastic Bottle Packaging Industry Revenue Share (%), by Country 2024 & 2032
- Figure 62: Asia Plastic Bottle Packaging Industry Volume Share (%), by Country 2024 & 2032
- Figure 63: Australia and New Zealand Plastic Bottle Packaging Industry Revenue (Million), by Material 2024 & 2032
- Figure 64: Australia and New Zealand Plastic Bottle Packaging Industry Volume (Million), by Material 2024 & 2032
- Figure 65: Australia and New Zealand Plastic Bottle Packaging Industry Revenue Share (%), by Material 2024 & 2032
- Figure 66: Australia and New Zealand Plastic Bottle Packaging Industry Volume Share (%), by Material 2024 & 2032
- Figure 67: Australia and New Zealand Plastic Bottle Packaging Industry Revenue (Million), by End-user Vertical 2024 & 2032
- Figure 68: Australia and New Zealand Plastic Bottle Packaging Industry Volume (Million), by End-user Vertical 2024 & 2032
- Figure 69: Australia and New Zealand Plastic Bottle Packaging Industry Revenue Share (%), by End-user Vertical 2024 & 2032
- Figure 70: Australia and New Zealand Plastic Bottle Packaging Industry Volume Share (%), by End-user Vertical 2024 & 2032
- Figure 71: Australia and New Zealand Plastic Bottle Packaging Industry Revenue (Million), by Country 2024 & 2032
- Figure 72: Australia and New Zealand Plastic Bottle Packaging Industry Volume (Million), by Country 2024 & 2032
- Figure 73: Australia and New Zealand Plastic Bottle Packaging Industry Revenue Share (%), by Country 2024 & 2032
- Figure 74: Australia and New Zealand Plastic Bottle Packaging Industry Volume Share (%), by Country 2024 & 2032
- Figure 75: Latin America Plastic Bottle Packaging Industry Revenue (Million), by Material 2024 & 2032
- Figure 76: Latin America Plastic Bottle Packaging Industry Volume (Million), by Material 2024 & 2032
- Figure 77: Latin America Plastic Bottle Packaging Industry Revenue Share (%), by Material 2024 & 2032
- Figure 78: Latin America Plastic Bottle Packaging Industry Volume Share (%), by Material 2024 & 2032
- Figure 79: Latin America Plastic Bottle Packaging Industry Revenue (Million), by End-user Vertical 2024 & 2032
- Figure 80: Latin America Plastic Bottle Packaging Industry Volume (Million), by End-user Vertical 2024 & 2032
- Figure 81: Latin America Plastic Bottle Packaging Industry Revenue Share (%), by End-user Vertical 2024 & 2032
- Figure 82: Latin America Plastic Bottle Packaging Industry Volume Share (%), by End-user Vertical 2024 & 2032
- Figure 83: Latin America Plastic Bottle Packaging Industry Revenue (Million), by Country 2024 & 2032
- Figure 84: Latin America Plastic Bottle Packaging Industry Volume (Million), by Country 2024 & 2032
- Figure 85: Latin America Plastic Bottle Packaging Industry Revenue Share (%), by Country 2024 & 2032
- Figure 86: Latin America Plastic Bottle Packaging Industry Volume Share (%), by Country 2024 & 2032
- Figure 87: Middle East and Africa Plastic Bottle Packaging Industry Revenue (Million), by Material 2024 & 2032
- Figure 88: Middle East and Africa Plastic Bottle Packaging Industry Volume (Million), by Material 2024 & 2032
- Figure 89: Middle East and Africa Plastic Bottle Packaging Industry Revenue Share (%), by Material 2024 & 2032
- Figure 90: Middle East and Africa Plastic Bottle Packaging Industry Volume Share (%), by Material 2024 & 2032
- Figure 91: Middle East and Africa Plastic Bottle Packaging Industry Revenue (Million), by End-user Vertical 2024 & 2032
- Figure 92: Middle East and Africa Plastic Bottle Packaging Industry Volume (Million), by End-user Vertical 2024 & 2032
- Figure 93: Middle East and Africa Plastic Bottle Packaging Industry Revenue Share (%), by End-user Vertical 2024 & 2032
- Figure 94: Middle East and Africa Plastic Bottle Packaging Industry Volume Share (%), by End-user Vertical 2024 & 2032
- Figure 95: Middle East and Africa Plastic Bottle Packaging Industry Revenue (Million), by Country 2024 & 2032
- Figure 96: Middle East and Africa Plastic Bottle Packaging Industry Volume (Million), by Country 2024 & 2032
- Figure 97: Middle East and Africa Plastic Bottle Packaging Industry Revenue Share (%), by Country 2024 & 2032
- Figure 98: Middle East and Africa Plastic Bottle Packaging Industry Volume Share (%), by Country 2024 & 2032
List of Tables
- Table 1: Global Plastic Bottle Packaging Industry Revenue Million Forecast, by Region 2019 & 2032
- Table 2: Global Plastic Bottle Packaging Industry Volume Million Forecast, by Region 2019 & 2032
- Table 3: Global Plastic Bottle Packaging Industry Revenue Million Forecast, by Material 2019 & 2032
- Table 4: Global Plastic Bottle Packaging Industry Volume Million Forecast, by Material 2019 & 2032
- Table 5: Global Plastic Bottle Packaging Industry Revenue Million Forecast, by End-user Vertical 2019 & 2032
- Table 6: Global Plastic Bottle Packaging Industry Volume Million Forecast, by End-user Vertical 2019 & 2032
- Table 7: Global Plastic Bottle Packaging Industry Revenue Million Forecast, by Region 2019 & 2032
- Table 8: Global Plastic Bottle Packaging Industry Volume Million Forecast, by Region 2019 & 2032
- Table 9: Global Plastic Bottle Packaging Industry Revenue Million Forecast, by Country 2019 & 2032
- Table 10: Global Plastic Bottle Packaging Industry Volume Million Forecast, by Country 2019 & 2032
- Table 11: Plastic Bottle Packaging Industry Revenue (Million) Forecast, by Application 2019 & 2032
- Table 12: Plastic Bottle Packaging Industry Volume (Million) Forecast, by Application 2019 & 2032
- Table 13: Global Plastic Bottle Packaging Industry Revenue Million Forecast, by Country 2019 & 2032
- Table 14: Global Plastic Bottle Packaging Industry Volume Million Forecast, by Country 2019 & 2032
- Table 15: Plastic Bottle Packaging Industry Revenue (Million) Forecast, by Application 2019 & 2032
- Table 16: Plastic Bottle Packaging Industry Volume (Million) Forecast, by Application 2019 & 2032
- Table 17: Global Plastic Bottle Packaging Industry Revenue Million Forecast, by Country 2019 & 2032
- Table 18: Global Plastic Bottle Packaging Industry Volume Million Forecast, by Country 2019 & 2032
- Table 19: Plastic Bottle Packaging Industry Revenue (Million) Forecast, by Application 2019 & 2032
- Table 20: Plastic Bottle Packaging Industry Volume (Million) Forecast, by Application 2019 & 2032
- Table 21: Global Plastic Bottle Packaging Industry Revenue Million Forecast, by Country 2019 & 2032
- Table 22: Global Plastic Bottle Packaging Industry Volume Million Forecast, by Country 2019 & 2032
- Table 23: Plastic Bottle Packaging Industry Revenue (Million) Forecast, by Application 2019 & 2032
- Table 24: Plastic Bottle Packaging Industry Volume (Million) Forecast, by Application 2019 & 2032
- Table 25: Global Plastic Bottle Packaging Industry Revenue Million Forecast, by Country 2019 & 2032
- Table 26: Global Plastic Bottle Packaging Industry Volume Million Forecast, by Country 2019 & 2032
- Table 27: Plastic Bottle Packaging Industry Revenue (Million) Forecast, by Application 2019 & 2032
- Table 28: Plastic Bottle Packaging Industry Volume (Million) Forecast, by Application 2019 & 2032
- Table 29: Global Plastic Bottle Packaging Industry Revenue Million Forecast, by Country 2019 & 2032
- Table 30: Global Plastic Bottle Packaging Industry Volume Million Forecast, by Country 2019 & 2032
- Table 31: Plastic Bottle Packaging Industry Revenue (Million) Forecast, by Application 2019 & 2032
- Table 32: Plastic Bottle Packaging Industry Volume (Million) Forecast, by Application 2019 & 2032
- Table 33: Global Plastic Bottle Packaging Industry Revenue Million Forecast, by Material 2019 & 2032
- Table 34: Global Plastic Bottle Packaging Industry Volume Million Forecast, by Material 2019 & 2032
- Table 35: Global Plastic Bottle Packaging Industry Revenue Million Forecast, by End-user Vertical 2019 & 2032
- Table 36: Global Plastic Bottle Packaging Industry Volume Million Forecast, by End-user Vertical 2019 & 2032
- Table 37: Global Plastic Bottle Packaging Industry Revenue Million Forecast, by Country 2019 & 2032
- Table 38: Global Plastic Bottle Packaging Industry Volume Million Forecast, by Country 2019 & 2032
- Table 39: Global Plastic Bottle Packaging Industry Revenue Million Forecast, by Material 2019 & 2032
- Table 40: Global Plastic Bottle Packaging Industry Volume Million Forecast, by Material 2019 & 2032
- Table 41: Global Plastic Bottle Packaging Industry Revenue Million Forecast, by End-user Vertical 2019 & 2032
- Table 42: Global Plastic Bottle Packaging Industry Volume Million Forecast, by End-user Vertical 2019 & 2032
- Table 43: Global Plastic Bottle Packaging Industry Revenue Million Forecast, by Country 2019 & 2032
- Table 44: Global Plastic Bottle Packaging Industry Volume Million Forecast, by Country 2019 & 2032
- Table 45: Global Plastic Bottle Packaging Industry Revenue Million Forecast, by Material 2019 & 2032
- Table 46: Global Plastic Bottle Packaging Industry Volume Million Forecast, by Material 2019 & 2032
- Table 47: Global Plastic Bottle Packaging Industry Revenue Million Forecast, by End-user Vertical 2019 & 2032
- Table 48: Global Plastic Bottle Packaging Industry Volume Million Forecast, by End-user Vertical 2019 & 2032
- Table 49: Global Plastic Bottle Packaging Industry Revenue Million Forecast, by Country 2019 & 2032
- Table 50: Global Plastic Bottle Packaging Industry Volume Million Forecast, by Country 2019 & 2032
- Table 51: Global Plastic Bottle Packaging Industry Revenue Million Forecast, by Material 2019 & 2032
- Table 52: Global Plastic Bottle Packaging Industry Volume Million Forecast, by Material 2019 & 2032
- Table 53: Global Plastic Bottle Packaging Industry Revenue Million Forecast, by End-user Vertical 2019 & 2032
- Table 54: Global Plastic Bottle Packaging Industry Volume Million Forecast, by End-user Vertical 2019 & 2032
- Table 55: Global Plastic Bottle Packaging Industry Revenue Million Forecast, by Country 2019 & 2032
- Table 56: Global Plastic Bottle Packaging Industry Volume Million Forecast, by Country 2019 & 2032
- Table 57: Global Plastic Bottle Packaging Industry Revenue Million Forecast, by Material 2019 & 2032
- Table 58: Global Plastic Bottle Packaging Industry Volume Million Forecast, by Material 2019 & 2032
- Table 59: Global Plastic Bottle Packaging Industry Revenue Million Forecast, by End-user Vertical 2019 & 2032
- Table 60: Global Plastic Bottle Packaging Industry Volume Million Forecast, by End-user Vertical 2019 & 2032
- Table 61: Global Plastic Bottle Packaging Industry Revenue Million Forecast, by Country 2019 & 2032
- Table 62: Global Plastic Bottle Packaging Industry Volume Million Forecast, by Country 2019 & 2032
- Table 63: Global Plastic Bottle Packaging Industry Revenue Million Forecast, by Material 2019 & 2032
- Table 64: Global Plastic Bottle Packaging Industry Volume Million Forecast, by Material 2019 & 2032
- Table 65: Global Plastic Bottle Packaging Industry Revenue Million Forecast, by End-user Vertical 2019 & 2032
- Table 66: Global Plastic Bottle Packaging Industry Volume Million Forecast, by End-user Vertical 2019 & 2032
- Table 67: Global Plastic Bottle Packaging Industry Revenue Million Forecast, by Country 2019 & 2032
- Table 68: Global Plastic Bottle Packaging Industry Volume Million Forecast, by Country 2019 & 2032
Frequently Asked Questions
1. What is the projected Compound Annual Growth Rate (CAGR) of the Plastic Bottle Packaging Industry?
The projected CAGR is approximately 3.94%.
2. Which companies are prominent players in the Plastic Bottle Packaging Industry?
Key companies in the market include Nampak Lt, Container Corporation of Canada, Amcor Group Gmbh, Plastipak Holdings Inc, Graham Packaging, Retal Industries Limited, Comar, Berry Global Inc, Resilux NV, Apex Plastics (Container Services Inc ), Silgan Holdings Inc, Gerresheimer AG, Greiner Packaging International Gmbh, Altium Packaging, ALPLA Group.
3. What are the main segments of the Plastic Bottle Packaging Industry?
The market segments include Material, End-user Vertical.
4. Can you provide details about the market size?
The market size is estimated to be USD XX Million as of 2022.
5. What are some drivers contributing to market growth?
Increasing Adoption of Lightweight Packaging Methods.
6. What are the notable trends driving market growth?
Beverage Segment to Witness Major Growth.
7. Are there any restraints impacting market growth?
Environmental Concerns Regarding Use of Plastics.
8. Can you provide examples of recent developments in the market?
November 2023 - ALPLA Group is expanding its activities in North Africa and laying the foundation for growth across the Maghreb. In addition, the plastic packaging acquired a majority shareholding in Atlantic Packaging and set up a joint venture. The Tangier plant also produces plastic pallets and films and PET preforms for the beverages sector.
9. What pricing options are available for accessing the report?
Pricing options include single-user, multi-user, and enterprise licenses priced at USD 4750, USD 5250, and USD 8750 respectively.
10. Is the market size provided in terms of value or volume?
The market size is provided in terms of value, measured in Million and volume, measured in Million.
11. Are there any specific market keywords associated with the report?
Yes, the market keyword associated with the report is "Plastic Bottle Packaging Industry," which aids in identifying and referencing the specific market segment covered.
12. How do I determine which pricing option suits my needs best?
The pricing options vary based on user requirements and access needs. Individual users may opt for single-user licenses, while businesses requiring broader access may choose multi-user or enterprise licenses for cost-effective access to the report.
13. Are there any additional resources or data provided in the Plastic Bottle Packaging Industry report?
While the report offers comprehensive insights, it's advisable to review the specific contents or supplementary materials provided to ascertain if additional resources or data are available.
14. How can I stay updated on further developments or reports in the Plastic Bottle Packaging Industry?
To stay informed about further developments, trends, and reports in the Plastic Bottle Packaging Industry, consider subscribing to industry newsletters, following relevant companies and organizations, or regularly checking reputable industry news sources and publications.
Methodology
Step 1 - Identification of Relevant Samples Size from Population Database


Step 2 - Approaches for Defining Global Market Size (Value, Volume* & Price*)

Note*: In applicable scenarios
Step 3 - Data Sources
Primary Research
- Web Analytics
- Survey Reports
- Research Institute
- Latest Research Reports
- Opinion Leaders
Secondary Research
- Annual Reports
- White Paper
- Latest Press Release
- Industry Association
- Paid Database
- Investor Presentations

Step 4 - Data Triangulation
Involves using different sources of information in order to increase the validity of a study
These sources are likely to be stakeholders in a program - participants, other researchers, program staff, other community members, and so on.
Then we put all data in single framework & apply various statistical tools to find out the dynamic on the market.
During the analysis stage, feedback from the stakeholder groups would be compared to determine areas of agreement as well as areas of divergence
