

Key Insights
The global ophthalmic refraction chair unit market is experiencing robust growth, driven by the increasing prevalence of refractive errors globally, technological advancements leading to more sophisticated and comfortable units, and rising investments in eye care infrastructure, particularly in emerging economies. The market is segmented by application (hospital vs. clinic) and type (manual vs. automatic), with the automatic segment demonstrating faster growth due to its enhanced precision, efficiency, and reduced operator dependence. While the manual segment still holds a significant share, particularly in regions with lower healthcare expenditure, the shift towards automation is anticipated to accelerate in the coming years. Key players are focusing on product innovation, strategic partnerships, and geographic expansion to solidify their market positions. North America and Europe currently hold substantial market shares, owing to well-established healthcare infrastructure and high per capita healthcare spending. However, Asia-Pacific is expected to witness the fastest growth rate due to increasing awareness about eye health, rising disposable incomes, and a burgeoning middle class seeking improved healthcare services. Challenges include the high initial investment cost of advanced automatic units and the need for skilled personnel to operate and maintain them.
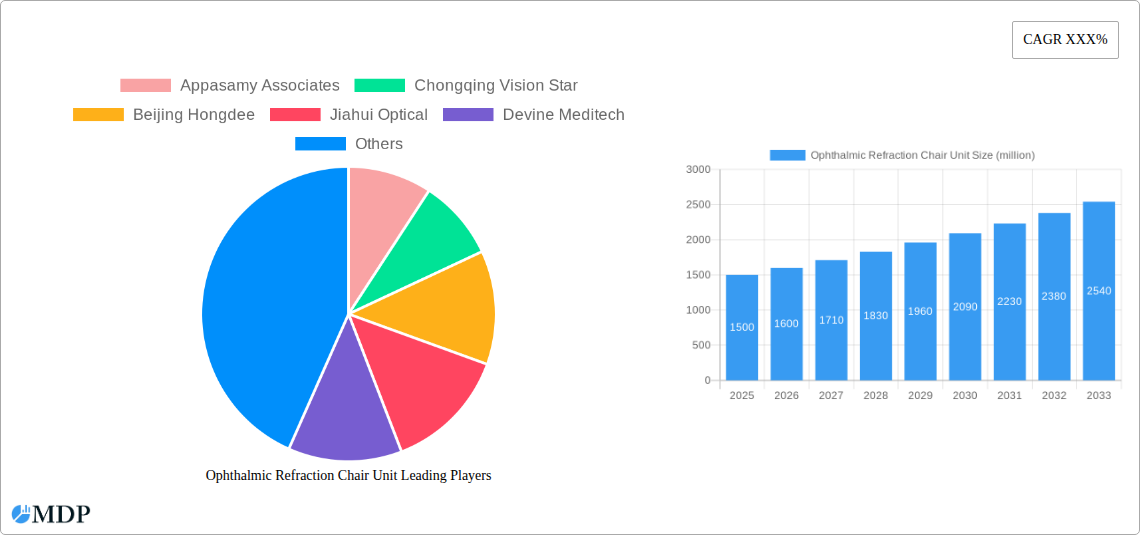
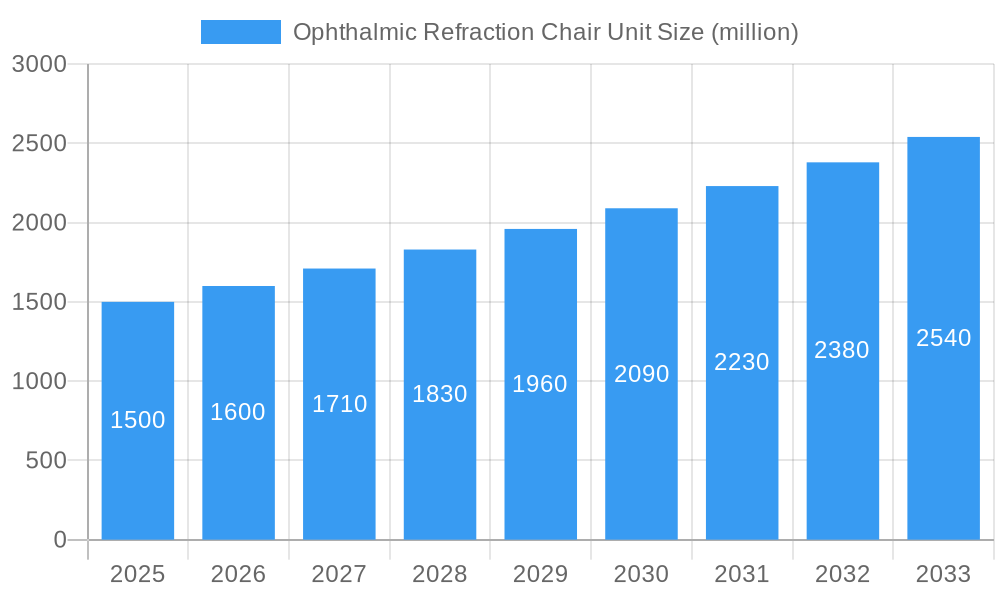
Ophthalmic Refraction Chair Unit Market Size (In Billion)
Despite these challenges, the long-term outlook for the ophthalmic refraction chair unit market remains positive. The growing geriatric population, an increasing number of individuals diagnosed with age-related vision impairments, and the rising adoption of comprehensive eye exams are expected to fuel market expansion. Furthermore, ongoing technological advancements such as integration of digital imaging and telemedicine capabilities are poised to further enhance the efficiency and precision of these units, driving market growth throughout the forecast period (2025-2033). Competitive pressures are likely to intensify as existing players innovate and new entrants emerge, potentially resulting in price reductions and enhanced product offerings for consumers. Successful players will be those who can effectively navigate these dynamics, offering both high-quality products and comprehensive after-sales support.
Ophthalmic Refraction Chair Unit Company Market Share
Ophthalmic Refraction Chair Unit Market Report: 2019-2033
This comprehensive report provides a detailed analysis of the Ophthalmic Refraction Chair Unit market, offering invaluable insights for industry stakeholders, investors, and businesses seeking to navigate this dynamic sector. The report covers the period 2019-2033, with a focus on the 2025-2033 forecast period and uses a base year of 2025. The market size is projected to reach millions of dollars by 2033, presenting significant growth opportunities.
Ophthalmic Refraction Chair Unit Market Dynamics & Concentration
The global Ophthalmic Refraction Chair Unit market is characterized by moderate concentration, with a few key players holding significant market share. The market's size in 2025 is estimated at $xx million. Appasamy Associates, Chongqing Vision Star, Beijing Hongdee, Jiahui Optical, Devine Meditech, and Plantech Medical are among the leading players, collectively accounting for an estimated xx% market share in 2025. Innovation in areas like automated features and integration with digital diagnostic tools drives market growth. Stringent regulatory frameworks concerning medical device approvals influence market entry and expansion. Existing products face minimal substitution pressure, although the emergence of advanced technologies could pose future challenges. End-user trends indicate a shift towards automated units in hospitals and clinics. The market has witnessed xx M&A deals in the historical period (2019-2024), indicating significant consolidation activity.
- Market Concentration: Moderately Concentrated
- Innovation Drivers: Automated features, digital integration, improved ergonomics.
- Regulatory Frameworks: Stringent medical device approvals.
- Product Substitutes: Minimal direct substitutes, potential for technological disruption.
- End-User Trends: Increasing preference for automated units in larger facilities.
- M&A Activity: xx deals between 2019 and 2024
Ophthalmic Refraction Chair Unit Industry Trends & Analysis
The Ophthalmic Refraction Chair Unit market exhibits robust growth, with a projected CAGR of xx% from 2025 to 2033. This growth is primarily driven by the rising prevalence of refractive errors globally, coupled with increasing healthcare spending. Technological advancements leading to more accurate and comfortable testing methods fuel market expansion. Consumer preferences lean towards automatic units offering improved efficiency and reduced operator dependence. Competitive dynamics are characterized by innovation, strategic partnerships, and a focus on providing comprehensive solutions that integrate seamlessly with existing ophthalmic equipment. Market penetration of automatic units is estimated at xx% in 2025 and is projected to reach xx% by 2033. Furthermore, the increasing adoption of telehealth and remote patient monitoring systems presents opportunities for integrating refraction chair units into these workflows. The market is also influenced by advancements in materials science that lead to more durable and cost-effective chair designs.
Leading Markets & Segments in Ophthalmic Refraction Chair Unit
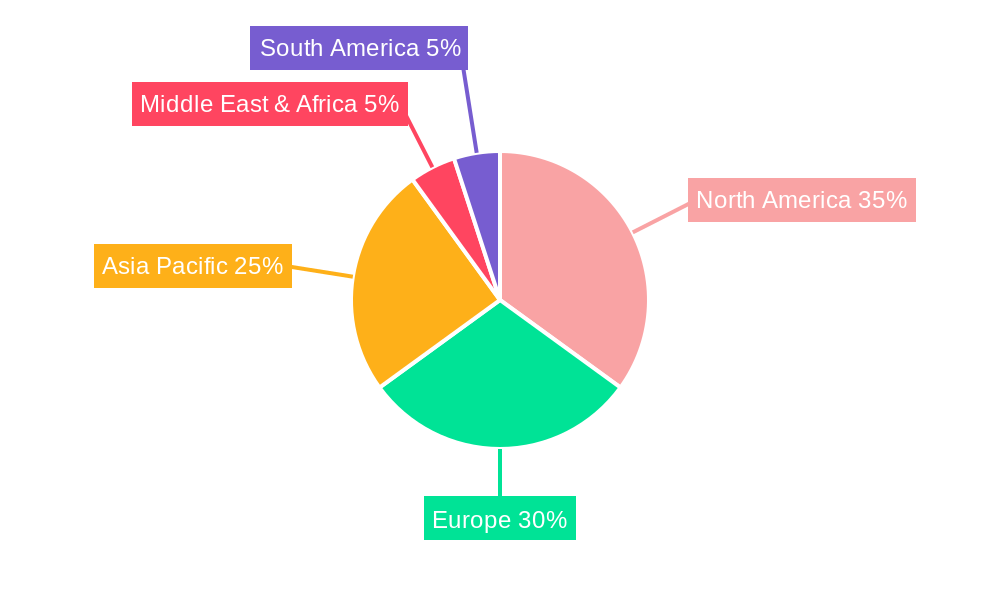
The global Ophthalmic Refraction Chair Unit market is geographically diverse. However, the North American market is presently the leading segment due to high healthcare expenditure, advanced infrastructure, and the presence of numerous specialized eye care facilities. The Asia-Pacific region is anticipated to witness considerable growth in the forecast period, primarily fueled by the increasing prevalence of refractive errors and rising disposable income.
- Dominant Region: North America (2025)
- Key Drivers (North America):
- High healthcare expenditure
- Well-established healthcare infrastructure
- High adoption rate of advanced technologies
- Key Drivers (Asia-Pacific):
- Rapidly growing population with rising prevalence of refractive errors
- Increasing disposable income
- Investments in healthcare infrastructure
Segment Analysis:
The Automatic segment is expected to dominate the market in terms of both value and volume due to its enhanced efficiency, reduced examination time, and improved accuracy compared to manual units. Hospitals constitute a larger share of the application segment compared to clinics due to their higher patient volume and demand for advanced equipment.
- Dominant Segment (Type): Automatic
- Dominant Segment (Application): Hospital
Ophthalmic Refraction Chair Unit Product Developments
Recent product developments emphasize enhanced ergonomics, integration with electronic health records (EHRs), and improved image processing capabilities for more accurate measurements. The integration of advanced technologies such as AI for automated diagnosis and real-time data analysis is a significant trend. These innovations aim to improve patient experience, optimize workflow, and enhance diagnostic accuracy, contributing to the overall market growth.
Key Drivers of Ophthalmic Refraction Chair Unit Growth
The Ophthalmic Refraction Chair Unit market is driven by several factors, including:
- The increasing prevalence of refractive errors globally, leading to higher demand for eye care services.
- Rising healthcare expenditure and investments in ophthalmic infrastructure.
- Technological advancements resulting in more precise, user-friendly, and automated devices.
- Favorable regulatory environments supporting medical device adoption.
Challenges in the Ophthalmic Refraction Chair Unit Market
The market faces several challenges including high initial investment costs associated with advanced technologies, potential supply chain disruptions affecting component availability, and intense competition from established and emerging players leading to price pressures. Furthermore, strict regulatory compliance and the need for ongoing product certifications pose significant hurdles to market entry for new companies. The estimated impact of these challenges on market growth is a xx% reduction in the projected CAGR by 2033.
Emerging Opportunities in Ophthalmic Refraction Chair Unit
Significant opportunities lie in expanding into emerging markets with unmet needs, focusing on developing cost-effective solutions for these regions. Technological breakthroughs in areas like AI-powered diagnostics and remote monitoring are expected to drive market growth. Strategic partnerships with ophthalmology clinics and hospitals for product placement and service provision represent further growth avenues. Finally, focusing on user-friendly interfaces and personalized patient experiences will enhance adoption.
Leading Players in the Ophthalmic Refraction Chair Unit Sector
- Appasamy Associates (If a global link exists; otherwise, replace with company name only)
- Chongqing Vision Star
- Beijing Hongdee
- Jiahui Optical
- Devine Meditech
- Plantech Medical
Key Milestones in Ophthalmic Refraction Chair Unit Industry
- 2020: Introduction of the first AI-integrated refraction chair unit by [Company Name, if known].
- 2022: Merger between [Company Name 1] and [Company Name 2], expanding market reach.
- 2023: Launch of a new generation of ergonomic refraction chair units with improved patient comfort by [Company Name, if known].
- 2024: Regulatory approval of a novel refraction technology in [Region].
Strategic Outlook for Ophthalmic Refraction Chair Unit Market
The Ophthalmic Refraction Chair Unit market is poised for continued growth, driven by advancements in technology, increasing demand for eye care, and the expansion of healthcare infrastructure globally. Focusing on innovation, strategic partnerships, and market diversification will be key to success in this competitive landscape. The long-term potential is significant, with opportunities for market expansion into new geographical areas and customer segments. Furthermore, integrating digital health solutions with refraction chair units will continue to be a key growth accelerator.
Ophthalmic Refraction Chair Unit Segmentation
-
1. Application
- 1.1. Hospital
- 1.2. Clinic
-
2. Type
- 2.1. Manual
- 2.2. Automatic
Ophthalmic Refraction Chair Unit Segmentation By Geography
-
1. North America
- 1.1. United States
- 1.2. Canada
- 1.3. Mexico
-
2. South America
- 2.1. Brazil
- 2.2. Argentina
- 2.3. Rest of South America
-
3. Europe
- 3.1. United Kingdom
- 3.2. Germany
- 3.3. France
- 3.4. Italy
- 3.5. Spain
- 3.6. Russia
- 3.7. Benelux
- 3.8. Nordics
- 3.9. Rest of Europe
-
4. Middle East & Africa
- 4.1. Turkey
- 4.2. Israel
- 4.3. GCC
- 4.4. North Africa
- 4.5. South Africa
- 4.6. Rest of Middle East & Africa
-
5. Asia Pacific
- 5.1. China
- 5.2. India
- 5.3. Japan
- 5.4. South Korea
- 5.5. ASEAN
- 5.6. Oceania
- 5.7. Rest of Asia Pacific
Ophthalmic Refraction Chair Unit Regional Market Share
Geographic Coverage of Ophthalmic Refraction Chair Unit
Ophthalmic Refraction Chair Unit REPORT HIGHLIGHTS
| Aspects | Details |
|---|---|
| Study Period | 2020-2034 |
| Base Year | 2025 |
| Estimated Year | 2026 |
| Forecast Period | 2026-2034 |
| Historical Period | 2020-2025 |
| Growth Rate | CAGR of 12.5% from 2020-2034 |
| Segmentation |
|
Table of Contents
- 1. Introduction
- 1.1. Research Scope
- 1.2. Market Segmentation
- 1.3. Research Methodology
- 1.4. Definitions and Assumptions
- 2. Executive Summary
- 2.1. Introduction
- 3. Market Dynamics
- 3.1. Introduction
- 3.2. Market Drivers
- 3.3. Market Restrains
- 3.4. Market Trends
- 4. Market Factor Analysis
- 4.1. Porters Five Forces
- 4.2. Supply/Value Chain
- 4.3. PESTEL analysis
- 4.4. Market Entropy
- 4.5. Patent/Trademark Analysis
- 5. Global Ophthalmic Refraction Chair Unit Analysis, Insights and Forecast, 2020-2032
- 5.1. Market Analysis, Insights and Forecast - by Application
- 5.1.1. Hospital
- 5.1.2. Clinic
- 5.2. Market Analysis, Insights and Forecast - by Type
- 5.2.1. Manual
- 5.2.2. Automatic
- 5.3. Market Analysis, Insights and Forecast - by Region
- 5.3.1. North America
- 5.3.2. South America
- 5.3.3. Europe
- 5.3.4. Middle East & Africa
- 5.3.5. Asia Pacific
- 5.1. Market Analysis, Insights and Forecast - by Application
- 6. North America Ophthalmic Refraction Chair Unit Analysis, Insights and Forecast, 2020-2032
- 6.1. Market Analysis, Insights and Forecast - by Application
- 6.1.1. Hospital
- 6.1.2. Clinic
- 6.2. Market Analysis, Insights and Forecast - by Type
- 6.2.1. Manual
- 6.2.2. Automatic
- 6.1. Market Analysis, Insights and Forecast - by Application
- 7. South America Ophthalmic Refraction Chair Unit Analysis, Insights and Forecast, 2020-2032
- 7.1. Market Analysis, Insights and Forecast - by Application
- 7.1.1. Hospital
- 7.1.2. Clinic
- 7.2. Market Analysis, Insights and Forecast - by Type
- 7.2.1. Manual
- 7.2.2. Automatic
- 7.1. Market Analysis, Insights and Forecast - by Application
- 8. Europe Ophthalmic Refraction Chair Unit Analysis, Insights and Forecast, 2020-2032
- 8.1. Market Analysis, Insights and Forecast - by Application
- 8.1.1. Hospital
- 8.1.2. Clinic
- 8.2. Market Analysis, Insights and Forecast - by Type
- 8.2.1. Manual
- 8.2.2. Automatic
- 8.1. Market Analysis, Insights and Forecast - by Application
- 9. Middle East & Africa Ophthalmic Refraction Chair Unit Analysis, Insights and Forecast, 2020-2032
- 9.1. Market Analysis, Insights and Forecast - by Application
- 9.1.1. Hospital
- 9.1.2. Clinic
- 9.2. Market Analysis, Insights and Forecast - by Type
- 9.2.1. Manual
- 9.2.2. Automatic
- 9.1. Market Analysis, Insights and Forecast - by Application
- 10. Asia Pacific Ophthalmic Refraction Chair Unit Analysis, Insights and Forecast, 2020-2032
- 10.1. Market Analysis, Insights and Forecast - by Application
- 10.1.1. Hospital
- 10.1.2. Clinic
- 10.2. Market Analysis, Insights and Forecast - by Type
- 10.2.1. Manual
- 10.2.2. Automatic
- 10.1. Market Analysis, Insights and Forecast - by Application
- 11. Competitive Analysis
- 11.1. Global Market Share Analysis 2025
- 11.2. Company Profiles
- 11.2.1 Appasamy Associates
- 11.2.1.1. Overview
- 11.2.1.2. Products
- 11.2.1.3. SWOT Analysis
- 11.2.1.4. Recent Developments
- 11.2.1.5. Financials (Based on Availability)
- 11.2.2 Chongqing Vision Star
- 11.2.2.1. Overview
- 11.2.2.2. Products
- 11.2.2.3. SWOT Analysis
- 11.2.2.4. Recent Developments
- 11.2.2.5. Financials (Based on Availability)
- 11.2.3 Beijing Hongdee
- 11.2.3.1. Overview
- 11.2.3.2. Products
- 11.2.3.3. SWOT Analysis
- 11.2.3.4. Recent Developments
- 11.2.3.5. Financials (Based on Availability)
- 11.2.4 Jiahui Optical
- 11.2.4.1. Overview
- 11.2.4.2. Products
- 11.2.4.3. SWOT Analysis
- 11.2.4.4. Recent Developments
- 11.2.4.5. Financials (Based on Availability)
- 11.2.5 Devine Meditech
- 11.2.5.1. Overview
- 11.2.5.2. Products
- 11.2.5.3. SWOT Analysis
- 11.2.5.4. Recent Developments
- 11.2.5.5. Financials (Based on Availability)
- 11.2.6 Plantech Medical
- 11.2.6.1. Overview
- 11.2.6.2. Products
- 11.2.6.3. SWOT Analysis
- 11.2.6.4. Recent Developments
- 11.2.6.5. Financials (Based on Availability)
- 11.2.1 Appasamy Associates
List of Figures
- Figure 1: Global Ophthalmic Refraction Chair Unit Revenue Breakdown (undefined, %) by Region 2025 & 2033
- Figure 2: Global Ophthalmic Refraction Chair Unit Volume Breakdown (K, %) by Region 2025 & 2033
- Figure 3: North America Ophthalmic Refraction Chair Unit Revenue (undefined), by Application 2025 & 2033
- Figure 4: North America Ophthalmic Refraction Chair Unit Volume (K), by Application 2025 & 2033
- Figure 5: North America Ophthalmic Refraction Chair Unit Revenue Share (%), by Application 2025 & 2033
- Figure 6: North America Ophthalmic Refraction Chair Unit Volume Share (%), by Application 2025 & 2033
- Figure 7: North America Ophthalmic Refraction Chair Unit Revenue (undefined), by Type 2025 & 2033
- Figure 8: North America Ophthalmic Refraction Chair Unit Volume (K), by Type 2025 & 2033
- Figure 9: North America Ophthalmic Refraction Chair Unit Revenue Share (%), by Type 2025 & 2033
- Figure 10: North America Ophthalmic Refraction Chair Unit Volume Share (%), by Type 2025 & 2033
- Figure 11: North America Ophthalmic Refraction Chair Unit Revenue (undefined), by Country 2025 & 2033
- Figure 12: North America Ophthalmic Refraction Chair Unit Volume (K), by Country 2025 & 2033
- Figure 13: North America Ophthalmic Refraction Chair Unit Revenue Share (%), by Country 2025 & 2033
- Figure 14: North America Ophthalmic Refraction Chair Unit Volume Share (%), by Country 2025 & 2033
- Figure 15: South America Ophthalmic Refraction Chair Unit Revenue (undefined), by Application 2025 & 2033
- Figure 16: South America Ophthalmic Refraction Chair Unit Volume (K), by Application 2025 & 2033
- Figure 17: South America Ophthalmic Refraction Chair Unit Revenue Share (%), by Application 2025 & 2033
- Figure 18: South America Ophthalmic Refraction Chair Unit Volume Share (%), by Application 2025 & 2033
- Figure 19: South America Ophthalmic Refraction Chair Unit Revenue (undefined), by Type 2025 & 2033
- Figure 20: South America Ophthalmic Refraction Chair Unit Volume (K), by Type 2025 & 2033
- Figure 21: South America Ophthalmic Refraction Chair Unit Revenue Share (%), by Type 2025 & 2033
- Figure 22: South America Ophthalmic Refraction Chair Unit Volume Share (%), by Type 2025 & 2033
- Figure 23: South America Ophthalmic Refraction Chair Unit Revenue (undefined), by Country 2025 & 2033
- Figure 24: South America Ophthalmic Refraction Chair Unit Volume (K), by Country 2025 & 2033
- Figure 25: South America Ophthalmic Refraction Chair Unit Revenue Share (%), by Country 2025 & 2033
- Figure 26: South America Ophthalmic Refraction Chair Unit Volume Share (%), by Country 2025 & 2033
- Figure 27: Europe Ophthalmic Refraction Chair Unit Revenue (undefined), by Application 2025 & 2033
- Figure 28: Europe Ophthalmic Refraction Chair Unit Volume (K), by Application 2025 & 2033
- Figure 29: Europe Ophthalmic Refraction Chair Unit Revenue Share (%), by Application 2025 & 2033
- Figure 30: Europe Ophthalmic Refraction Chair Unit Volume Share (%), by Application 2025 & 2033
- Figure 31: Europe Ophthalmic Refraction Chair Unit Revenue (undefined), by Type 2025 & 2033
- Figure 32: Europe Ophthalmic Refraction Chair Unit Volume (K), by Type 2025 & 2033
- Figure 33: Europe Ophthalmic Refraction Chair Unit Revenue Share (%), by Type 2025 & 2033
- Figure 34: Europe Ophthalmic Refraction Chair Unit Volume Share (%), by Type 2025 & 2033
- Figure 35: Europe Ophthalmic Refraction Chair Unit Revenue (undefined), by Country 2025 & 2033
- Figure 36: Europe Ophthalmic Refraction Chair Unit Volume (K), by Country 2025 & 2033
- Figure 37: Europe Ophthalmic Refraction Chair Unit Revenue Share (%), by Country 2025 & 2033
- Figure 38: Europe Ophthalmic Refraction Chair Unit Volume Share (%), by Country 2025 & 2033
- Figure 39: Middle East & Africa Ophthalmic Refraction Chair Unit Revenue (undefined), by Application 2025 & 2033
- Figure 40: Middle East & Africa Ophthalmic Refraction Chair Unit Volume (K), by Application 2025 & 2033
- Figure 41: Middle East & Africa Ophthalmic Refraction Chair Unit Revenue Share (%), by Application 2025 & 2033
- Figure 42: Middle East & Africa Ophthalmic Refraction Chair Unit Volume Share (%), by Application 2025 & 2033
- Figure 43: Middle East & Africa Ophthalmic Refraction Chair Unit Revenue (undefined), by Type 2025 & 2033
- Figure 44: Middle East & Africa Ophthalmic Refraction Chair Unit Volume (K), by Type 2025 & 2033
- Figure 45: Middle East & Africa Ophthalmic Refraction Chair Unit Revenue Share (%), by Type 2025 & 2033
- Figure 46: Middle East & Africa Ophthalmic Refraction Chair Unit Volume Share (%), by Type 2025 & 2033
- Figure 47: Middle East & Africa Ophthalmic Refraction Chair Unit Revenue (undefined), by Country 2025 & 2033
- Figure 48: Middle East & Africa Ophthalmic Refraction Chair Unit Volume (K), by Country 2025 & 2033
- Figure 49: Middle East & Africa Ophthalmic Refraction Chair Unit Revenue Share (%), by Country 2025 & 2033
- Figure 50: Middle East & Africa Ophthalmic Refraction Chair Unit Volume Share (%), by Country 2025 & 2033
- Figure 51: Asia Pacific Ophthalmic Refraction Chair Unit Revenue (undefined), by Application 2025 & 2033
- Figure 52: Asia Pacific Ophthalmic Refraction Chair Unit Volume (K), by Application 2025 & 2033
- Figure 53: Asia Pacific Ophthalmic Refraction Chair Unit Revenue Share (%), by Application 2025 & 2033
- Figure 54: Asia Pacific Ophthalmic Refraction Chair Unit Volume Share (%), by Application 2025 & 2033
- Figure 55: Asia Pacific Ophthalmic Refraction Chair Unit Revenue (undefined), by Type 2025 & 2033
- Figure 56: Asia Pacific Ophthalmic Refraction Chair Unit Volume (K), by Type 2025 & 2033
- Figure 57: Asia Pacific Ophthalmic Refraction Chair Unit Revenue Share (%), by Type 2025 & 2033
- Figure 58: Asia Pacific Ophthalmic Refraction Chair Unit Volume Share (%), by Type 2025 & 2033
- Figure 59: Asia Pacific Ophthalmic Refraction Chair Unit Revenue (undefined), by Country 2025 & 2033
- Figure 60: Asia Pacific Ophthalmic Refraction Chair Unit Volume (K), by Country 2025 & 2033
- Figure 61: Asia Pacific Ophthalmic Refraction Chair Unit Revenue Share (%), by Country 2025 & 2033
- Figure 62: Asia Pacific Ophthalmic Refraction Chair Unit Volume Share (%), by Country 2025 & 2033
List of Tables
- Table 1: Global Ophthalmic Refraction Chair Unit Revenue undefined Forecast, by Application 2020 & 2033
- Table 2: Global Ophthalmic Refraction Chair Unit Volume K Forecast, by Application 2020 & 2033
- Table 3: Global Ophthalmic Refraction Chair Unit Revenue undefined Forecast, by Type 2020 & 2033
- Table 4: Global Ophthalmic Refraction Chair Unit Volume K Forecast, by Type 2020 & 2033
- Table 5: Global Ophthalmic Refraction Chair Unit Revenue undefined Forecast, by Region 2020 & 2033
- Table 6: Global Ophthalmic Refraction Chair Unit Volume K Forecast, by Region 2020 & 2033
- Table 7: Global Ophthalmic Refraction Chair Unit Revenue undefined Forecast, by Application 2020 & 2033
- Table 8: Global Ophthalmic Refraction Chair Unit Volume K Forecast, by Application 2020 & 2033
- Table 9: Global Ophthalmic Refraction Chair Unit Revenue undefined Forecast, by Type 2020 & 2033
- Table 10: Global Ophthalmic Refraction Chair Unit Volume K Forecast, by Type 2020 & 2033
- Table 11: Global Ophthalmic Refraction Chair Unit Revenue undefined Forecast, by Country 2020 & 2033
- Table 12: Global Ophthalmic Refraction Chair Unit Volume K Forecast, by Country 2020 & 2033
- Table 13: United States Ophthalmic Refraction Chair Unit Revenue (undefined) Forecast, by Application 2020 & 2033
- Table 14: United States Ophthalmic Refraction Chair Unit Volume (K) Forecast, by Application 2020 & 2033
- Table 15: Canada Ophthalmic Refraction Chair Unit Revenue (undefined) Forecast, by Application 2020 & 2033
- Table 16: Canada Ophthalmic Refraction Chair Unit Volume (K) Forecast, by Application 2020 & 2033
- Table 17: Mexico Ophthalmic Refraction Chair Unit Revenue (undefined) Forecast, by Application 2020 & 2033
- Table 18: Mexico Ophthalmic Refraction Chair Unit Volume (K) Forecast, by Application 2020 & 2033
- Table 19: Global Ophthalmic Refraction Chair Unit Revenue undefined Forecast, by Application 2020 & 2033
- Table 20: Global Ophthalmic Refraction Chair Unit Volume K Forecast, by Application 2020 & 2033
- Table 21: Global Ophthalmic Refraction Chair Unit Revenue undefined Forecast, by Type 2020 & 2033
- Table 22: Global Ophthalmic Refraction Chair Unit Volume K Forecast, by Type 2020 & 2033
- Table 23: Global Ophthalmic Refraction Chair Unit Revenue undefined Forecast, by Country 2020 & 2033
- Table 24: Global Ophthalmic Refraction Chair Unit Volume K Forecast, by Country 2020 & 2033
- Table 25: Brazil Ophthalmic Refraction Chair Unit Revenue (undefined) Forecast, by Application 2020 & 2033
- Table 26: Brazil Ophthalmic Refraction Chair Unit Volume (K) Forecast, by Application 2020 & 2033
- Table 27: Argentina Ophthalmic Refraction Chair Unit Revenue (undefined) Forecast, by Application 2020 & 2033
- Table 28: Argentina Ophthalmic Refraction Chair Unit Volume (K) Forecast, by Application 2020 & 2033
- Table 29: Rest of South America Ophthalmic Refraction Chair Unit Revenue (undefined) Forecast, by Application 2020 & 2033
- Table 30: Rest of South America Ophthalmic Refraction Chair Unit Volume (K) Forecast, by Application 2020 & 2033
- Table 31: Global Ophthalmic Refraction Chair Unit Revenue undefined Forecast, by Application 2020 & 2033
- Table 32: Global Ophthalmic Refraction Chair Unit Volume K Forecast, by Application 2020 & 2033
- Table 33: Global Ophthalmic Refraction Chair Unit Revenue undefined Forecast, by Type 2020 & 2033
- Table 34: Global Ophthalmic Refraction Chair Unit Volume K Forecast, by Type 2020 & 2033
- Table 35: Global Ophthalmic Refraction Chair Unit Revenue undefined Forecast, by Country 2020 & 2033
- Table 36: Global Ophthalmic Refraction Chair Unit Volume K Forecast, by Country 2020 & 2033
- Table 37: United Kingdom Ophthalmic Refraction Chair Unit Revenue (undefined) Forecast, by Application 2020 & 2033
- Table 38: United Kingdom Ophthalmic Refraction Chair Unit Volume (K) Forecast, by Application 2020 & 2033
- Table 39: Germany Ophthalmic Refraction Chair Unit Revenue (undefined) Forecast, by Application 2020 & 2033
- Table 40: Germany Ophthalmic Refraction Chair Unit Volume (K) Forecast, by Application 2020 & 2033
- Table 41: France Ophthalmic Refraction Chair Unit Revenue (undefined) Forecast, by Application 2020 & 2033
- Table 42: France Ophthalmic Refraction Chair Unit Volume (K) Forecast, by Application 2020 & 2033
- Table 43: Italy Ophthalmic Refraction Chair Unit Revenue (undefined) Forecast, by Application 2020 & 2033
- Table 44: Italy Ophthalmic Refraction Chair Unit Volume (K) Forecast, by Application 2020 & 2033
- Table 45: Spain Ophthalmic Refraction Chair Unit Revenue (undefined) Forecast, by Application 2020 & 2033
- Table 46: Spain Ophthalmic Refraction Chair Unit Volume (K) Forecast, by Application 2020 & 2033
- Table 47: Russia Ophthalmic Refraction Chair Unit Revenue (undefined) Forecast, by Application 2020 & 2033
- Table 48: Russia Ophthalmic Refraction Chair Unit Volume (K) Forecast, by Application 2020 & 2033
- Table 49: Benelux Ophthalmic Refraction Chair Unit Revenue (undefined) Forecast, by Application 2020 & 2033
- Table 50: Benelux Ophthalmic Refraction Chair Unit Volume (K) Forecast, by Application 2020 & 2033
- Table 51: Nordics Ophthalmic Refraction Chair Unit Revenue (undefined) Forecast, by Application 2020 & 2033
- Table 52: Nordics Ophthalmic Refraction Chair Unit Volume (K) Forecast, by Application 2020 & 2033
- Table 53: Rest of Europe Ophthalmic Refraction Chair Unit Revenue (undefined) Forecast, by Application 2020 & 2033
- Table 54: Rest of Europe Ophthalmic Refraction Chair Unit Volume (K) Forecast, by Application 2020 & 2033
- Table 55: Global Ophthalmic Refraction Chair Unit Revenue undefined Forecast, by Application 2020 & 2033
- Table 56: Global Ophthalmic Refraction Chair Unit Volume K Forecast, by Application 2020 & 2033
- Table 57: Global Ophthalmic Refraction Chair Unit Revenue undefined Forecast, by Type 2020 & 2033
- Table 58: Global Ophthalmic Refraction Chair Unit Volume K Forecast, by Type 2020 & 2033
- Table 59: Global Ophthalmic Refraction Chair Unit Revenue undefined Forecast, by Country 2020 & 2033
- Table 60: Global Ophthalmic Refraction Chair Unit Volume K Forecast, by Country 2020 & 2033
- Table 61: Turkey Ophthalmic Refraction Chair Unit Revenue (undefined) Forecast, by Application 2020 & 2033
- Table 62: Turkey Ophthalmic Refraction Chair Unit Volume (K) Forecast, by Application 2020 & 2033
- Table 63: Israel Ophthalmic Refraction Chair Unit Revenue (undefined) Forecast, by Application 2020 & 2033
- Table 64: Israel Ophthalmic Refraction Chair Unit Volume (K) Forecast, by Application 2020 & 2033
- Table 65: GCC Ophthalmic Refraction Chair Unit Revenue (undefined) Forecast, by Application 2020 & 2033
- Table 66: GCC Ophthalmic Refraction Chair Unit Volume (K) Forecast, by Application 2020 & 2033
- Table 67: North Africa Ophthalmic Refraction Chair Unit Revenue (undefined) Forecast, by Application 2020 & 2033
- Table 68: North Africa Ophthalmic Refraction Chair Unit Volume (K) Forecast, by Application 2020 & 2033
- Table 69: South Africa Ophthalmic Refraction Chair Unit Revenue (undefined) Forecast, by Application 2020 & 2033
- Table 70: South Africa Ophthalmic Refraction Chair Unit Volume (K) Forecast, by Application 2020 & 2033
- Table 71: Rest of Middle East & Africa Ophthalmic Refraction Chair Unit Revenue (undefined) Forecast, by Application 2020 & 2033
- Table 72: Rest of Middle East & Africa Ophthalmic Refraction Chair Unit Volume (K) Forecast, by Application 2020 & 2033
- Table 73: Global Ophthalmic Refraction Chair Unit Revenue undefined Forecast, by Application 2020 & 2033
- Table 74: Global Ophthalmic Refraction Chair Unit Volume K Forecast, by Application 2020 & 2033
- Table 75: Global Ophthalmic Refraction Chair Unit Revenue undefined Forecast, by Type 2020 & 2033
- Table 76: Global Ophthalmic Refraction Chair Unit Volume K Forecast, by Type 2020 & 2033
- Table 77: Global Ophthalmic Refraction Chair Unit Revenue undefined Forecast, by Country 2020 & 2033
- Table 78: Global Ophthalmic Refraction Chair Unit Volume K Forecast, by Country 2020 & 2033
- Table 79: China Ophthalmic Refraction Chair Unit Revenue (undefined) Forecast, by Application 2020 & 2033
- Table 80: China Ophthalmic Refraction Chair Unit Volume (K) Forecast, by Application 2020 & 2033
- Table 81: India Ophthalmic Refraction Chair Unit Revenue (undefined) Forecast, by Application 2020 & 2033
- Table 82: India Ophthalmic Refraction Chair Unit Volume (K) Forecast, by Application 2020 & 2033
- Table 83: Japan Ophthalmic Refraction Chair Unit Revenue (undefined) Forecast, by Application 2020 & 2033
- Table 84: Japan Ophthalmic Refraction Chair Unit Volume (K) Forecast, by Application 2020 & 2033
- Table 85: South Korea Ophthalmic Refraction Chair Unit Revenue (undefined) Forecast, by Application 2020 & 2033
- Table 86: South Korea Ophthalmic Refraction Chair Unit Volume (K) Forecast, by Application 2020 & 2033
- Table 87: ASEAN Ophthalmic Refraction Chair Unit Revenue (undefined) Forecast, by Application 2020 & 2033
- Table 88: ASEAN Ophthalmic Refraction Chair Unit Volume (K) Forecast, by Application 2020 & 2033
- Table 89: Oceania Ophthalmic Refraction Chair Unit Revenue (undefined) Forecast, by Application 2020 & 2033
- Table 90: Oceania Ophthalmic Refraction Chair Unit Volume (K) Forecast, by Application 2020 & 2033
- Table 91: Rest of Asia Pacific Ophthalmic Refraction Chair Unit Revenue (undefined) Forecast, by Application 2020 & 2033
- Table 92: Rest of Asia Pacific Ophthalmic Refraction Chair Unit Volume (K) Forecast, by Application 2020 & 2033
Frequently Asked Questions
1. What is the projected Compound Annual Growth Rate (CAGR) of the Ophthalmic Refraction Chair Unit?
The projected CAGR is approximately 12.5%.
2. Which companies are prominent players in the Ophthalmic Refraction Chair Unit?
Key companies in the market include Appasamy Associates, Chongqing Vision Star, Beijing Hongdee, Jiahui Optical, Devine Meditech, Plantech Medical.
3. What are the main segments of the Ophthalmic Refraction Chair Unit?
The market segments include Application, Type.
4. Can you provide details about the market size?
The market size is estimated to be USD XXX N/A as of 2022.
5. What are some drivers contributing to market growth?
N/A
6. What are the notable trends driving market growth?
N/A
7. Are there any restraints impacting market growth?
N/A
8. Can you provide examples of recent developments in the market?
N/A
9. What pricing options are available for accessing the report?
Pricing options include single-user, multi-user, and enterprise licenses priced at USD 3950.00, USD 5925.00, and USD 7900.00 respectively.
10. Is the market size provided in terms of value or volume?
The market size is provided in terms of value, measured in N/A and volume, measured in K.
11. Are there any specific market keywords associated with the report?
Yes, the market keyword associated with the report is "Ophthalmic Refraction Chair Unit," which aids in identifying and referencing the specific market segment covered.
12. How do I determine which pricing option suits my needs best?
The pricing options vary based on user requirements and access needs. Individual users may opt for single-user licenses, while businesses requiring broader access may choose multi-user or enterprise licenses for cost-effective access to the report.
13. Are there any additional resources or data provided in the Ophthalmic Refraction Chair Unit report?
While the report offers comprehensive insights, it's advisable to review the specific contents or supplementary materials provided to ascertain if additional resources or data are available.
14. How can I stay updated on further developments or reports in the Ophthalmic Refraction Chair Unit?
To stay informed about further developments, trends, and reports in the Ophthalmic Refraction Chair Unit, consider subscribing to industry newsletters, following relevant companies and organizations, or regularly checking reputable industry news sources and publications.
Methodology
Step 1 - Identification of Relevant Samples Size from Population Database


Step 2 - Approaches for Defining Global Market Size (Value, Volume* & Price*)

Note*: In applicable scenarios
Step 3 - Data Sources
Primary Research
- Web Analytics
- Survey Reports
- Research Institute
- Latest Research Reports
- Opinion Leaders
Secondary Research
- Annual Reports
- White Paper
- Latest Press Release
- Industry Association
- Paid Database
- Investor Presentations

Step 4 - Data Triangulation
Involves using different sources of information in order to increase the validity of a study
These sources are likely to be stakeholders in a program - participants, other researchers, program staff, other community members, and so on.
Then we put all data in single framework & apply various statistical tools to find out the dynamic on the market.
During the analysis stage, feedback from the stakeholder groups would be compared to determine areas of agreement as well as areas of divergence