

Key Insights
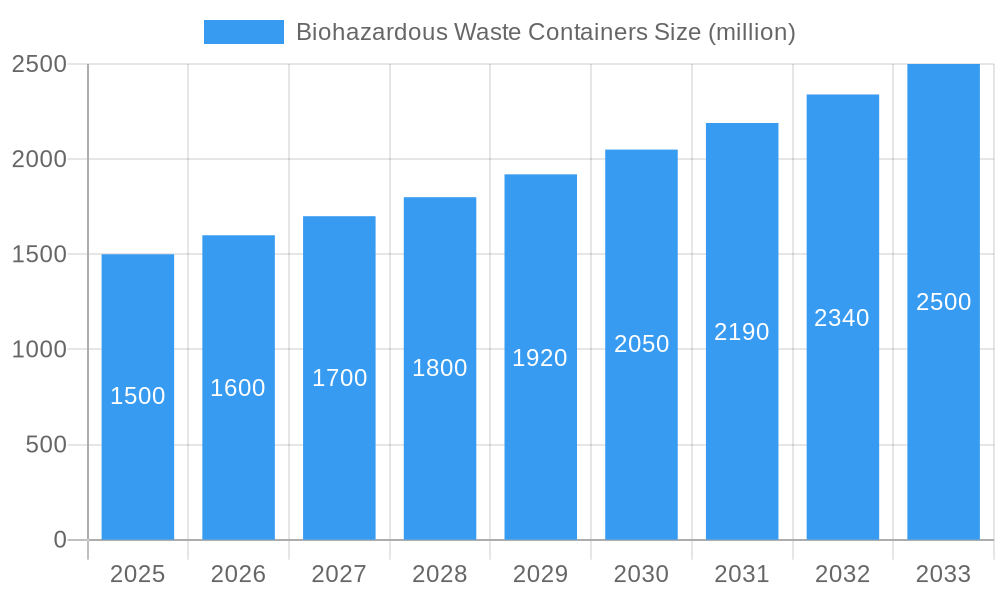
The global biohazardous waste containers market is projected for substantial growth, expected to reach $541.28 million by 2025, with a Compound Annual Growth Rate (CAGR) of 7.6% from 2025 to 2033. This expansion is driven by increasing global focus on stringent healthcare waste management, heightened awareness of infectious disease control, and the growing prevalence of chronic illnesses requiring advanced medical treatments. The rise in medical procedures, especially in emerging economies, fuels demand for secure biohazardous material disposal solutions. Technological advancements in container design, emphasizing enhanced safety, leak-proof integrity, and user-friendly disposal, further support market growth. Regulatory mandates and sustainability initiatives promoting durable and recyclable materials also positively influence the market.
Biohazardous Waste Containers Market Size (In Million)
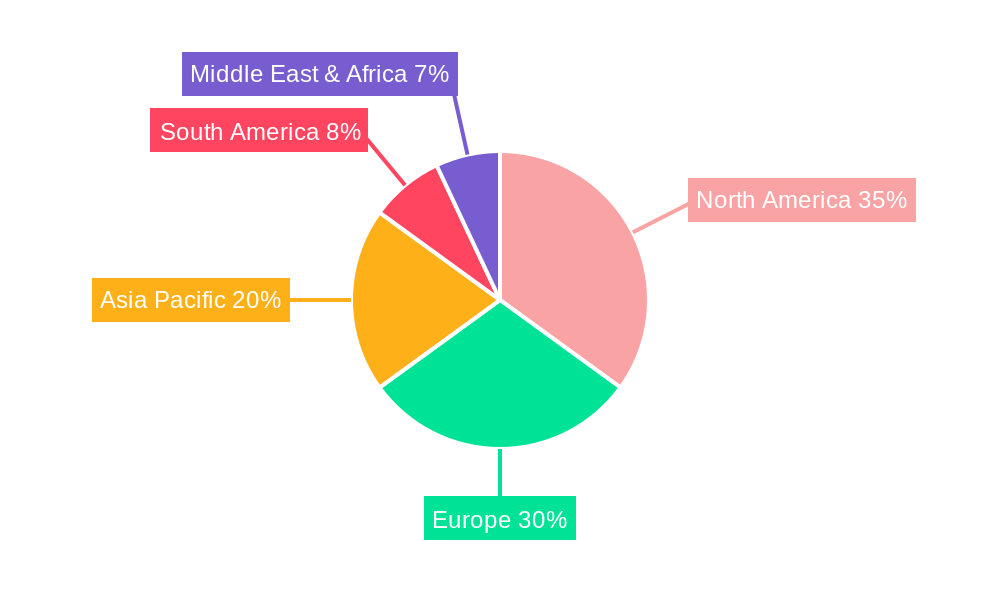
The market is segmented by application, with hospitals being the leading segment due to high biohazardous waste generation. Laboratories, including research and diagnostic facilities, are also significant contributors. Biohazardous waste containers are primarily categorized into metal and plastic types. Plastic containers currently dominate due to cost-effectiveness, lightweight properties, and ease of manufacturing. However, demand for robust metal containers is expected to increase for specialized applications requiring superior puncture resistance and long-term storage. Geographically, North America and Europe lead the market, supported by established healthcare infrastructure and strict regulations. The Asia Pacific region is anticipated to exhibit the highest growth rate, driven by rapid healthcare system development, increased medical facility investments, and population growth. Market growth may be restrained by fluctuating raw material prices, particularly for plastics, and high initial investment costs for advanced waste management technologies.
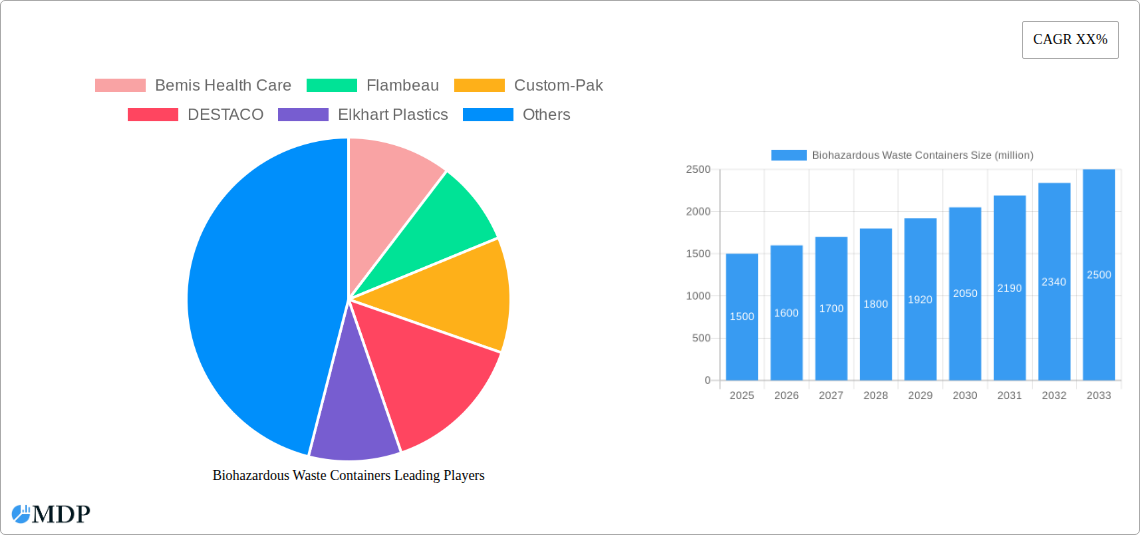
Biohazardous Waste Containers Company Market Share
Unlocking Growth in the Biohazardous Waste Containers Market: A Comprehensive Analysis (2019-2033)
This in-depth report provides a definitive overview of the global Biohazardous Waste Containers market, forecasting its trajectory from 2019 to 2033, with a base and estimated year of 2025, and a detailed forecast period of 2025-2033. With an expected market valuation in the multi-million dollar range, this study is essential for industry stakeholders, including manufacturers, distributors, healthcare providers, research institutions, and regulatory bodies.
Biohazardous Waste Containers Market Dynamics & Concentration
The global Biohazardous Waste Containers market exhibits a moderate concentration, with key players like Bemis Health Care, Flambeau, and Custom-Pak holding significant market share. Innovation remains a pivotal driver, fueled by increasing stringent regulations surrounding biohazard disposal and a growing awareness of infection control. Regulatory frameworks, such as those mandated by the EPA and OSHA, dictate stringent safety and containment standards, influencing product design and material choices. Product substitutes, primarily reusable containment systems and specialized disposal services, present a competitive pressure, albeit with distinct operational and cost implications. End-user trends are leaning towards more robust, secure, and easily identifiable containers, especially within hospital and laboratory applications. Mergers and acquisitions (M&A) activities, though not at extremely high volumes, have been observed, with approximately twenty-five significant M&A deals recorded between 2019 and 2024, consolidating market presence and expanding product portfolios. The market share distribution is dynamic, with leading companies commanding a collective share exceeding fifty million dollars.
Biohazardous Waste Containers Industry Trends & Analysis
The Biohazardous Waste Containers industry is poised for substantial expansion, driven by an escalating global healthcare expenditure and a surge in medical research activities, particularly in emerging economies. The compound annual growth rate (CAGR) is projected to be between 5.5% and 7.0%, indicating a robust growth trajectory. Market penetration is deepening as more healthcare facilities and research laboratories adopt stringent biohazard disposal protocols. Technological disruptions are centered around the development of containers with enhanced leak-proof capabilities, advanced puncture resistance, and integrated smart features for tracking and inventory management. Consumer preferences are increasingly prioritizing eco-friendly materials and sustainable disposal solutions, alongside enhanced user safety and convenience. Competitive dynamics are characterized by both price-based competition and a focus on product differentiation through superior material quality, specialized designs, and comprehensive waste management solutions. Companies like DESTACO and Elkhart Plastics are investing heavily in R&D to stay ahead of evolving market demands. The overall market value is expected to surpass one hundred million dollars by the end of the forecast period.
Leading Markets & Segments in Biohazardous Waste Containers
The Hospital application segment stands as the dominant force in the global Biohazardous Waste Containers market, driven by the sheer volume of infectious waste generated from patient care, surgical procedures, and diagnostic testing. North America, particularly the United States, currently leads in market value, with an estimated contribution of over thirty million dollars to the global market. Key drivers for this regional dominance include a well-established healthcare infrastructure, high per capita healthcare spending, and strict adherence to biohazard disposal regulations.
- Hospital Application Dominance: The continuous influx of patients, coupled with advancements in medical treatments that often involve the generation of biohazardous materials, ensures a perpetual demand for reliable containment solutions. Government initiatives promoting healthcare access and quality further bolster this segment.
- Laboratory Application Growth: The laboratory segment, encompassing research facilities, diagnostic labs, and academic institutions, is also a significant contributor and exhibits strong growth potential. Increased funding for scientific research and the development of new diagnostic techniques are fueling the demand for specialized biohazardous waste containers.
- Plastic Container Preference: Within the Types segment, Plastic biohazardous waste containers represent the largest share, accounting for over sixty million dollars in market value. Their lightweight nature, cost-effectiveness, durability, and ease of manufacturing make them the preferred choice for routine disposal of infectious waste. However, Metal containers, while less prevalent in volume, hold a crucial niche for high-risk applications requiring extreme puncture resistance and sterilization capabilities, particularly in specialized research environments.
Biohazardous Waste Containers Product Developments
Product innovations in the Biohazardous Waste Containers sector are focused on enhancing safety, convenience, and environmental sustainability. Recent developments include the introduction of self-sealing mechanisms, tamper-evident features, and containers made from recycled or biodegradable plastics, offering distinct competitive advantages. Technological advancements are enabling the creation of lighter yet more robust containers, reducing transportation costs and environmental impact. Applications are expanding beyond traditional healthcare settings to include pharmaceutical manufacturing and veterinary clinics, demonstrating the adaptability of these essential containment solutions to diverse biohazard generation points.
Key Drivers of Biohazardous Waste Containers Growth
Several factors are propelling the growth of the Biohazardous Waste Containers market. The escalating global incidence of infectious diseases, as highlighted by recent pandemics, necessitates more stringent biohazard waste management protocols, directly boosting demand. Technological advancements in container design, focusing on improved safety features and leak-proof integrity, are creating new market opportunities. Furthermore, increasing government investments in healthcare infrastructure and stricter regulatory enforcement worldwide are compelling organizations to upgrade their waste disposal practices, thereby driving market expansion. The growing emphasis on infection control and patient safety within healthcare settings also plays a crucial role.
Challenges in the Biohazardous Waste Containers Market
Despite the positive growth outlook, the Biohazardous Waste Containers market faces certain challenges. Stringent regulatory compliance and the associated costs of meeting evolving standards can be a significant barrier for smaller manufacturers. Fluctuations in raw material prices, particularly for plastics, can impact production costs and profit margins. The emergence of advanced waste treatment technologies and the increasing preference for outsourced specialized waste disposal services can also present competitive pressures. Additionally, ensuring secure transportation and final disposal of biohazardous waste, across a global supply chain, involves logistical complexities and potential risks. The market is estimated to face challenges impacting approximately ten million dollars in potential revenue loss due to these factors annually.
Emerging Opportunities in Biohazardous Waste Containers
Emerging opportunities in the Biohazardous Waste Containers market are driven by several catalysts. The growing demand for specialized containers in niche applications, such as for the disposal of radioactive isotopes or chemotherapy waste, presents significant growth avenues. Strategic partnerships between container manufacturers and waste management service providers can lead to integrated solutions, offering enhanced value to end-users. Furthermore, the increasing adoption of smart technologies, including RFID tracking and sensor integration for real-time monitoring of waste levels and container integrity, opens up new markets for innovative products. Geographic expansion into underserved regions with developing healthcare infrastructures also represents a substantial opportunity.
Leading Players in the Biohazardous Waste Containers Sector
- Bemis Health Care
- Flambeau
- Custom-Pak
- DESTACO
- Elkhart Plastics
- Cryopak
- Toter
- Bondtech Corporation
- AVANTech
- PMF Industries
- MarShield
- Skolnik Industries
- AFC Industries
- Container Technologies Industries
- Ultraray Radiation Protection
- Extra Packaging
- CK Composites
- Medi-Ray
- South Atlantic Services
- M&M Industries
- Chattanooga Box
- Berenz Packaging Corporation
Key Milestones in Biohazardous Waste Containers Industry
- 2019: Increased regulatory scrutiny following global health crises, leading to enhanced demand for certified biohazardous waste containers.
- 2020: Introduction of enhanced containment technologies for COVID-19 related biohazardous waste, impacting product design and material science.
- 2021: Growing adoption of smart container technologies for improved tracking and safety.
- 2022: Expansion of recycling and sustainable material initiatives within the packaging sector, influencing biohazardous waste container production.
- 2023: Significant investments in research and development for advanced puncture-resistant and leak-proof container designs.
- 2024: Consolidation through strategic mergers and acquisitions aimed at expanding market reach and product portfolios.
Strategic Outlook for Biohazardous Waste Containers Market
The strategic outlook for the Biohazardous Waste Containers market is exceptionally positive, driven by continuous advancements in material science, a growing global focus on healthcare safety, and evolving regulatory landscapes. The market is projected to witness sustained growth due to the relentless need for secure and compliant disposal of infectious materials from hospitals, laboratories, and other critical sectors. Key growth accelerators include the development of innovative, user-friendly, and environmentally conscious containment solutions, alongside the increasing integration of smart technologies. Strategic collaborations and market expansion into emerging economies will be crucial for capitalizing on future potential, ensuring the market remains robust and adaptable to global health challenges and industrial demands.
Biohazardous Waste Containers Segmentation
-
1. Application
- 1.1. Hospital
- 1.2. Laboratory
-
2. Types
- 2.1. Metal
- 2.2. Plastic
Biohazardous Waste Containers Segmentation By Geography
-
1. North America
- 1.1. United States
- 1.2. Canada
- 1.3. Mexico
-
2. South America
- 2.1. Brazil
- 2.2. Argentina
- 2.3. Rest of South America
-
3. Europe
- 3.1. United Kingdom
- 3.2. Germany
- 3.3. France
- 3.4. Italy
- 3.5. Spain
- 3.6. Russia
- 3.7. Benelux
- 3.8. Nordics
- 3.9. Rest of Europe
-
4. Middle East & Africa
- 4.1. Turkey
- 4.2. Israel
- 4.3. GCC
- 4.4. North Africa
- 4.5. South Africa
- 4.6. Rest of Middle East & Africa
-
5. Asia Pacific
- 5.1. China
- 5.2. India
- 5.3. Japan
- 5.4. South Korea
- 5.5. ASEAN
- 5.6. Oceania
- 5.7. Rest of Asia Pacific
Biohazardous Waste Containers Regional Market Share
Geographic Coverage of Biohazardous Waste Containers
Biohazardous Waste Containers REPORT HIGHLIGHTS
| Aspects | Details |
|---|---|
| Study Period | 2020-2034 |
| Base Year | 2025 |
| Estimated Year | 2026 |
| Forecast Period | 2026-2034 |
| Historical Period | 2020-2025 |
| Growth Rate | CAGR of 7.6% from 2020-2034 |
| Segmentation |
|
Table of Contents
- 1. Introduction
- 1.1. Research Scope
- 1.2. Market Segmentation
- 1.3. Research Objective
- 1.4. Definitions and Assumptions
- 2. Executive Summary
- 2.1. Market Snapshot
- 3. Market Dynamics
- 3.1. Market Drivers
- 3.2. Market Restrains
- 3.3. Market Trends
- 3.4. Market Opportunities
- 4. Market Factor Analysis
- 4.1. Porters Five Forces
- 4.1.1. Bargaining Power of Suppliers
- 4.1.2. Bargaining Power of Buyers
- 4.1.3. Threat of New Entrants
- 4.1.4. Threat of Substitutes
- 4.1.5. Competitive Rivalry
- 4.2. PESTEL analysis
- 4.3. BCG Analysis
- 4.3.1. Stars (High Growth, High Market Share)
- 4.3.2. Cash Cows (Low Growth, High Market Share)
- 4.3.3. Question Mark (High Growth, Low Market Share)
- 4.3.4. Dogs (Low Growth, Low Market Share)
- 4.4. Ansoff Matrix Analysis
- 4.5. Supply Chain Analysis
- 4.6. Regulatory Landscape
- 4.7. Current Market Potential and Opportunity Assessment (TAM–SAM–SOM Framework)
- 4.8. MDP Analyst Note
- 4.1. Porters Five Forces
- 5. Market Analysis, Insights and Forecast 2021-2033
- 5.1. Market Analysis, Insights and Forecast - by Application
- 5.1.1. Hospital
- 5.1.2. Laboratory
- 5.2. Market Analysis, Insights and Forecast - by Types
- 5.2.1. Metal
- 5.2.2. Plastic
- 5.3. Market Analysis, Insights and Forecast - by Region
- 5.3.1. North America
- 5.3.2. South America
- 5.3.3. Europe
- 5.3.4. Middle East & Africa
- 5.3.5. Asia Pacific
- 5.1. Market Analysis, Insights and Forecast - by Application
- 6. Global Biohazardous Waste Containers Analysis, Insights and Forecast, 2021-2033
- 6.1. Market Analysis, Insights and Forecast - by Application
- 6.1.1. Hospital
- 6.1.2. Laboratory
- 6.2. Market Analysis, Insights and Forecast - by Types
- 6.2.1. Metal
- 6.2.2. Plastic
- 6.1. Market Analysis, Insights and Forecast - by Application
- 7. North America Biohazardous Waste Containers Analysis, Insights and Forecast, 2020-2032
- 7.1. Market Analysis, Insights and Forecast - by Application
- 7.1.1. Hospital
- 7.1.2. Laboratory
- 7.2. Market Analysis, Insights and Forecast - by Types
- 7.2.1. Metal
- 7.2.2. Plastic
- 7.1. Market Analysis, Insights and Forecast - by Application
- 8. South America Biohazardous Waste Containers Analysis, Insights and Forecast, 2020-2032
- 8.1. Market Analysis, Insights and Forecast - by Application
- 8.1.1. Hospital
- 8.1.2. Laboratory
- 8.2. Market Analysis, Insights and Forecast - by Types
- 8.2.1. Metal
- 8.2.2. Plastic
- 8.1. Market Analysis, Insights and Forecast - by Application
- 9. Europe Biohazardous Waste Containers Analysis, Insights and Forecast, 2020-2032
- 9.1. Market Analysis, Insights and Forecast - by Application
- 9.1.1. Hospital
- 9.1.2. Laboratory
- 9.2. Market Analysis, Insights and Forecast - by Types
- 9.2.1. Metal
- 9.2.2. Plastic
- 9.1. Market Analysis, Insights and Forecast - by Application
- 10. Middle East & Africa Biohazardous Waste Containers Analysis, Insights and Forecast, 2020-2032
- 10.1. Market Analysis, Insights and Forecast - by Application
- 10.1.1. Hospital
- 10.1.2. Laboratory
- 10.2. Market Analysis, Insights and Forecast - by Types
- 10.2.1. Metal
- 10.2.2. Plastic
- 10.1. Market Analysis, Insights and Forecast - by Application
- 11. Asia Pacific Biohazardous Waste Containers Analysis, Insights and Forecast, 2020-2032
- 11.1. Market Analysis, Insights and Forecast - by Application
- 11.1.1. Hospital
- 11.1.2. Laboratory
- 11.2. Market Analysis, Insights and Forecast - by Types
- 11.2.1. Metal
- 11.2.2. Plastic
- 11.1. Market Analysis, Insights and Forecast - by Application
- 12. Competitive Analysis
- 12.1. Company Profiles
- 12.1.1 Bemis Health Care
- 12.1.1.1. Company Overview
- 12.1.1.2. Products
- 12.1.1.3. Company Financials
- 12.1.1.4. SWOT Analysis
- 12.1.2 Flambeau
- 12.1.2.1. Company Overview
- 12.1.2.2. Products
- 12.1.2.3. Company Financials
- 12.1.2.4. SWOT Analysis
- 12.1.3 Custom-Pak
- 12.1.3.1. Company Overview
- 12.1.3.2. Products
- 12.1.3.3. Company Financials
- 12.1.3.4. SWOT Analysis
- 12.1.4 DESTACO
- 12.1.4.1. Company Overview
- 12.1.4.2. Products
- 12.1.4.3. Company Financials
- 12.1.4.4. SWOT Analysis
- 12.1.5 Elkhart Plastics
- 12.1.5.1. Company Overview
- 12.1.5.2. Products
- 12.1.5.3. Company Financials
- 12.1.5.4. SWOT Analysis
- 12.1.6 Cryopak
- 12.1.6.1. Company Overview
- 12.1.6.2. Products
- 12.1.6.3. Company Financials
- 12.1.6.4. SWOT Analysis
- 12.1.7 Toter
- 12.1.7.1. Company Overview
- 12.1.7.2. Products
- 12.1.7.3. Company Financials
- 12.1.7.4. SWOT Analysis
- 12.1.8 Bondtech Corporation
- 12.1.8.1. Company Overview
- 12.1.8.2. Products
- 12.1.8.3. Company Financials
- 12.1.8.4. SWOT Analysis
- 12.1.9 AVANTech
- 12.1.9.1. Company Overview
- 12.1.9.2. Products
- 12.1.9.3. Company Financials
- 12.1.9.4. SWOT Analysis
- 12.1.10 PMF Industries
- 12.1.10.1. Company Overview
- 12.1.10.2. Products
- 12.1.10.3. Company Financials
- 12.1.10.4. SWOT Analysis
- 12.1.11 MarShield
- 12.1.11.1. Company Overview
- 12.1.11.2. Products
- 12.1.11.3. Company Financials
- 12.1.11.4. SWOT Analysis
- 12.1.12 Skolnik Industries
- 12.1.12.1. Company Overview
- 12.1.12.2. Products
- 12.1.12.3. Company Financials
- 12.1.12.4. SWOT Analysis
- 12.1.13 AFC Industries
- 12.1.13.1. Company Overview
- 12.1.13.2. Products
- 12.1.13.3. Company Financials
- 12.1.13.4. SWOT Analysis
- 12.1.14 Container Technologies Industries
- 12.1.14.1. Company Overview
- 12.1.14.2. Products
- 12.1.14.3. Company Financials
- 12.1.14.4. SWOT Analysis
- 12.1.15 Ultraray Radiation Protection
- 12.1.15.1. Company Overview
- 12.1.15.2. Products
- 12.1.15.3. Company Financials
- 12.1.15.4. SWOT Analysis
- 12.1.16 Extra Packaging
- 12.1.16.1. Company Overview
- 12.1.16.2. Products
- 12.1.16.3. Company Financials
- 12.1.16.4. SWOT Analysis
- 12.1.17 CK Composites
- 12.1.17.1. Company Overview
- 12.1.17.2. Products
- 12.1.17.3. Company Financials
- 12.1.17.4. SWOT Analysis
- 12.1.18 Medi-Ray
- 12.1.18.1. Company Overview
- 12.1.18.2. Products
- 12.1.18.3. Company Financials
- 12.1.18.4. SWOT Analysis
- 12.1.19 South Atlantic Services
- 12.1.19.1. Company Overview
- 12.1.19.2. Products
- 12.1.19.3. Company Financials
- 12.1.19.4. SWOT Analysis
- 12.1.20 M&M Industries
- 12.1.20.1. Company Overview
- 12.1.20.2. Products
- 12.1.20.3. Company Financials
- 12.1.20.4. SWOT Analysis
- 12.1.21 Chattanooga Box
- 12.1.21.1. Company Overview
- 12.1.21.2. Products
- 12.1.21.3. Company Financials
- 12.1.21.4. SWOT Analysis
- 12.1.22 Berenz Packaging Corporation
- 12.1.22.1. Company Overview
- 12.1.22.2. Products
- 12.1.22.3. Company Financials
- 12.1.22.4. SWOT Analysis
- 12.1.1 Bemis Health Care
- 12.2. Market Entropy
- 12.2.1 Company's Key Areas Served
- 12.2.2 Recent Developments
- 12.3. Company Market Share Analysis 2025
- 12.3.1 Top 5 Companies Market Share Analysis
- 12.3.2 Top 3 Companies Market Share Analysis
- 12.4. List of Potential Customers
- 13. Research Methodology
List of Figures
- Figure 1: Global Biohazardous Waste Containers Revenue Breakdown (million, %) by Region 2025 & 2033
- Figure 2: Global Biohazardous Waste Containers Volume Breakdown (K, %) by Region 2025 & 2033
- Figure 3: North America Biohazardous Waste Containers Revenue (million), by Application 2025 & 2033
- Figure 4: North America Biohazardous Waste Containers Volume (K), by Application 2025 & 2033
- Figure 5: North America Biohazardous Waste Containers Revenue Share (%), by Application 2025 & 2033
- Figure 6: North America Biohazardous Waste Containers Volume Share (%), by Application 2025 & 2033
- Figure 7: North America Biohazardous Waste Containers Revenue (million), by Types 2025 & 2033
- Figure 8: North America Biohazardous Waste Containers Volume (K), by Types 2025 & 2033
- Figure 9: North America Biohazardous Waste Containers Revenue Share (%), by Types 2025 & 2033
- Figure 10: North America Biohazardous Waste Containers Volume Share (%), by Types 2025 & 2033
- Figure 11: North America Biohazardous Waste Containers Revenue (million), by Country 2025 & 2033
- Figure 12: North America Biohazardous Waste Containers Volume (K), by Country 2025 & 2033
- Figure 13: North America Biohazardous Waste Containers Revenue Share (%), by Country 2025 & 2033
- Figure 14: North America Biohazardous Waste Containers Volume Share (%), by Country 2025 & 2033
- Figure 15: South America Biohazardous Waste Containers Revenue (million), by Application 2025 & 2033
- Figure 16: South America Biohazardous Waste Containers Volume (K), by Application 2025 & 2033
- Figure 17: South America Biohazardous Waste Containers Revenue Share (%), by Application 2025 & 2033
- Figure 18: South America Biohazardous Waste Containers Volume Share (%), by Application 2025 & 2033
- Figure 19: South America Biohazardous Waste Containers Revenue (million), by Types 2025 & 2033
- Figure 20: South America Biohazardous Waste Containers Volume (K), by Types 2025 & 2033
- Figure 21: South America Biohazardous Waste Containers Revenue Share (%), by Types 2025 & 2033
- Figure 22: South America Biohazardous Waste Containers Volume Share (%), by Types 2025 & 2033
- Figure 23: South America Biohazardous Waste Containers Revenue (million), by Country 2025 & 2033
- Figure 24: South America Biohazardous Waste Containers Volume (K), by Country 2025 & 2033
- Figure 25: South America Biohazardous Waste Containers Revenue Share (%), by Country 2025 & 2033
- Figure 26: South America Biohazardous Waste Containers Volume Share (%), by Country 2025 & 2033
- Figure 27: Europe Biohazardous Waste Containers Revenue (million), by Application 2025 & 2033
- Figure 28: Europe Biohazardous Waste Containers Volume (K), by Application 2025 & 2033
- Figure 29: Europe Biohazardous Waste Containers Revenue Share (%), by Application 2025 & 2033
- Figure 30: Europe Biohazardous Waste Containers Volume Share (%), by Application 2025 & 2033
- Figure 31: Europe Biohazardous Waste Containers Revenue (million), by Types 2025 & 2033
- Figure 32: Europe Biohazardous Waste Containers Volume (K), by Types 2025 & 2033
- Figure 33: Europe Biohazardous Waste Containers Revenue Share (%), by Types 2025 & 2033
- Figure 34: Europe Biohazardous Waste Containers Volume Share (%), by Types 2025 & 2033
- Figure 35: Europe Biohazardous Waste Containers Revenue (million), by Country 2025 & 2033
- Figure 36: Europe Biohazardous Waste Containers Volume (K), by Country 2025 & 2033
- Figure 37: Europe Biohazardous Waste Containers Revenue Share (%), by Country 2025 & 2033
- Figure 38: Europe Biohazardous Waste Containers Volume Share (%), by Country 2025 & 2033
- Figure 39: Middle East & Africa Biohazardous Waste Containers Revenue (million), by Application 2025 & 2033
- Figure 40: Middle East & Africa Biohazardous Waste Containers Volume (K), by Application 2025 & 2033
- Figure 41: Middle East & Africa Biohazardous Waste Containers Revenue Share (%), by Application 2025 & 2033
- Figure 42: Middle East & Africa Biohazardous Waste Containers Volume Share (%), by Application 2025 & 2033
- Figure 43: Middle East & Africa Biohazardous Waste Containers Revenue (million), by Types 2025 & 2033
- Figure 44: Middle East & Africa Biohazardous Waste Containers Volume (K), by Types 2025 & 2033
- Figure 45: Middle East & Africa Biohazardous Waste Containers Revenue Share (%), by Types 2025 & 2033
- Figure 46: Middle East & Africa Biohazardous Waste Containers Volume Share (%), by Types 2025 & 2033
- Figure 47: Middle East & Africa Biohazardous Waste Containers Revenue (million), by Country 2025 & 2033
- Figure 48: Middle East & Africa Biohazardous Waste Containers Volume (K), by Country 2025 & 2033
- Figure 49: Middle East & Africa Biohazardous Waste Containers Revenue Share (%), by Country 2025 & 2033
- Figure 50: Middle East & Africa Biohazardous Waste Containers Volume Share (%), by Country 2025 & 2033
- Figure 51: Asia Pacific Biohazardous Waste Containers Revenue (million), by Application 2025 & 2033
- Figure 52: Asia Pacific Biohazardous Waste Containers Volume (K), by Application 2025 & 2033
- Figure 53: Asia Pacific Biohazardous Waste Containers Revenue Share (%), by Application 2025 & 2033
- Figure 54: Asia Pacific Biohazardous Waste Containers Volume Share (%), by Application 2025 & 2033
- Figure 55: Asia Pacific Biohazardous Waste Containers Revenue (million), by Types 2025 & 2033
- Figure 56: Asia Pacific Biohazardous Waste Containers Volume (K), by Types 2025 & 2033
- Figure 57: Asia Pacific Biohazardous Waste Containers Revenue Share (%), by Types 2025 & 2033
- Figure 58: Asia Pacific Biohazardous Waste Containers Volume Share (%), by Types 2025 & 2033
- Figure 59: Asia Pacific Biohazardous Waste Containers Revenue (million), by Country 2025 & 2033
- Figure 60: Asia Pacific Biohazardous Waste Containers Volume (K), by Country 2025 & 2033
- Figure 61: Asia Pacific Biohazardous Waste Containers Revenue Share (%), by Country 2025 & 2033
- Figure 62: Asia Pacific Biohazardous Waste Containers Volume Share (%), by Country 2025 & 2033
List of Tables
- Table 1: Global Biohazardous Waste Containers Revenue million Forecast, by Application 2020 & 2033
- Table 2: Global Biohazardous Waste Containers Volume K Forecast, by Application 2020 & 2033
- Table 3: Global Biohazardous Waste Containers Revenue million Forecast, by Types 2020 & 2033
- Table 4: Global Biohazardous Waste Containers Volume K Forecast, by Types 2020 & 2033
- Table 5: Global Biohazardous Waste Containers Revenue million Forecast, by Region 2020 & 2033
- Table 6: Global Biohazardous Waste Containers Volume K Forecast, by Region 2020 & 2033
- Table 7: Global Biohazardous Waste Containers Revenue million Forecast, by Application 2020 & 2033
- Table 8: Global Biohazardous Waste Containers Volume K Forecast, by Application 2020 & 2033
- Table 9: Global Biohazardous Waste Containers Revenue million Forecast, by Types 2020 & 2033
- Table 10: Global Biohazardous Waste Containers Volume K Forecast, by Types 2020 & 2033
- Table 11: Global Biohazardous Waste Containers Revenue million Forecast, by Country 2020 & 2033
- Table 12: Global Biohazardous Waste Containers Volume K Forecast, by Country 2020 & 2033
- Table 13: United States Biohazardous Waste Containers Revenue (million) Forecast, by Application 2020 & 2033
- Table 14: United States Biohazardous Waste Containers Volume (K) Forecast, by Application 2020 & 2033
- Table 15: Canada Biohazardous Waste Containers Revenue (million) Forecast, by Application 2020 & 2033
- Table 16: Canada Biohazardous Waste Containers Volume (K) Forecast, by Application 2020 & 2033
- Table 17: Mexico Biohazardous Waste Containers Revenue (million) Forecast, by Application 2020 & 2033
- Table 18: Mexico Biohazardous Waste Containers Volume (K) Forecast, by Application 2020 & 2033
- Table 19: Global Biohazardous Waste Containers Revenue million Forecast, by Application 2020 & 2033
- Table 20: Global Biohazardous Waste Containers Volume K Forecast, by Application 2020 & 2033
- Table 21: Global Biohazardous Waste Containers Revenue million Forecast, by Types 2020 & 2033
- Table 22: Global Biohazardous Waste Containers Volume K Forecast, by Types 2020 & 2033
- Table 23: Global Biohazardous Waste Containers Revenue million Forecast, by Country 2020 & 2033
- Table 24: Global Biohazardous Waste Containers Volume K Forecast, by Country 2020 & 2033
- Table 25: Brazil Biohazardous Waste Containers Revenue (million) Forecast, by Application 2020 & 2033
- Table 26: Brazil Biohazardous Waste Containers Volume (K) Forecast, by Application 2020 & 2033
- Table 27: Argentina Biohazardous Waste Containers Revenue (million) Forecast, by Application 2020 & 2033
- Table 28: Argentina Biohazardous Waste Containers Volume (K) Forecast, by Application 2020 & 2033
- Table 29: Rest of South America Biohazardous Waste Containers Revenue (million) Forecast, by Application 2020 & 2033
- Table 30: Rest of South America Biohazardous Waste Containers Volume (K) Forecast, by Application 2020 & 2033
- Table 31: Global Biohazardous Waste Containers Revenue million Forecast, by Application 2020 & 2033
- Table 32: Global Biohazardous Waste Containers Volume K Forecast, by Application 2020 & 2033
- Table 33: Global Biohazardous Waste Containers Revenue million Forecast, by Types 2020 & 2033
- Table 34: Global Biohazardous Waste Containers Volume K Forecast, by Types 2020 & 2033
- Table 35: Global Biohazardous Waste Containers Revenue million Forecast, by Country 2020 & 2033
- Table 36: Global Biohazardous Waste Containers Volume K Forecast, by Country 2020 & 2033
- Table 37: United Kingdom Biohazardous Waste Containers Revenue (million) Forecast, by Application 2020 & 2033
- Table 38: United Kingdom Biohazardous Waste Containers Volume (K) Forecast, by Application 2020 & 2033
- Table 39: Germany Biohazardous Waste Containers Revenue (million) Forecast, by Application 2020 & 2033
- Table 40: Germany Biohazardous Waste Containers Volume (K) Forecast, by Application 2020 & 2033
- Table 41: France Biohazardous Waste Containers Revenue (million) Forecast, by Application 2020 & 2033
- Table 42: France Biohazardous Waste Containers Volume (K) Forecast, by Application 2020 & 2033
- Table 43: Italy Biohazardous Waste Containers Revenue (million) Forecast, by Application 2020 & 2033
- Table 44: Italy Biohazardous Waste Containers Volume (K) Forecast, by Application 2020 & 2033
- Table 45: Spain Biohazardous Waste Containers Revenue (million) Forecast, by Application 2020 & 2033
- Table 46: Spain Biohazardous Waste Containers Volume (K) Forecast, by Application 2020 & 2033
- Table 47: Russia Biohazardous Waste Containers Revenue (million) Forecast, by Application 2020 & 2033
- Table 48: Russia Biohazardous Waste Containers Volume (K) Forecast, by Application 2020 & 2033
- Table 49: Benelux Biohazardous Waste Containers Revenue (million) Forecast, by Application 2020 & 2033
- Table 50: Benelux Biohazardous Waste Containers Volume (K) Forecast, by Application 2020 & 2033
- Table 51: Nordics Biohazardous Waste Containers Revenue (million) Forecast, by Application 2020 & 2033
- Table 52: Nordics Biohazardous Waste Containers Volume (K) Forecast, by Application 2020 & 2033
- Table 53: Rest of Europe Biohazardous Waste Containers Revenue (million) Forecast, by Application 2020 & 2033
- Table 54: Rest of Europe Biohazardous Waste Containers Volume (K) Forecast, by Application 2020 & 2033
- Table 55: Global Biohazardous Waste Containers Revenue million Forecast, by Application 2020 & 2033
- Table 56: Global Biohazardous Waste Containers Volume K Forecast, by Application 2020 & 2033
- Table 57: Global Biohazardous Waste Containers Revenue million Forecast, by Types 2020 & 2033
- Table 58: Global Biohazardous Waste Containers Volume K Forecast, by Types 2020 & 2033
- Table 59: Global Biohazardous Waste Containers Revenue million Forecast, by Country 2020 & 2033
- Table 60: Global Biohazardous Waste Containers Volume K Forecast, by Country 2020 & 2033
- Table 61: Turkey Biohazardous Waste Containers Revenue (million) Forecast, by Application 2020 & 2033
- Table 62: Turkey Biohazardous Waste Containers Volume (K) Forecast, by Application 2020 & 2033
- Table 63: Israel Biohazardous Waste Containers Revenue (million) Forecast, by Application 2020 & 2033
- Table 64: Israel Biohazardous Waste Containers Volume (K) Forecast, by Application 2020 & 2033
- Table 65: GCC Biohazardous Waste Containers Revenue (million) Forecast, by Application 2020 & 2033
- Table 66: GCC Biohazardous Waste Containers Volume (K) Forecast, by Application 2020 & 2033
- Table 67: North Africa Biohazardous Waste Containers Revenue (million) Forecast, by Application 2020 & 2033
- Table 68: North Africa Biohazardous Waste Containers Volume (K) Forecast, by Application 2020 & 2033
- Table 69: South Africa Biohazardous Waste Containers Revenue (million) Forecast, by Application 2020 & 2033
- Table 70: South Africa Biohazardous Waste Containers Volume (K) Forecast, by Application 2020 & 2033
- Table 71: Rest of Middle East & Africa Biohazardous Waste Containers Revenue (million) Forecast, by Application 2020 & 2033
- Table 72: Rest of Middle East & Africa Biohazardous Waste Containers Volume (K) Forecast, by Application 2020 & 2033
- Table 73: Global Biohazardous Waste Containers Revenue million Forecast, by Application 2020 & 2033
- Table 74: Global Biohazardous Waste Containers Volume K Forecast, by Application 2020 & 2033
- Table 75: Global Biohazardous Waste Containers Revenue million Forecast, by Types 2020 & 2033
- Table 76: Global Biohazardous Waste Containers Volume K Forecast, by Types 2020 & 2033
- Table 77: Global Biohazardous Waste Containers Revenue million Forecast, by Country 2020 & 2033
- Table 78: Global Biohazardous Waste Containers Volume K Forecast, by Country 2020 & 2033
- Table 79: China Biohazardous Waste Containers Revenue (million) Forecast, by Application 2020 & 2033
- Table 80: China Biohazardous Waste Containers Volume (K) Forecast, by Application 2020 & 2033
- Table 81: India Biohazardous Waste Containers Revenue (million) Forecast, by Application 2020 & 2033
- Table 82: India Biohazardous Waste Containers Volume (K) Forecast, by Application 2020 & 2033
- Table 83: Japan Biohazardous Waste Containers Revenue (million) Forecast, by Application 2020 & 2033
- Table 84: Japan Biohazardous Waste Containers Volume (K) Forecast, by Application 2020 & 2033
- Table 85: South Korea Biohazardous Waste Containers Revenue (million) Forecast, by Application 2020 & 2033
- Table 86: South Korea Biohazardous Waste Containers Volume (K) Forecast, by Application 2020 & 2033
- Table 87: ASEAN Biohazardous Waste Containers Revenue (million) Forecast, by Application 2020 & 2033
- Table 88: ASEAN Biohazardous Waste Containers Volume (K) Forecast, by Application 2020 & 2033
- Table 89: Oceania Biohazardous Waste Containers Revenue (million) Forecast, by Application 2020 & 2033
- Table 90: Oceania Biohazardous Waste Containers Volume (K) Forecast, by Application 2020 & 2033
- Table 91: Rest of Asia Pacific Biohazardous Waste Containers Revenue (million) Forecast, by Application 2020 & 2033
- Table 92: Rest of Asia Pacific Biohazardous Waste Containers Volume (K) Forecast, by Application 2020 & 2033
Frequently Asked Questions
1. What is the projected Compound Annual Growth Rate (CAGR) of the Biohazardous Waste Containers?
The projected CAGR is approximately 7.6%.
2. Which companies are prominent players in the Biohazardous Waste Containers?
Key companies in the market include Bemis Health Care, Flambeau, Custom-Pak, DESTACO, Elkhart Plastics, Cryopak, Toter, Bondtech Corporation, AVANTech, PMF Industries, MarShield, Skolnik Industries, AFC Industries, Container Technologies Industries, Ultraray Radiation Protection, Extra Packaging, CK Composites, Medi-Ray, South Atlantic Services, M&M Industries, Chattanooga Box, Berenz Packaging Corporation.
3. What are the main segments of the Biohazardous Waste Containers?
The market segments include Application, Types.
4. Can you provide details about the market size?
The market size is estimated to be USD 541.28 million as of 2022.
5. What are some drivers contributing to market growth?
N/A
6. What are the notable trends driving market growth?
N/A
7. Are there any restraints impacting market growth?
N/A
8. Can you provide examples of recent developments in the market?
N/A
9. What pricing options are available for accessing the report?
Pricing options include single-user, multi-user, and enterprise licenses priced at USD 3950.00, USD 5925.00, and USD 7900.00 respectively.
10. Is the market size provided in terms of value or volume?
The market size is provided in terms of value, measured in million and volume, measured in K.
11. Are there any specific market keywords associated with the report?
Yes, the market keyword associated with the report is "Biohazardous Waste Containers," which aids in identifying and referencing the specific market segment covered.
12. How do I determine which pricing option suits my needs best?
The pricing options vary based on user requirements and access needs. Individual users may opt for single-user licenses, while businesses requiring broader access may choose multi-user or enterprise licenses for cost-effective access to the report.
13. Are there any additional resources or data provided in the Biohazardous Waste Containers report?
While the report offers comprehensive insights, it's advisable to review the specific contents or supplementary materials provided to ascertain if additional resources or data are available.
14. How can I stay updated on further developments or reports in the Biohazardous Waste Containers?
To stay informed about further developments, trends, and reports in the Biohazardous Waste Containers, consider subscribing to industry newsletters, following relevant companies and organizations, or regularly checking reputable industry news sources and publications.
Methodology
Step 1 - Identification of Relevant Samples Size from Population Database


Step 2 - Approaches for Defining Global Market Size (Value, Volume* & Price*)

Note*: In applicable scenarios
Step 3 - Data Sources
Primary Research
- Web Analytics
- Survey Reports
- Research Institute
- Latest Research Reports
- Opinion Leaders
Secondary Research
- Annual Reports
- White Paper
- Latest Press Release
- Industry Association
- Paid Database
- Investor Presentations

Step 4 - Data Triangulation
Involves using different sources of information in order to increase the validity of a study
These sources are likely to be stakeholders in a program - participants, other researchers, program staff, other community members, and so on.
Then we put all data in single framework & apply various statistical tools to find out the dynamic on the market.
During the analysis stage, feedback from the stakeholder groups would be compared to determine areas of agreement as well as areas of divergence