

Key Insights
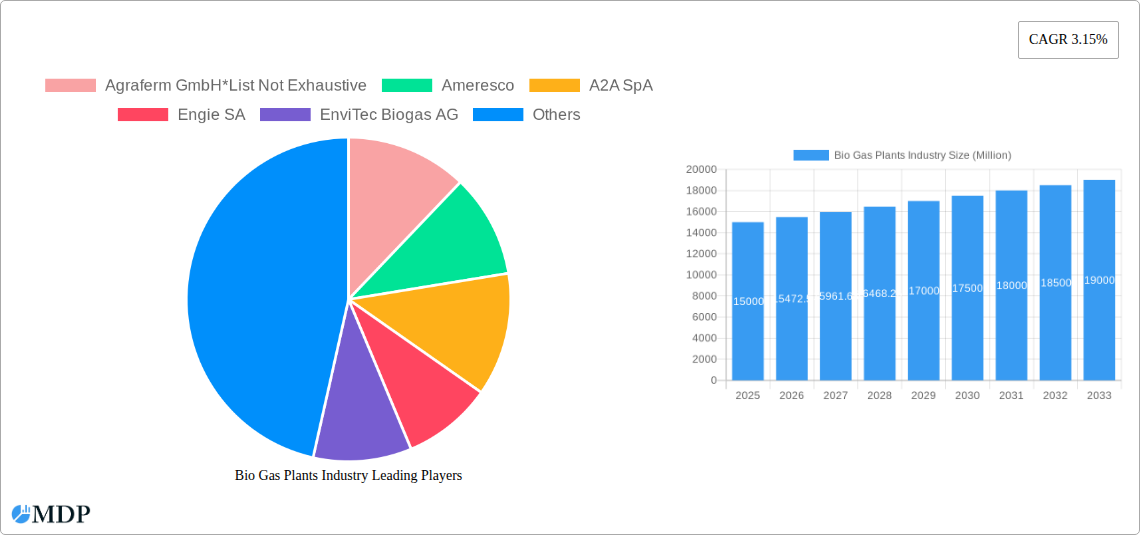
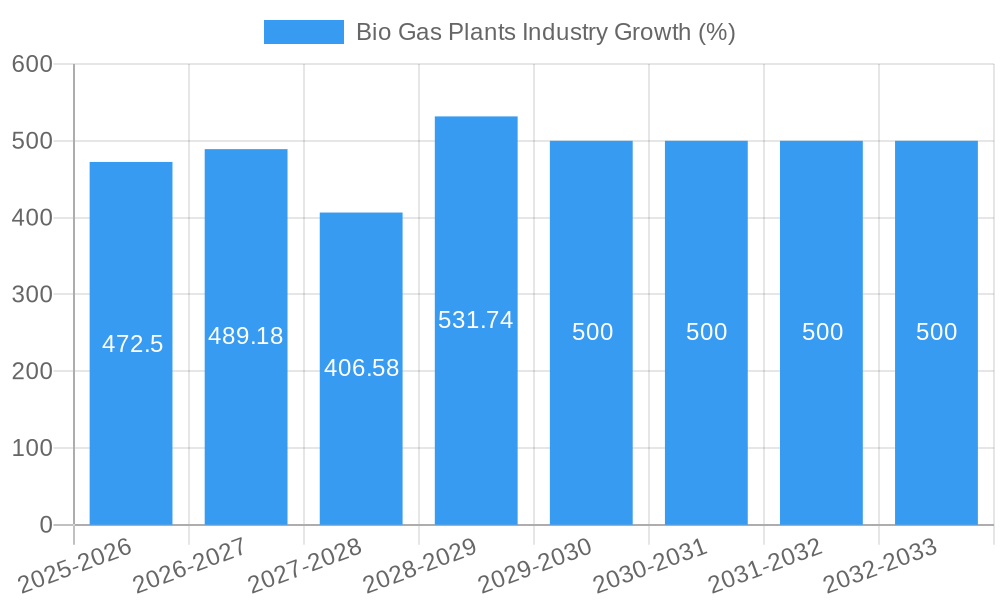
The biogas plant industry is experiencing steady growth, projected at a CAGR of 3.15% from 2025 to 2033. This expansion is driven by increasing concerns about climate change and the need for renewable energy sources, coupled with supportive government policies and subsidies promoting sustainable energy solutions. The market is segmented by plant type (small-scale, medium-to-large-scale) and application (electricity generation, biofuel, heat generation). Medium-to-large-scale digesters are currently dominating the market due to higher energy output and economies of scale, but smaller-scale plants are gaining traction in rural and agricultural areas due to their decentralized nature and suitability for smaller waste streams. Electricity generation is the leading application, driven by the growing demand for clean electricity and the ability of biogas plants to provide a reliable energy source. However, the biofuel and heat generation segments are also showing significant potential, particularly as advancements in technology increase efficiency and reduce costs. Geographic growth varies; Europe and Asia-Pacific currently hold significant market shares due to established biogas infrastructures and supportive regulatory frameworks, but North America and other regions are witnessing increasing adoption rates fueled by investment in renewable energy infrastructure and the rising cost of fossil fuels. Challenges remain, including the high initial investment costs for setting up biogas plants, inconsistent feedstock availability, and technical complexities involved in plant operation and maintenance. However, ongoing technological advancements, improved feedstock management practices, and the increasing availability of financing options are gradually mitigating these challenges.
Technological innovations, including improved anaerobic digestion techniques and enhanced biogas upgrading technologies, are driving efficiency gains and reducing the overall cost of biogas production. This is further attracting investment and expanding the market's reach into new geographical areas and applications. The rising prices of fossil fuels are also making biogas a more economically viable alternative, boosting demand and creating further incentives for adoption. Moreover, the evolving regulatory landscape, with increasing mandates for renewable energy integration and carbon emission reduction targets, is creating a favorable environment for the biogas sector's continued expansion. Competitive landscape analysis reveals a mix of established multinational corporations and smaller, specialized players, suggesting ongoing innovation and competition in the market. Future growth prospects will depend on sustained government support, further technological breakthroughs, and a consistent supply of suitable organic feedstock.
Biogas Plants Industry Market Report: 2019-2033 Forecast
Unlock the potential of the booming biogas plants market with our comprehensive report, providing in-depth analysis and actionable insights for strategic decision-making. This detailed report covers the global biogas plants industry, analyzing market dynamics, trends, leading players, and future growth prospects from 2019 to 2033. The study period covers 2019-2033, with 2025 as the base and estimated year. The forecast period spans 2025-2033, and the historical period covers 2019-2024. Expected market value figures are represented as 'xx Million' where precise data is unavailable.
Target Audience: Investors, industry professionals, government agencies, and research firms seeking a comprehensive understanding of the biogas plants market.
Bio Gas Plants Industry Market Dynamics & Concentration
This section analyzes the market concentration, innovation drivers, regulatory frameworks, product substitutes, end-user trends, and M&A activities within the Biogas Plants industry. The global biogas plants market exhibits a moderately consolidated structure, with key players holding significant market share. The market share of the top 5 players is estimated at xx%, indicating opportunities for both established and emerging companies. Innovation in biogas plant technologies, driven by advancements in digester design and energy recovery systems, continues to stimulate market growth. Stringent environmental regulations globally are major drivers, pushing the adoption of renewable energy sources like biogas. Competition from other renewable energy sources, like solar and wind power, represents a key challenge, influencing market dynamics.
- Market Concentration: Top 5 players hold an estimated xx% market share (2025).
- M&A Activity: An estimated xx M&A deals occurred between 2019 and 2024.
- Innovation Drivers: Advancements in digester design, energy recovery, and waste-to-energy technologies.
- Regulatory Frameworks: Government incentives and mandates for renewable energy adoption are crucial.
- Product Substitutes: Competition from other renewable energy sources (solar, wind).
- End-User Trends: Growing demand from diverse sectors, including electricity generation, biofuel production, and heat generation.
Bio Gas Plants Industry Industry Trends & Analysis
The global biogas plants market is experiencing robust growth, driven by increasing environmental concerns, government support for renewable energy, and the rising demand for sustainable energy solutions. The Compound Annual Growth Rate (CAGR) for the forecast period (2025-2033) is estimated at xx%. Market penetration is increasing across diverse geographic regions, with significant growth anticipated in developing economies. Technological disruptions, such as advancements in anaerobic digestion techniques and improved biogas upgrading technologies, are enhancing efficiency and expanding applications. Consumer preferences are shifting towards sustainable and eco-friendly energy solutions, further bolstering market demand. Competitive dynamics are marked by both established industry players and emerging companies vying for market share through product innovation, technological advancements, and strategic partnerships.
Leading Markets & Segments in Bio Gas Plants Industry
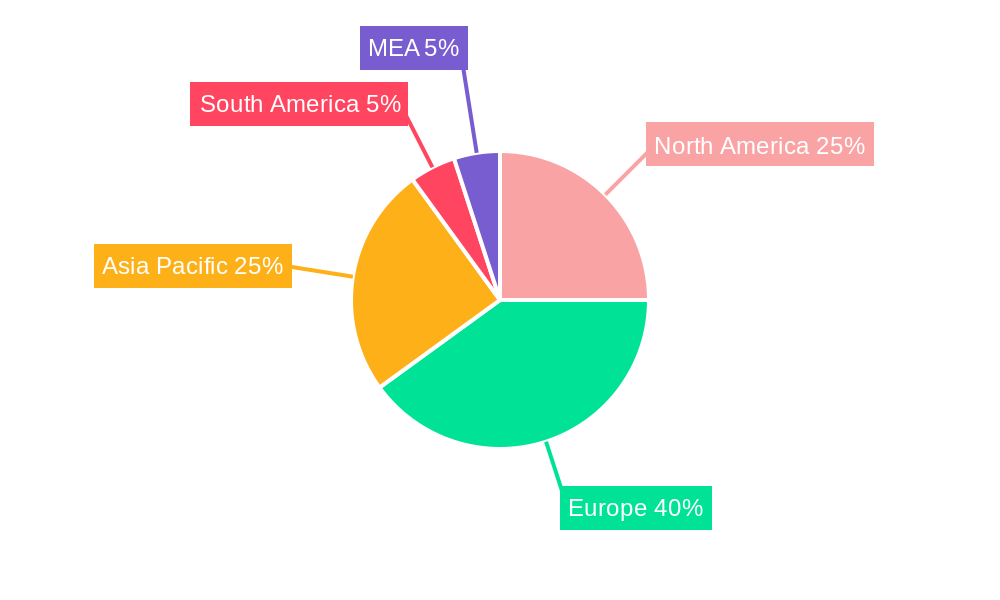
The leading market segment in terms of both revenue and growth potential is currently the medium- to large-scale digester segment, driven by economies of scale and the ability to accommodate large volumes of feedstock. Geographically, Europe and North America are currently the dominant regions. Key drivers for this dominance include favorable regulatory policies, robust infrastructure, and established technological expertise. However, Asia-Pacific is poised for significant growth in the coming years. Specific examples are shown below.
Biogas Plant Type:
- Medium- to Large-scale Digesters: Dominates the market due to economies of scale and higher energy output. xx Million in revenue in 2025.
- Small-scale Digesters: Growing segment, particularly in rural and agricultural applications. xx Million in revenue in 2025.
Application:
- Electricity Generation: Largest application segment due to the increasing demand for renewable energy. xx Million in revenue in 2025.
- Biofuel: Significant growth potential driven by policies promoting biofuels as a transportation fuel. xx Million in revenue in 2025.
- Heat Generation: Steady growth driven by the need for sustainable heating solutions in industrial and residential sectors. xx Million in revenue in 2025.
Geographic Dominance:
- Europe: Strong regulatory support for renewable energy and established biogas infrastructure.
- North America: Growing demand for renewable natural gas (RNG) and government incentives.
- Asia-Pacific: High growth potential, driven by increasing industrialization and rising environmental concerns.
Bio Gas Plants Industry Product Developments
Recent product developments focus on improving efficiency, reducing operating costs, and expanding applications. This includes advancements in digester design, utilizing innovative materials for improved durability and reduced energy consumption. The integration of advanced sensors and control systems enables real-time monitoring and optimization of biogas production. New technologies are also improving biogas upgrading to produce higher-quality biomethane suitable for injection into natural gas grids. The market is adapting to the need for smaller, more flexible systems for decentralized applications.
Key Drivers of Bio Gas Plants Industry Growth
The Biogas Plants industry is experiencing strong growth driven by several factors: stringent environmental regulations promoting renewable energy, government subsidies and incentives for biogas projects, rising energy prices creating demand for alternative fuel sources, increasing availability of suitable feedstock (agricultural residues, municipal waste), and technological advancements enhancing biogas production efficiency and reducing costs.
Challenges in the Bio Gas Plants Industry Market
Several challenges hinder the growth of the biogas plants industry: high initial capital investment costs for plant construction, variability in feedstock quality and availability affecting production consistency, difficulties in securing long-term contracts for biogas sales, stringent environmental regulations requiring compliance and permitting, and competition from other renewable energy technologies. These factors can limit market penetration and profitability.
Emerging Opportunities in Bio Gas Plants Industry
Significant opportunities exist for growth in biogas plant technologies. This includes expanding the use of biogas for transportation fuel (biomethane), developing innovative digester designs for enhanced efficiency, leveraging digital technologies for predictive maintenance and remote monitoring, and exploring new feedstock sources such as algae and industrial waste streams. Strategic partnerships between technology providers, energy companies, and waste management firms can further accelerate market expansion.
Leading Players in the Bio Gas Plants Industry Sector
- Agraferm GmbH
- Ameresco
- A2A SpA
- Engie SA
- EnviTec Biogas AG
- BTS Biogas SRL/GmbH
- Gasum Oy
- Air Liquide SA
- AB Holding SpA (Gruppo AB)
- FWE GmbH
- Scandinavian Biogas
Key Milestones in Bio Gas Plants Industry Industry
- August 2021: Greenlane Renewables Inc. signed USD 10.2 million in contracts for RNG projects in the US, highlighting the growing demand for renewable natural gas.
Strategic Outlook for Bio Gas Plants Industry Market
The biogas plants market presents a significant growth opportunity in the coming years, driven by increasing environmental awareness, government policies favoring renewable energy, and technological advancements. Strategic partnerships, investments in research and development, and expansion into new geographic markets will be key factors determining long-term success for industry players. The market is expected to continue its upward trajectory, with increasing demand from diverse sectors driving further growth and innovation.
Bio Gas Plants Industry Segmentation
-
1. Application
- 1.1. Electricity Generation
- 1.2. Biofuel
- 1.3. Heat Generation
-
2. Biogas Plant Type
- 2.1. Small-scale Digesters
- 2.2. Medium- to Large-scale Digesters
Bio Gas Plants Industry Segmentation By Geography
- 1. North America
- 2. Asia Pacific
- 3. Europe
- 4. South America
- 5. Middle East and Africa
Bio Gas Plants Industry REPORT HIGHLIGHTS
| Aspects | Details |
|---|---|
| Study Period | 2019-2033 |
| Base Year | 2024 |
| Estimated Year | 2025 |
| Forecast Period | 2025-2033 |
| Historical Period | 2019-2024 |
| Growth Rate | CAGR of 3.15% from 2019-2033 |
| Segmentation |
|
Table of Contents
- 1. Introduction
- 1.1. Research Scope
- 1.2. Market Segmentation
- 1.3. Research Methodology
- 1.4. Definitions and Assumptions
- 2. Executive Summary
- 2.1. Introduction
- 3. Market Dynamics
- 3.1. Introduction
- 3.2. Market Drivers
- 3.2.1. 4.; Increase in the Demand for Electricity4.; Rising Adoption of Electric Vehicles
- 3.3. Market Restrains
- 3.3.1. 4.; New Sources of Distributed Electricity Generation
- 3.4. Market Trends
- 3.4.1. Small-scale Digesters Expected to Witness Significant Growth
- 4. Market Factor Analysis
- 4.1. Porters Five Forces
- 4.2. Supply/Value Chain
- 4.3. PESTEL analysis
- 4.4. Market Entropy
- 4.5. Patent/Trademark Analysis
- 5. Global Bio Gas Plants Industry Analysis, Insights and Forecast, 2019-2031
- 5.1. Market Analysis, Insights and Forecast - by Application
- 5.1.1. Electricity Generation
- 5.1.2. Biofuel
- 5.1.3. Heat Generation
- 5.2. Market Analysis, Insights and Forecast - by Biogas Plant Type
- 5.2.1. Small-scale Digesters
- 5.2.2. Medium- to Large-scale Digesters
- 5.3. Market Analysis, Insights and Forecast - by Region
- 5.3.1. North America
- 5.3.2. Asia Pacific
- 5.3.3. Europe
- 5.3.4. South America
- 5.3.5. Middle East and Africa
- 5.1. Market Analysis, Insights and Forecast - by Application
- 6. North America Bio Gas Plants Industry Analysis, Insights and Forecast, 2019-2031
- 6.1. Market Analysis, Insights and Forecast - by Application
- 6.1.1. Electricity Generation
- 6.1.2. Biofuel
- 6.1.3. Heat Generation
- 6.2. Market Analysis, Insights and Forecast - by Biogas Plant Type
- 6.2.1. Small-scale Digesters
- 6.2.2. Medium- to Large-scale Digesters
- 6.1. Market Analysis, Insights and Forecast - by Application
- 7. Asia Pacific Bio Gas Plants Industry Analysis, Insights and Forecast, 2019-2031
- 7.1. Market Analysis, Insights and Forecast - by Application
- 7.1.1. Electricity Generation
- 7.1.2. Biofuel
- 7.1.3. Heat Generation
- 7.2. Market Analysis, Insights and Forecast - by Biogas Plant Type
- 7.2.1. Small-scale Digesters
- 7.2.2. Medium- to Large-scale Digesters
- 7.1. Market Analysis, Insights and Forecast - by Application
- 8. Europe Bio Gas Plants Industry Analysis, Insights and Forecast, 2019-2031
- 8.1. Market Analysis, Insights and Forecast - by Application
- 8.1.1. Electricity Generation
- 8.1.2. Biofuel
- 8.1.3. Heat Generation
- 8.2. Market Analysis, Insights and Forecast - by Biogas Plant Type
- 8.2.1. Small-scale Digesters
- 8.2.2. Medium- to Large-scale Digesters
- 8.1. Market Analysis, Insights and Forecast - by Application
- 9. South America Bio Gas Plants Industry Analysis, Insights and Forecast, 2019-2031
- 9.1. Market Analysis, Insights and Forecast - by Application
- 9.1.1. Electricity Generation
- 9.1.2. Biofuel
- 9.1.3. Heat Generation
- 9.2. Market Analysis, Insights and Forecast - by Biogas Plant Type
- 9.2.1. Small-scale Digesters
- 9.2.2. Medium- to Large-scale Digesters
- 9.1. Market Analysis, Insights and Forecast - by Application
- 10. Middle East and Africa Bio Gas Plants Industry Analysis, Insights and Forecast, 2019-2031
- 10.1. Market Analysis, Insights and Forecast - by Application
- 10.1.1. Electricity Generation
- 10.1.2. Biofuel
- 10.1.3. Heat Generation
- 10.2. Market Analysis, Insights and Forecast - by Biogas Plant Type
- 10.2.1. Small-scale Digesters
- 10.2.2. Medium- to Large-scale Digesters
- 10.1. Market Analysis, Insights and Forecast - by Application
- 11. North America Bio Gas Plants Industry Analysis, Insights and Forecast, 2019-2031
- 11.1. Market Analysis, Insights and Forecast - By Country/Sub-region
- 11.1.1 United States
- 11.1.2 Canada
- 11.1.3 Mexico
- 12. Europe Bio Gas Plants Industry Analysis, Insights and Forecast, 2019-2031
- 12.1. Market Analysis, Insights and Forecast - By Country/Sub-region
- 12.1.1 Germany
- 12.1.2 United Kingdom
- 12.1.3 France
- 12.1.4 Spain
- 12.1.5 Italy
- 12.1.6 Spain
- 12.1.7 Belgium
- 12.1.8 Netherland
- 12.1.9 Nordics
- 12.1.10 Rest of Europe
- 13. Asia Pacific Bio Gas Plants Industry Analysis, Insights and Forecast, 2019-2031
- 13.1. Market Analysis, Insights and Forecast - By Country/Sub-region
- 13.1.1 China
- 13.1.2 Japan
- 13.1.3 India
- 13.1.4 South Korea
- 13.1.5 Southeast Asia
- 13.1.6 Australia
- 13.1.7 Indonesia
- 13.1.8 Phillipes
- 13.1.9 Singapore
- 13.1.10 Thailandc
- 13.1.11 Rest of Asia Pacific
- 14. South America Bio Gas Plants Industry Analysis, Insights and Forecast, 2019-2031
- 14.1. Market Analysis, Insights and Forecast - By Country/Sub-region
- 14.1.1 Brazil
- 14.1.2 Argentina
- 14.1.3 Peru
- 14.1.4 Chile
- 14.1.5 Colombia
- 14.1.6 Ecuador
- 14.1.7 Venezuela
- 14.1.8 Rest of South America
- 15. North America Bio Gas Plants Industry Analysis, Insights and Forecast, 2019-2031
- 15.1. Market Analysis, Insights and Forecast - By Country/Sub-region
- 15.1.1 United States
- 15.1.2 Canada
- 15.1.3 Mexico
- 16. MEA Bio Gas Plants Industry Analysis, Insights and Forecast, 2019-2031
- 16.1. Market Analysis, Insights and Forecast - By Country/Sub-region
- 16.1.1 United Arab Emirates
- 16.1.2 Saudi Arabia
- 16.1.3 South Africa
- 16.1.4 Rest of Middle East and Africa
- 17. Competitive Analysis
- 17.1. Global Market Share Analysis 2024
- 17.2. Company Profiles
- 17.2.1 Agraferm GmbH*List Not Exhaustive
- 17.2.1.1. Overview
- 17.2.1.2. Products
- 17.2.1.3. SWOT Analysis
- 17.2.1.4. Recent Developments
- 17.2.1.5. Financials (Based on Availability)
- 17.2.2 Ameresco
- 17.2.2.1. Overview
- 17.2.2.2. Products
- 17.2.2.3. SWOT Analysis
- 17.2.2.4. Recent Developments
- 17.2.2.5. Financials (Based on Availability)
- 17.2.3 A2A SpA
- 17.2.3.1. Overview
- 17.2.3.2. Products
- 17.2.3.3. SWOT Analysis
- 17.2.3.4. Recent Developments
- 17.2.3.5. Financials (Based on Availability)
- 17.2.4 Engie SA
- 17.2.4.1. Overview
- 17.2.4.2. Products
- 17.2.4.3. SWOT Analysis
- 17.2.4.4. Recent Developments
- 17.2.4.5. Financials (Based on Availability)
- 17.2.5 EnviTec Biogas AG
- 17.2.5.1. Overview
- 17.2.5.2. Products
- 17.2.5.3. SWOT Analysis
- 17.2.5.4. Recent Developments
- 17.2.5.5. Financials (Based on Availability)
- 17.2.6 BTS Biogas SRL/GmbH
- 17.2.6.1. Overview
- 17.2.6.2. Products
- 17.2.6.3. SWOT Analysis
- 17.2.6.4. Recent Developments
- 17.2.6.5. Financials (Based on Availability)
- 17.2.7 Gasum Oy
- 17.2.7.1. Overview
- 17.2.7.2. Products
- 17.2.7.3. SWOT Analysis
- 17.2.7.4. Recent Developments
- 17.2.7.5. Financials (Based on Availability)
- 17.2.8 Air Liquide SA
- 17.2.8.1. Overview
- 17.2.8.2. Products
- 17.2.8.3. SWOT Analysis
- 17.2.8.4. Recent Developments
- 17.2.8.5. Financials (Based on Availability)
- 17.2.9 AB Holding SpA (Gruppo AB)
- 17.2.9.1. Overview
- 17.2.9.2. Products
- 17.2.9.3. SWOT Analysis
- 17.2.9.4. Recent Developments
- 17.2.9.5. Financials (Based on Availability)
- 17.2.10 FWE GmbH
- 17.2.10.1. Overview
- 17.2.10.2. Products
- 17.2.10.3. SWOT Analysis
- 17.2.10.4. Recent Developments
- 17.2.10.5. Financials (Based on Availability)
- 17.2.11 Scandinavian Biogas
- 17.2.11.1. Overview
- 17.2.11.2. Products
- 17.2.11.3. SWOT Analysis
- 17.2.11.4. Recent Developments
- 17.2.11.5. Financials (Based on Availability)
- 17.2.1 Agraferm GmbH*List Not Exhaustive
List of Figures
- Figure 1: Global Bio Gas Plants Industry Revenue Breakdown (Million, %) by Region 2024 & 2032
- Figure 2: North America Bio Gas Plants Industry Revenue (Million), by Country 2024 & 2032
- Figure 3: North America Bio Gas Plants Industry Revenue Share (%), by Country 2024 & 2032
- Figure 4: Europe Bio Gas Plants Industry Revenue (Million), by Country 2024 & 2032
- Figure 5: Europe Bio Gas Plants Industry Revenue Share (%), by Country 2024 & 2032
- Figure 6: Asia Pacific Bio Gas Plants Industry Revenue (Million), by Country 2024 & 2032
- Figure 7: Asia Pacific Bio Gas Plants Industry Revenue Share (%), by Country 2024 & 2032
- Figure 8: South America Bio Gas Plants Industry Revenue (Million), by Country 2024 & 2032
- Figure 9: South America Bio Gas Plants Industry Revenue Share (%), by Country 2024 & 2032
- Figure 10: North America Bio Gas Plants Industry Revenue (Million), by Country 2024 & 2032
- Figure 11: North America Bio Gas Plants Industry Revenue Share (%), by Country 2024 & 2032
- Figure 12: MEA Bio Gas Plants Industry Revenue (Million), by Country 2024 & 2032
- Figure 13: MEA Bio Gas Plants Industry Revenue Share (%), by Country 2024 & 2032
- Figure 14: North America Bio Gas Plants Industry Revenue (Million), by Application 2024 & 2032
- Figure 15: North America Bio Gas Plants Industry Revenue Share (%), by Application 2024 & 2032
- Figure 16: North America Bio Gas Plants Industry Revenue (Million), by Biogas Plant Type 2024 & 2032
- Figure 17: North America Bio Gas Plants Industry Revenue Share (%), by Biogas Plant Type 2024 & 2032
- Figure 18: North America Bio Gas Plants Industry Revenue (Million), by Country 2024 & 2032
- Figure 19: North America Bio Gas Plants Industry Revenue Share (%), by Country 2024 & 2032
- Figure 20: Asia Pacific Bio Gas Plants Industry Revenue (Million), by Application 2024 & 2032
- Figure 21: Asia Pacific Bio Gas Plants Industry Revenue Share (%), by Application 2024 & 2032
- Figure 22: Asia Pacific Bio Gas Plants Industry Revenue (Million), by Biogas Plant Type 2024 & 2032
- Figure 23: Asia Pacific Bio Gas Plants Industry Revenue Share (%), by Biogas Plant Type 2024 & 2032
- Figure 24: Asia Pacific Bio Gas Plants Industry Revenue (Million), by Country 2024 & 2032
- Figure 25: Asia Pacific Bio Gas Plants Industry Revenue Share (%), by Country 2024 & 2032
- Figure 26: Europe Bio Gas Plants Industry Revenue (Million), by Application 2024 & 2032
- Figure 27: Europe Bio Gas Plants Industry Revenue Share (%), by Application 2024 & 2032
- Figure 28: Europe Bio Gas Plants Industry Revenue (Million), by Biogas Plant Type 2024 & 2032
- Figure 29: Europe Bio Gas Plants Industry Revenue Share (%), by Biogas Plant Type 2024 & 2032
- Figure 30: Europe Bio Gas Plants Industry Revenue (Million), by Country 2024 & 2032
- Figure 31: Europe Bio Gas Plants Industry Revenue Share (%), by Country 2024 & 2032
- Figure 32: South America Bio Gas Plants Industry Revenue (Million), by Application 2024 & 2032
- Figure 33: South America Bio Gas Plants Industry Revenue Share (%), by Application 2024 & 2032
- Figure 34: South America Bio Gas Plants Industry Revenue (Million), by Biogas Plant Type 2024 & 2032
- Figure 35: South America Bio Gas Plants Industry Revenue Share (%), by Biogas Plant Type 2024 & 2032
- Figure 36: South America Bio Gas Plants Industry Revenue (Million), by Country 2024 & 2032
- Figure 37: South America Bio Gas Plants Industry Revenue Share (%), by Country 2024 & 2032
- Figure 38: Middle East and Africa Bio Gas Plants Industry Revenue (Million), by Application 2024 & 2032
- Figure 39: Middle East and Africa Bio Gas Plants Industry Revenue Share (%), by Application 2024 & 2032
- Figure 40: Middle East and Africa Bio Gas Plants Industry Revenue (Million), by Biogas Plant Type 2024 & 2032
- Figure 41: Middle East and Africa Bio Gas Plants Industry Revenue Share (%), by Biogas Plant Type 2024 & 2032
- Figure 42: Middle East and Africa Bio Gas Plants Industry Revenue (Million), by Country 2024 & 2032
- Figure 43: Middle East and Africa Bio Gas Plants Industry Revenue Share (%), by Country 2024 & 2032
List of Tables
- Table 1: Global Bio Gas Plants Industry Revenue Million Forecast, by Region 2019 & 2032
- Table 2: Global Bio Gas Plants Industry Revenue Million Forecast, by Application 2019 & 2032
- Table 3: Global Bio Gas Plants Industry Revenue Million Forecast, by Biogas Plant Type 2019 & 2032
- Table 4: Global Bio Gas Plants Industry Revenue Million Forecast, by Region 2019 & 2032
- Table 5: Global Bio Gas Plants Industry Revenue Million Forecast, by Country 2019 & 2032
- Table 6: United States Bio Gas Plants Industry Revenue (Million) Forecast, by Application 2019 & 2032
- Table 7: Canada Bio Gas Plants Industry Revenue (Million) Forecast, by Application 2019 & 2032
- Table 8: Mexico Bio Gas Plants Industry Revenue (Million) Forecast, by Application 2019 & 2032
- Table 9: Global Bio Gas Plants Industry Revenue Million Forecast, by Country 2019 & 2032
- Table 10: Germany Bio Gas Plants Industry Revenue (Million) Forecast, by Application 2019 & 2032
- Table 11: United Kingdom Bio Gas Plants Industry Revenue (Million) Forecast, by Application 2019 & 2032
- Table 12: France Bio Gas Plants Industry Revenue (Million) Forecast, by Application 2019 & 2032
- Table 13: Spain Bio Gas Plants Industry Revenue (Million) Forecast, by Application 2019 & 2032
- Table 14: Italy Bio Gas Plants Industry Revenue (Million) Forecast, by Application 2019 & 2032
- Table 15: Spain Bio Gas Plants Industry Revenue (Million) Forecast, by Application 2019 & 2032
- Table 16: Belgium Bio Gas Plants Industry Revenue (Million) Forecast, by Application 2019 & 2032
- Table 17: Netherland Bio Gas Plants Industry Revenue (Million) Forecast, by Application 2019 & 2032
- Table 18: Nordics Bio Gas Plants Industry Revenue (Million) Forecast, by Application 2019 & 2032
- Table 19: Rest of Europe Bio Gas Plants Industry Revenue (Million) Forecast, by Application 2019 & 2032
- Table 20: Global Bio Gas Plants Industry Revenue Million Forecast, by Country 2019 & 2032
- Table 21: China Bio Gas Plants Industry Revenue (Million) Forecast, by Application 2019 & 2032
- Table 22: Japan Bio Gas Plants Industry Revenue (Million) Forecast, by Application 2019 & 2032
- Table 23: India Bio Gas Plants Industry Revenue (Million) Forecast, by Application 2019 & 2032
- Table 24: South Korea Bio Gas Plants Industry Revenue (Million) Forecast, by Application 2019 & 2032
- Table 25: Southeast Asia Bio Gas Plants Industry Revenue (Million) Forecast, by Application 2019 & 2032
- Table 26: Australia Bio Gas Plants Industry Revenue (Million) Forecast, by Application 2019 & 2032
- Table 27: Indonesia Bio Gas Plants Industry Revenue (Million) Forecast, by Application 2019 & 2032
- Table 28: Phillipes Bio Gas Plants Industry Revenue (Million) Forecast, by Application 2019 & 2032
- Table 29: Singapore Bio Gas Plants Industry Revenue (Million) Forecast, by Application 2019 & 2032
- Table 30: Thailandc Bio Gas Plants Industry Revenue (Million) Forecast, by Application 2019 & 2032
- Table 31: Rest of Asia Pacific Bio Gas Plants Industry Revenue (Million) Forecast, by Application 2019 & 2032
- Table 32: Global Bio Gas Plants Industry Revenue Million Forecast, by Country 2019 & 2032
- Table 33: Brazil Bio Gas Plants Industry Revenue (Million) Forecast, by Application 2019 & 2032
- Table 34: Argentina Bio Gas Plants Industry Revenue (Million) Forecast, by Application 2019 & 2032
- Table 35: Peru Bio Gas Plants Industry Revenue (Million) Forecast, by Application 2019 & 2032
- Table 36: Chile Bio Gas Plants Industry Revenue (Million) Forecast, by Application 2019 & 2032
- Table 37: Colombia Bio Gas Plants Industry Revenue (Million) Forecast, by Application 2019 & 2032
- Table 38: Ecuador Bio Gas Plants Industry Revenue (Million) Forecast, by Application 2019 & 2032
- Table 39: Venezuela Bio Gas Plants Industry Revenue (Million) Forecast, by Application 2019 & 2032
- Table 40: Rest of South America Bio Gas Plants Industry Revenue (Million) Forecast, by Application 2019 & 2032
- Table 41: Global Bio Gas Plants Industry Revenue Million Forecast, by Country 2019 & 2032
- Table 42: United States Bio Gas Plants Industry Revenue (Million) Forecast, by Application 2019 & 2032
- Table 43: Canada Bio Gas Plants Industry Revenue (Million) Forecast, by Application 2019 & 2032
- Table 44: Mexico Bio Gas Plants Industry Revenue (Million) Forecast, by Application 2019 & 2032
- Table 45: Global Bio Gas Plants Industry Revenue Million Forecast, by Country 2019 & 2032
- Table 46: United Arab Emirates Bio Gas Plants Industry Revenue (Million) Forecast, by Application 2019 & 2032
- Table 47: Saudi Arabia Bio Gas Plants Industry Revenue (Million) Forecast, by Application 2019 & 2032
- Table 48: South Africa Bio Gas Plants Industry Revenue (Million) Forecast, by Application 2019 & 2032
- Table 49: Rest of Middle East and Africa Bio Gas Plants Industry Revenue (Million) Forecast, by Application 2019 & 2032
- Table 50: Global Bio Gas Plants Industry Revenue Million Forecast, by Application 2019 & 2032
- Table 51: Global Bio Gas Plants Industry Revenue Million Forecast, by Biogas Plant Type 2019 & 2032
- Table 52: Global Bio Gas Plants Industry Revenue Million Forecast, by Country 2019 & 2032
- Table 53: Global Bio Gas Plants Industry Revenue Million Forecast, by Application 2019 & 2032
- Table 54: Global Bio Gas Plants Industry Revenue Million Forecast, by Biogas Plant Type 2019 & 2032
- Table 55: Global Bio Gas Plants Industry Revenue Million Forecast, by Country 2019 & 2032
- Table 56: Global Bio Gas Plants Industry Revenue Million Forecast, by Application 2019 & 2032
- Table 57: Global Bio Gas Plants Industry Revenue Million Forecast, by Biogas Plant Type 2019 & 2032
- Table 58: Global Bio Gas Plants Industry Revenue Million Forecast, by Country 2019 & 2032
- Table 59: Global Bio Gas Plants Industry Revenue Million Forecast, by Application 2019 & 2032
- Table 60: Global Bio Gas Plants Industry Revenue Million Forecast, by Biogas Plant Type 2019 & 2032
- Table 61: Global Bio Gas Plants Industry Revenue Million Forecast, by Country 2019 & 2032
- Table 62: Global Bio Gas Plants Industry Revenue Million Forecast, by Application 2019 & 2032
- Table 63: Global Bio Gas Plants Industry Revenue Million Forecast, by Biogas Plant Type 2019 & 2032
- Table 64: Global Bio Gas Plants Industry Revenue Million Forecast, by Country 2019 & 2032
Frequently Asked Questions
1. What is the projected Compound Annual Growth Rate (CAGR) of the Bio Gas Plants Industry?
The projected CAGR is approximately 3.15%.
2. Which companies are prominent players in the Bio Gas Plants Industry?
Key companies in the market include Agraferm GmbH*List Not Exhaustive, Ameresco, A2A SpA, Engie SA, EnviTec Biogas AG, BTS Biogas SRL/GmbH, Gasum Oy, Air Liquide SA, AB Holding SpA (Gruppo AB), FWE GmbH, Scandinavian Biogas.
3. What are the main segments of the Bio Gas Plants Industry?
The market segments include Application, Biogas Plant Type.
4. Can you provide details about the market size?
The market size is estimated to be USD XX Million as of 2022.
5. What are some drivers contributing to market growth?
4.; Increase in the Demand for Electricity4.; Rising Adoption of Electric Vehicles.
6. What are the notable trends driving market growth?
Small-scale Digesters Expected to Witness Significant Growth.
7. Are there any restraints impacting market growth?
4.; New Sources of Distributed Electricity Generation.
8. Can you provide examples of recent developments in the market?
In August 2021, Greenlane Renewables Inc. announced that its wholly-owned subsidiary, Greenlane Biogas North America Ltd, signed a total of USD 10.2 million in contracts for renewable natural gas (RNG) projects in the United States.
9. What pricing options are available for accessing the report?
Pricing options include single-user, multi-user, and enterprise licenses priced at USD 4750, USD 5250, and USD 8750 respectively.
10. Is the market size provided in terms of value or volume?
The market size is provided in terms of value, measured in Million.
11. Are there any specific market keywords associated with the report?
Yes, the market keyword associated with the report is "Bio Gas Plants Industry," which aids in identifying and referencing the specific market segment covered.
12. How do I determine which pricing option suits my needs best?
The pricing options vary based on user requirements and access needs. Individual users may opt for single-user licenses, while businesses requiring broader access may choose multi-user or enterprise licenses for cost-effective access to the report.
13. Are there any additional resources or data provided in the Bio Gas Plants Industry report?
While the report offers comprehensive insights, it's advisable to review the specific contents or supplementary materials provided to ascertain if additional resources or data are available.
14. How can I stay updated on further developments or reports in the Bio Gas Plants Industry?
To stay informed about further developments, trends, and reports in the Bio Gas Plants Industry, consider subscribing to industry newsletters, following relevant companies and organizations, or regularly checking reputable industry news sources and publications.
Methodology
Step 1 - Identification of Relevant Samples Size from Population Database


Step 2 - Approaches for Defining Global Market Size (Value, Volume* & Price*)

Note*: In applicable scenarios
Step 3 - Data Sources
Primary Research
- Web Analytics
- Survey Reports
- Research Institute
- Latest Research Reports
- Opinion Leaders
Secondary Research
- Annual Reports
- White Paper
- Latest Press Release
- Industry Association
- Paid Database
- Investor Presentations

Step 4 - Data Triangulation
Involves using different sources of information in order to increase the validity of a study
These sources are likely to be stakeholders in a program - participants, other researchers, program staff, other community members, and so on.
Then we put all data in single framework & apply various statistical tools to find out the dynamic on the market.
During the analysis stage, feedback from the stakeholder groups would be compared to determine areas of agreement as well as areas of divergence
